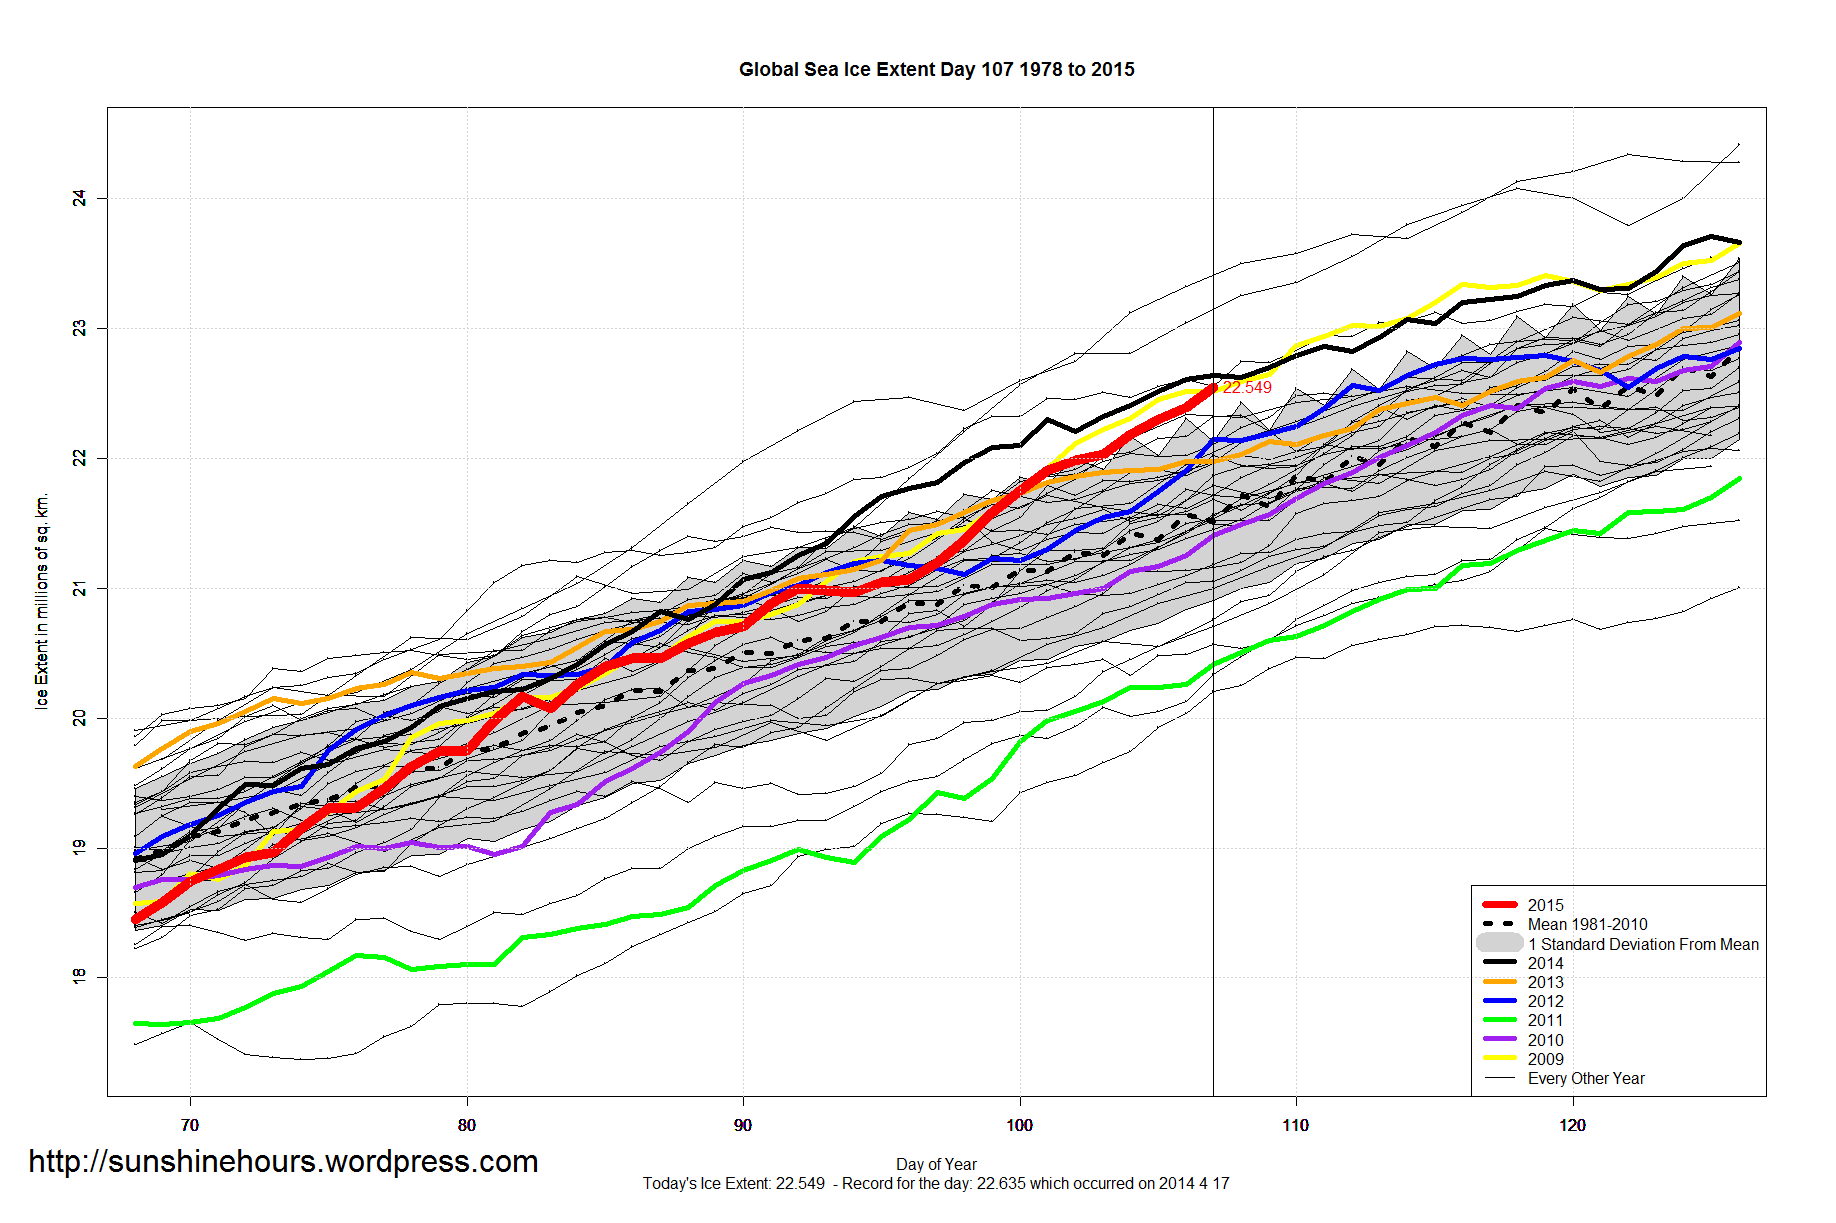
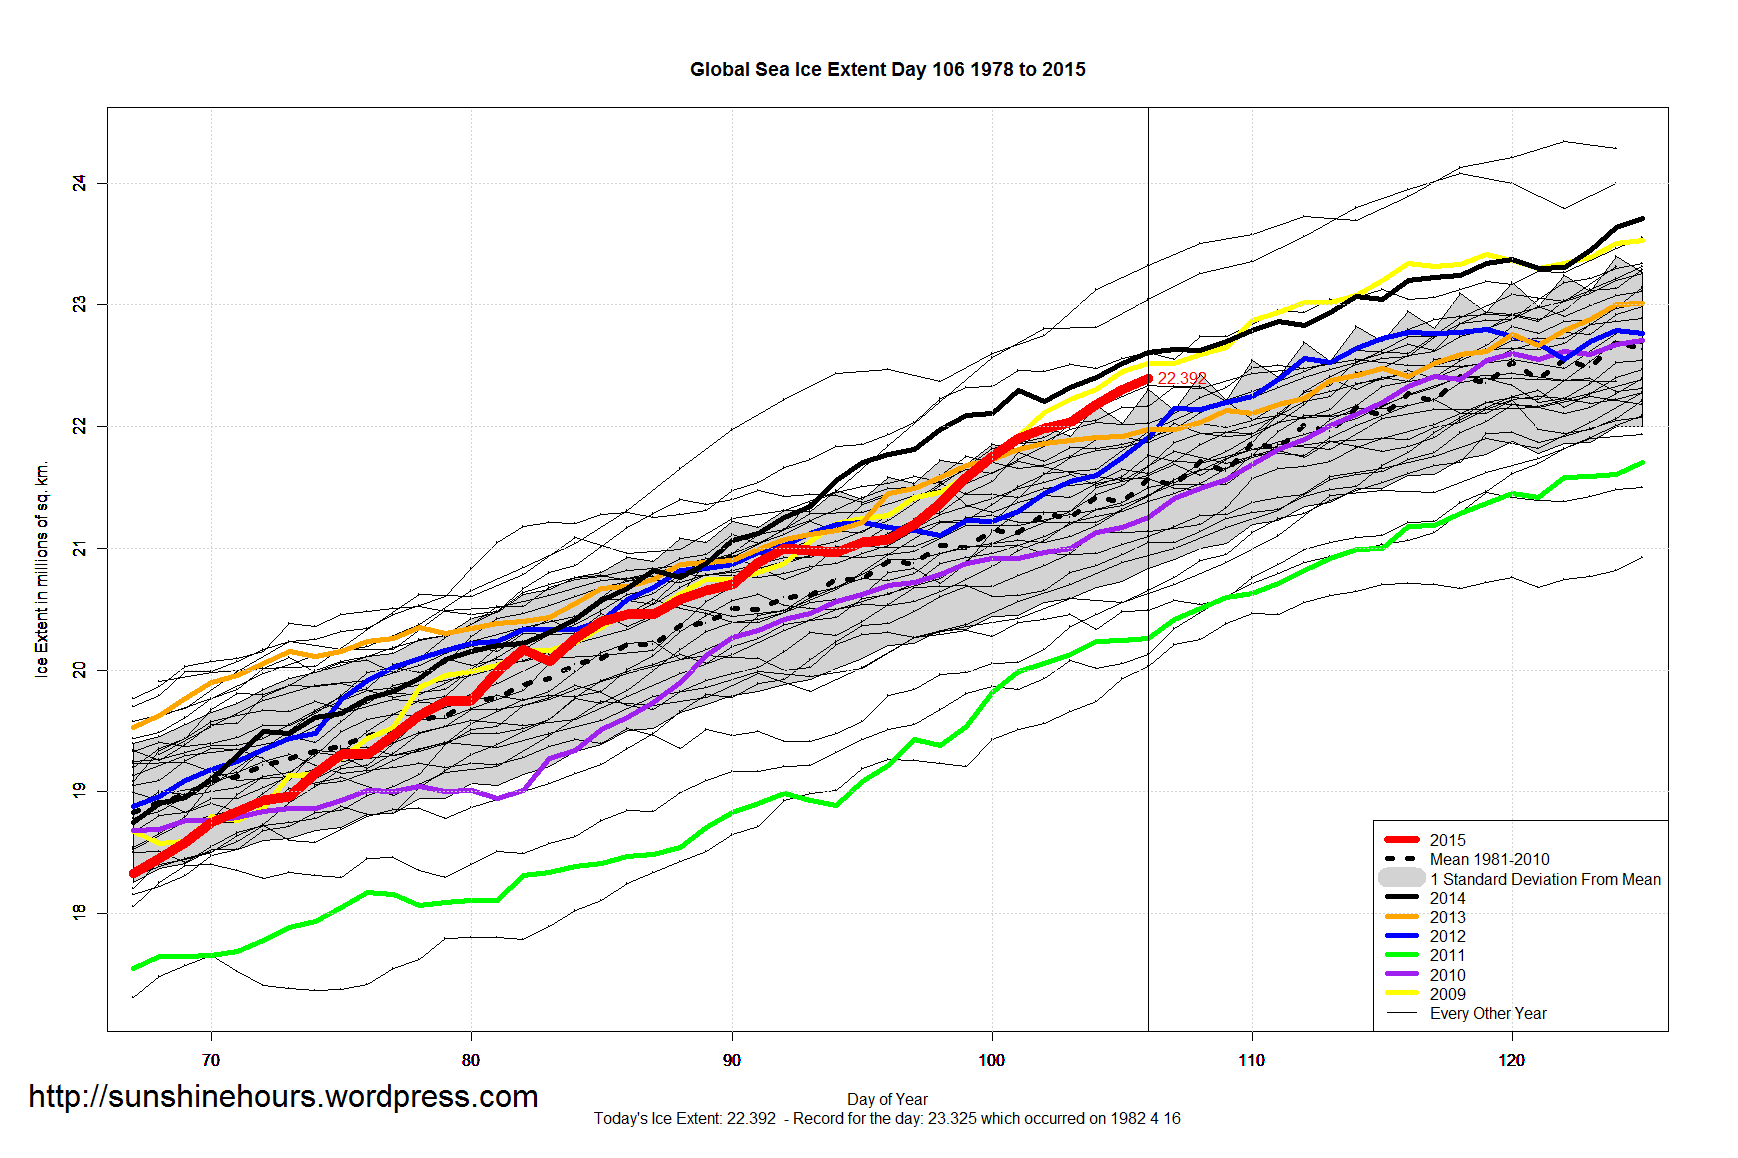
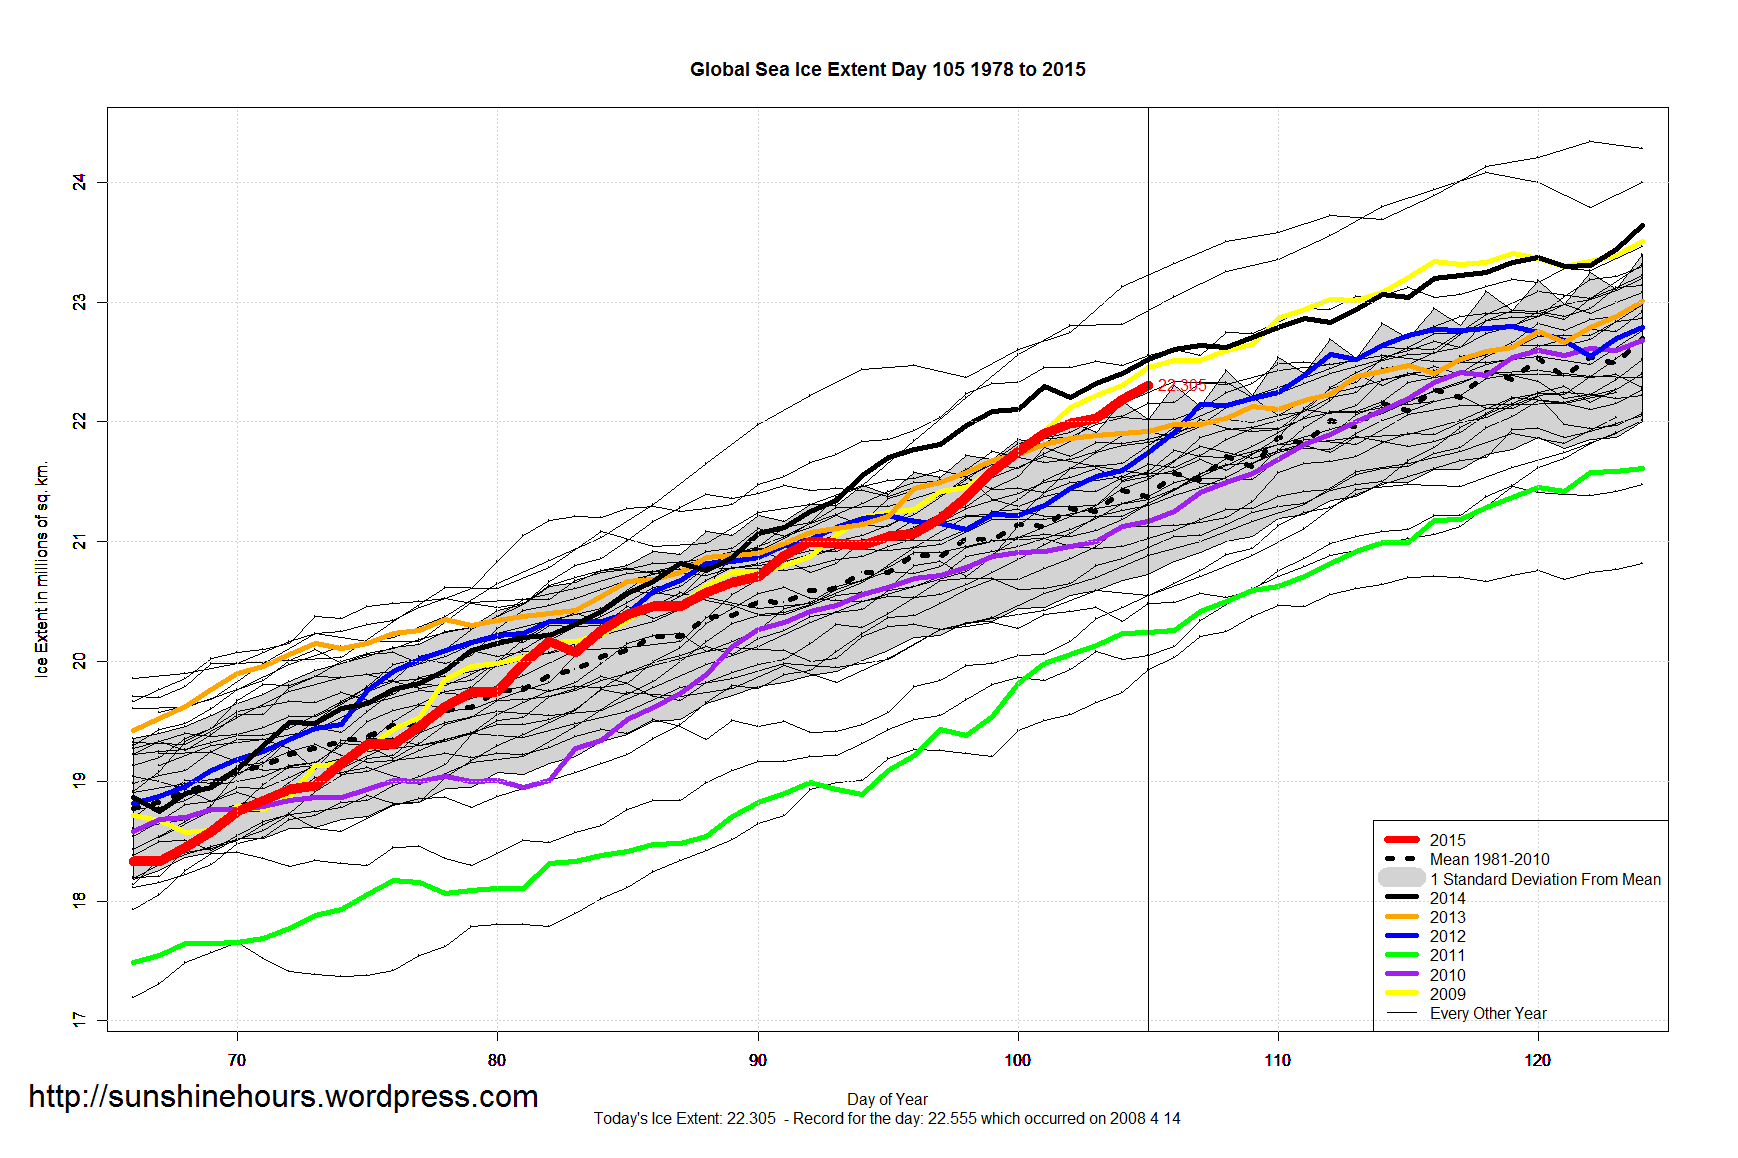
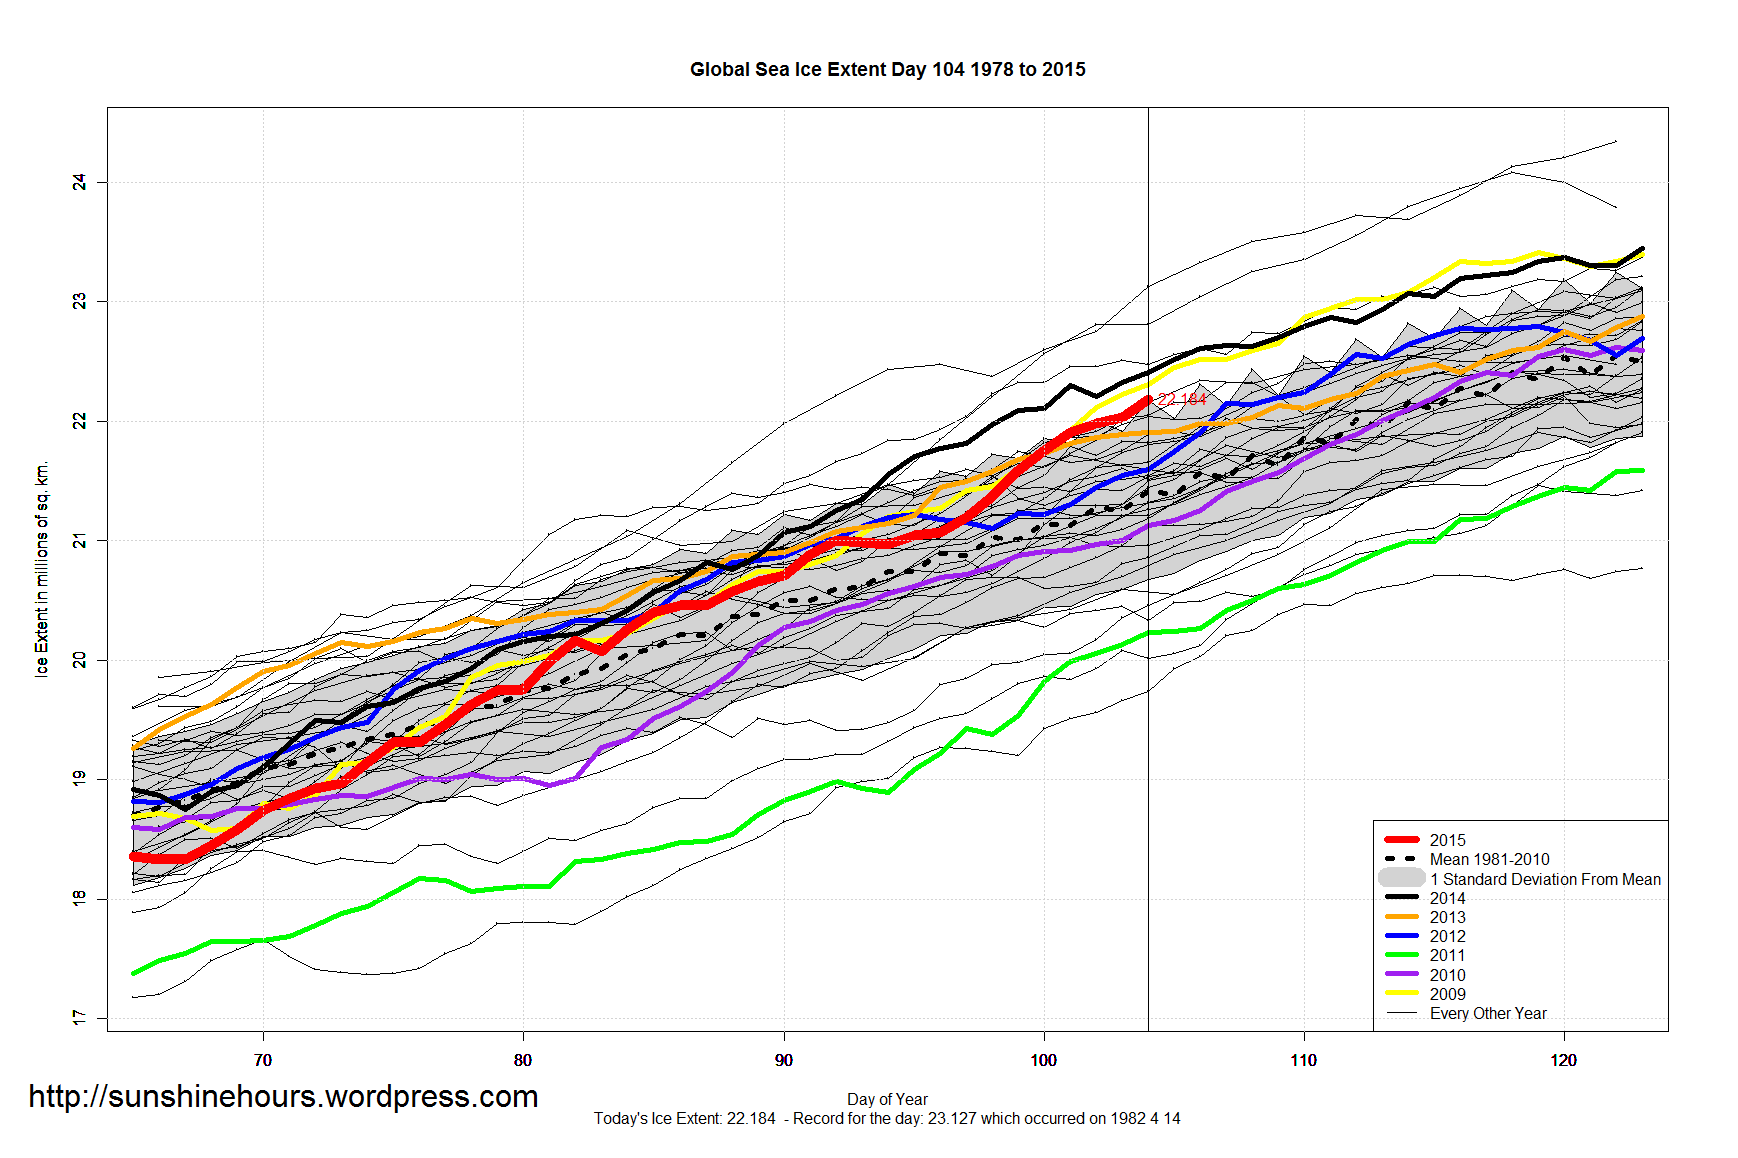
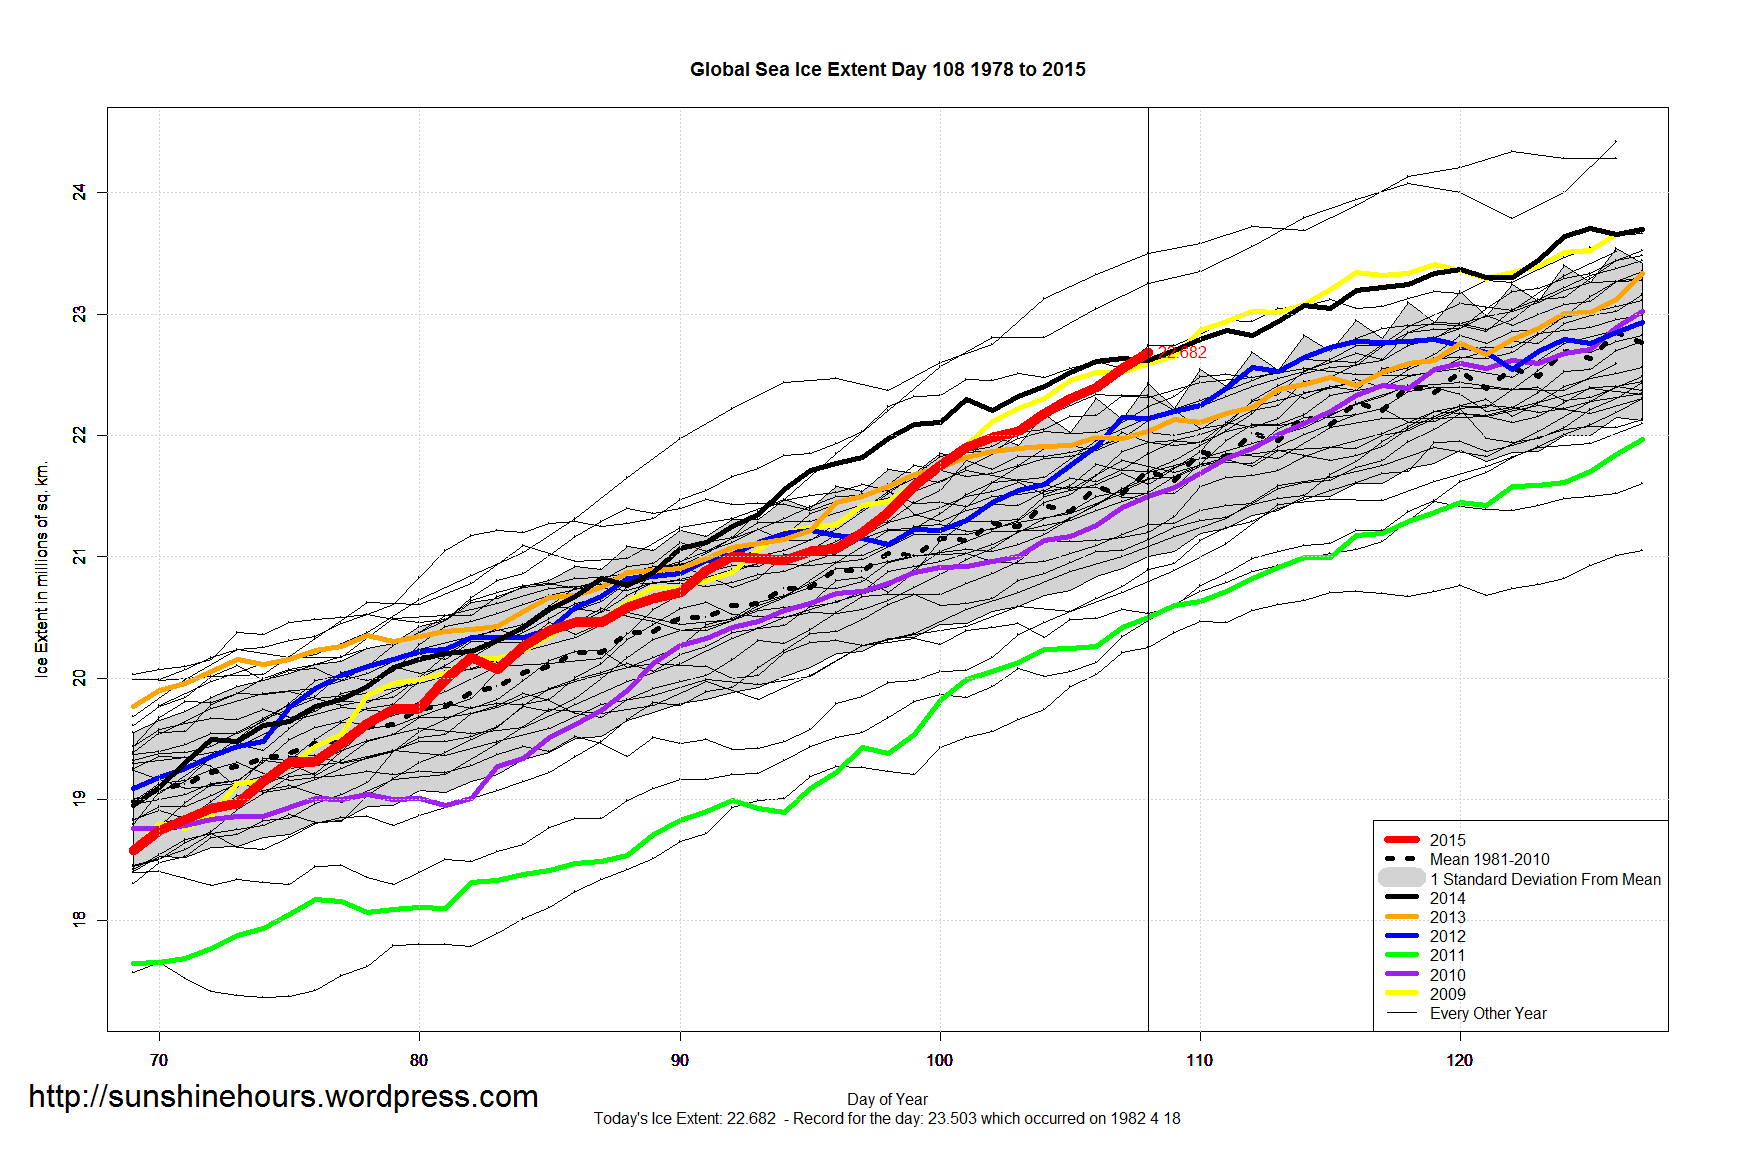
4th Highest Global Sea Ice For This Day. Above one standard deviation.
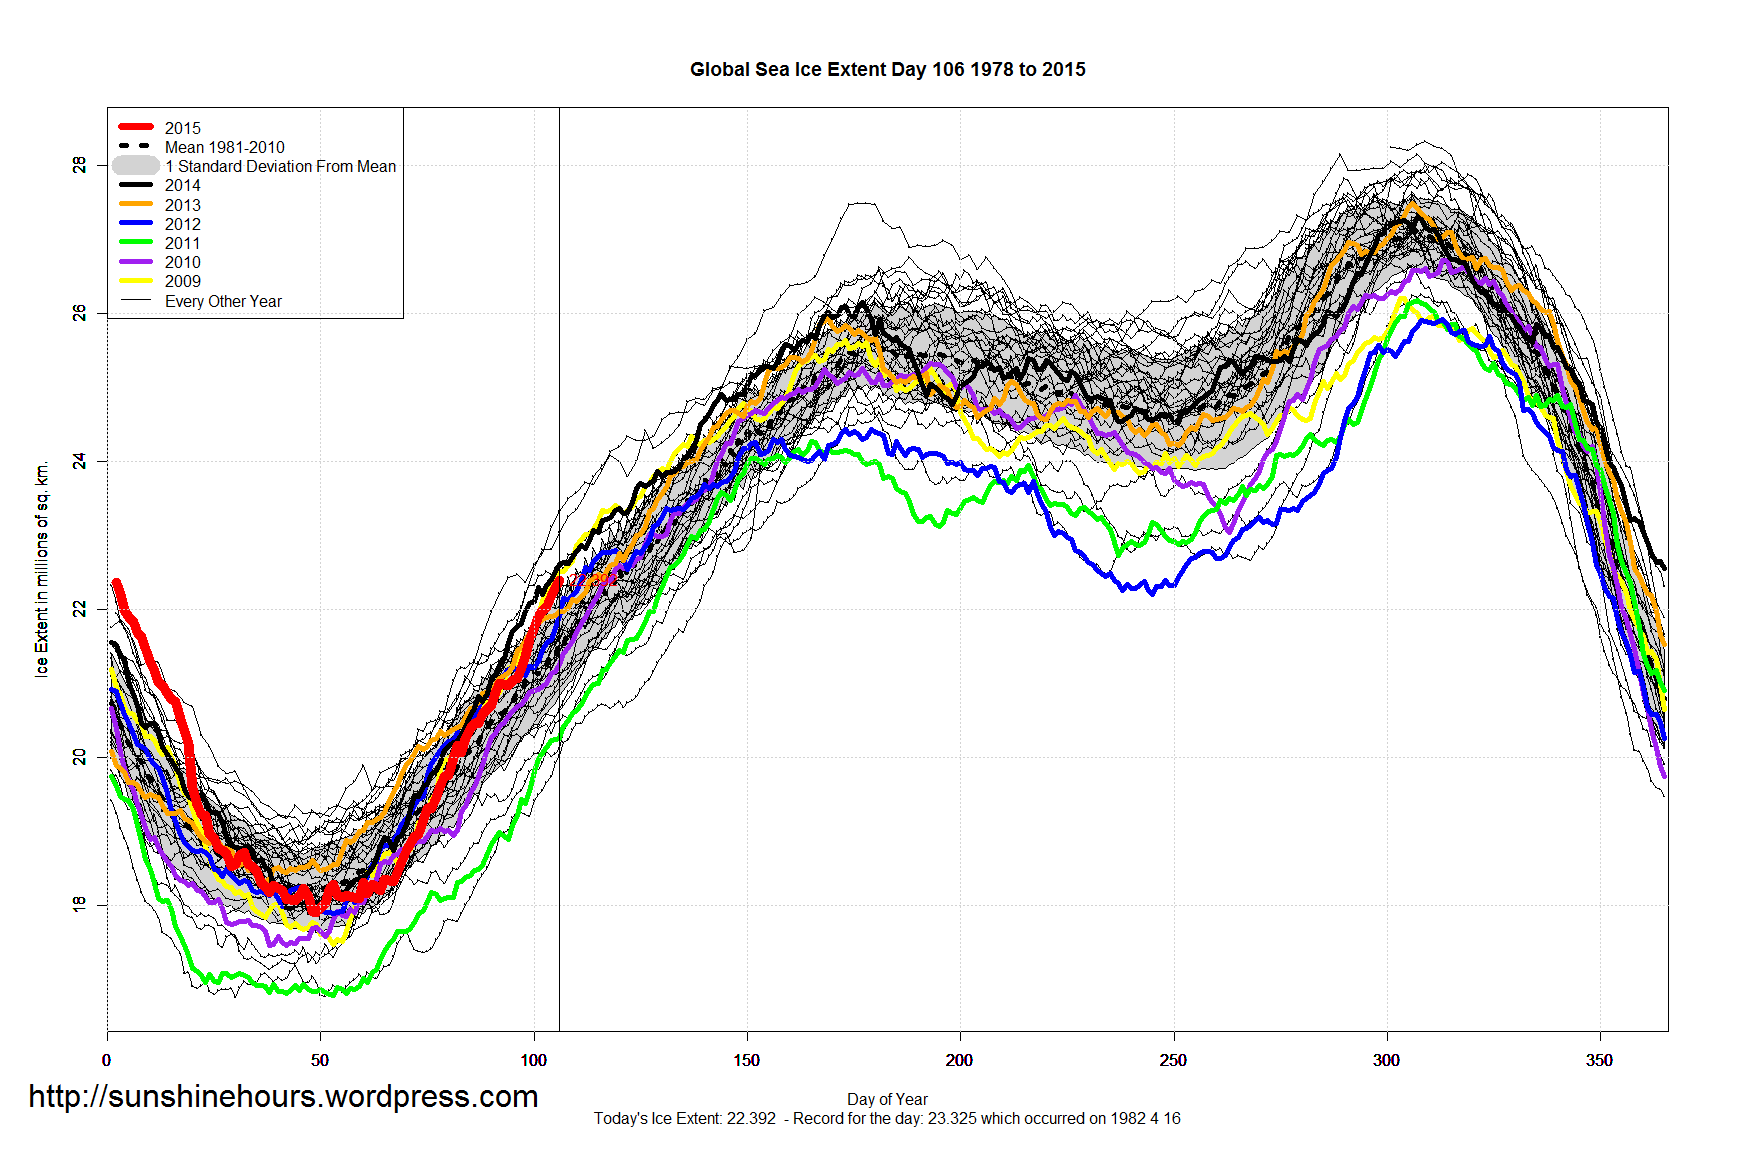
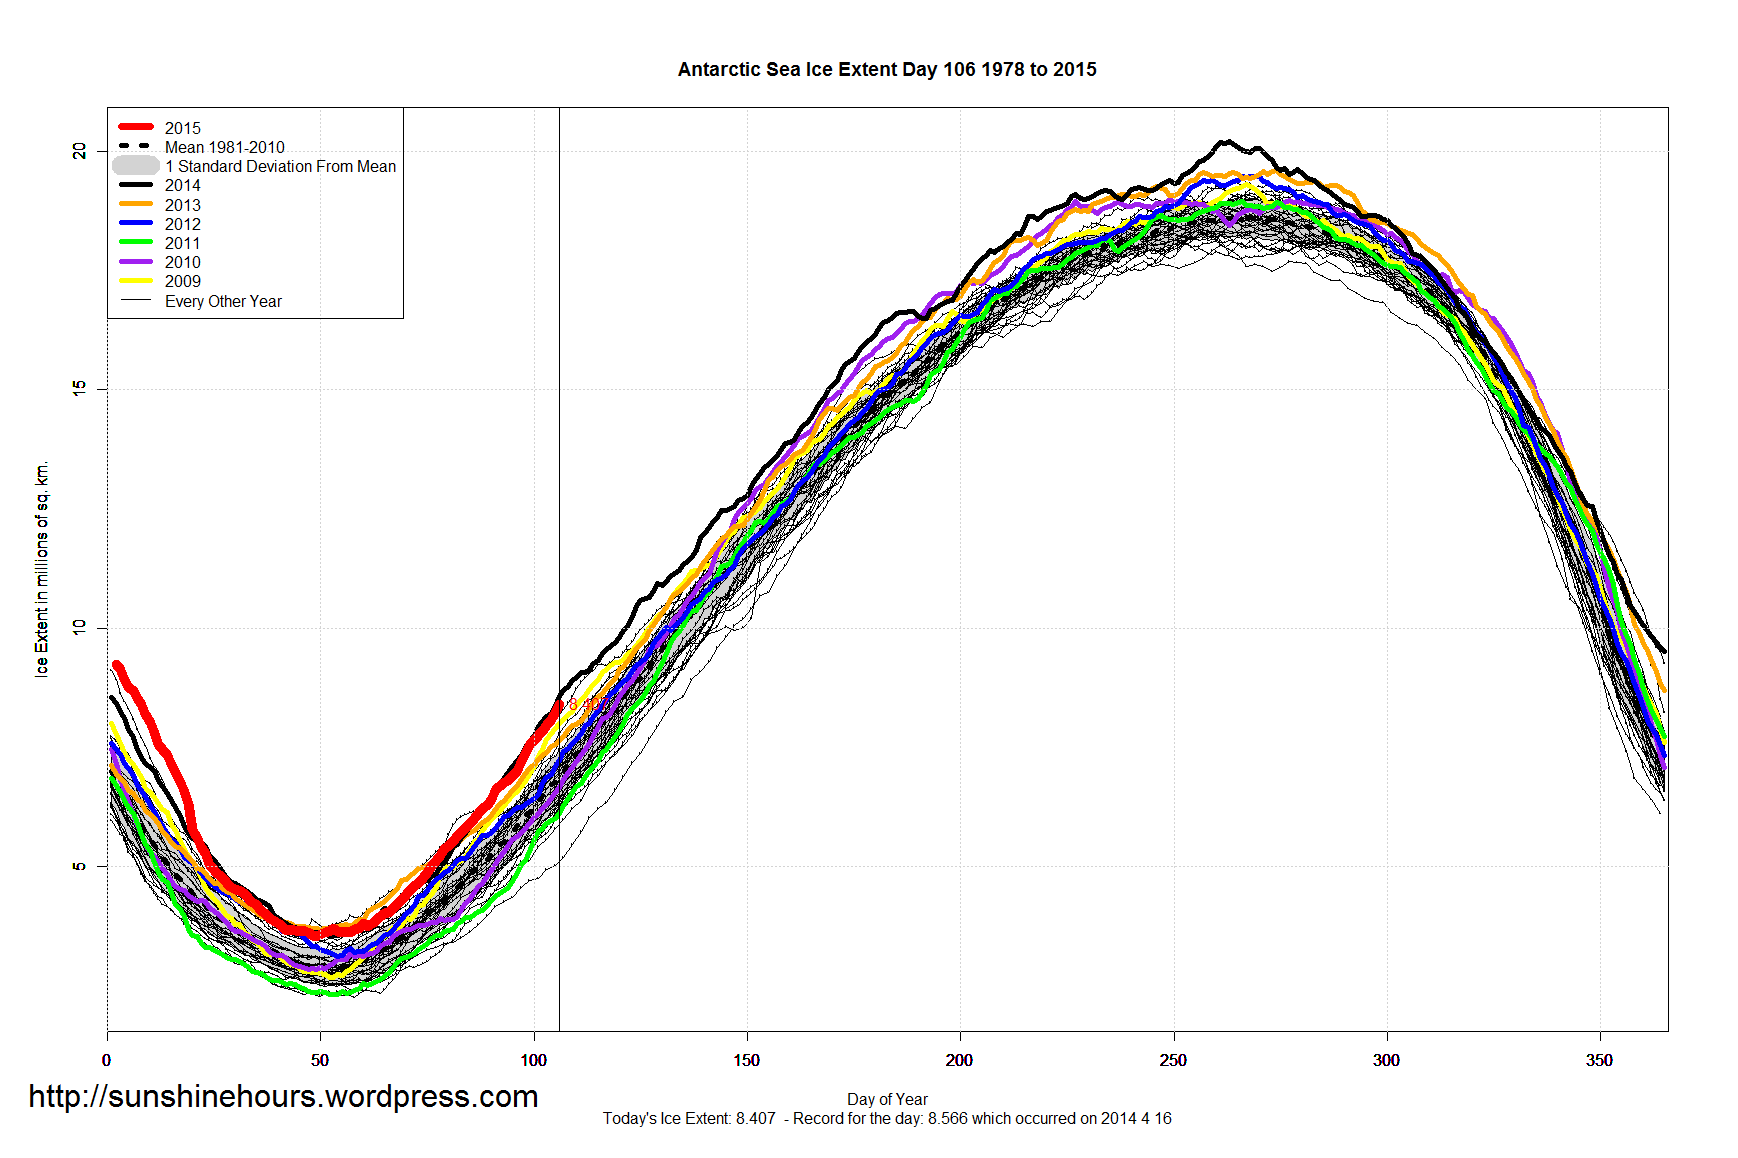
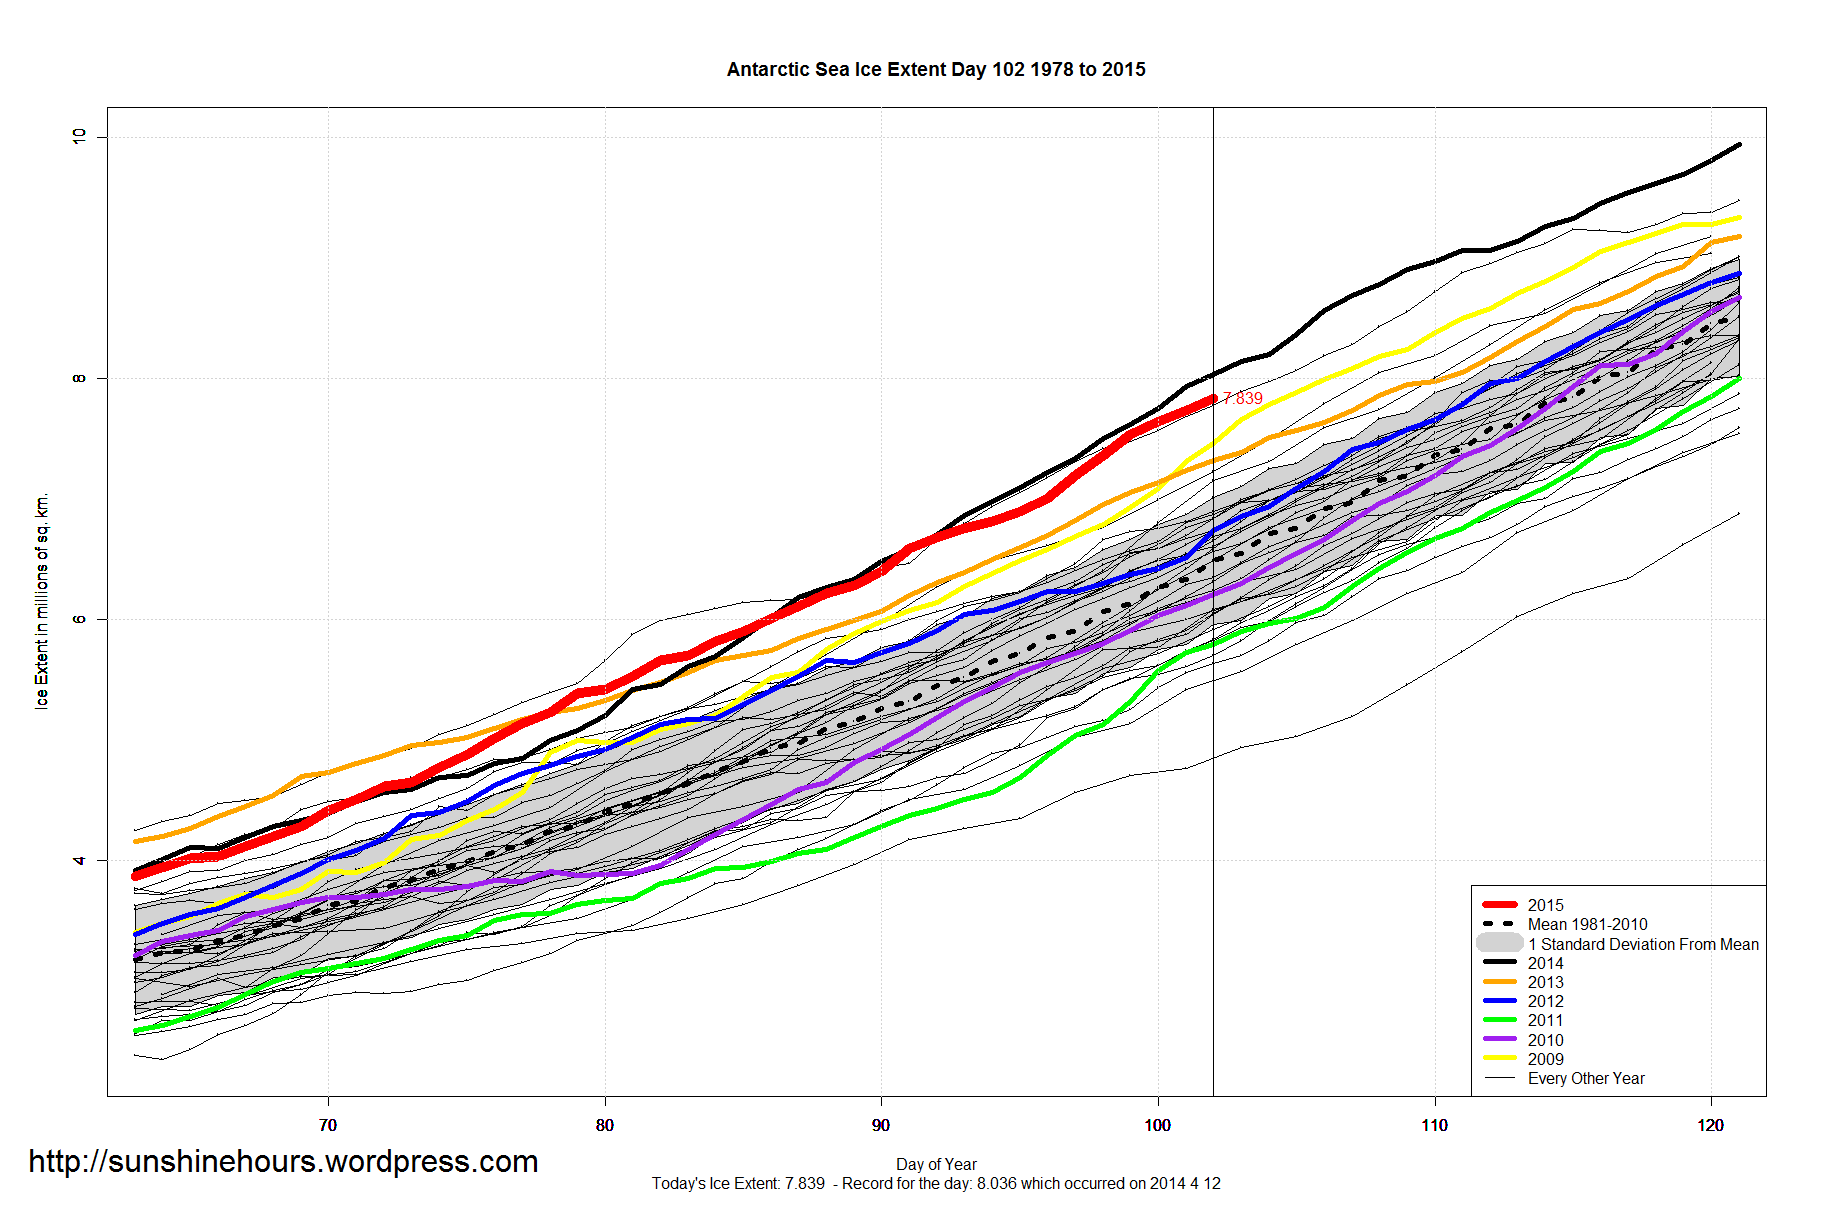
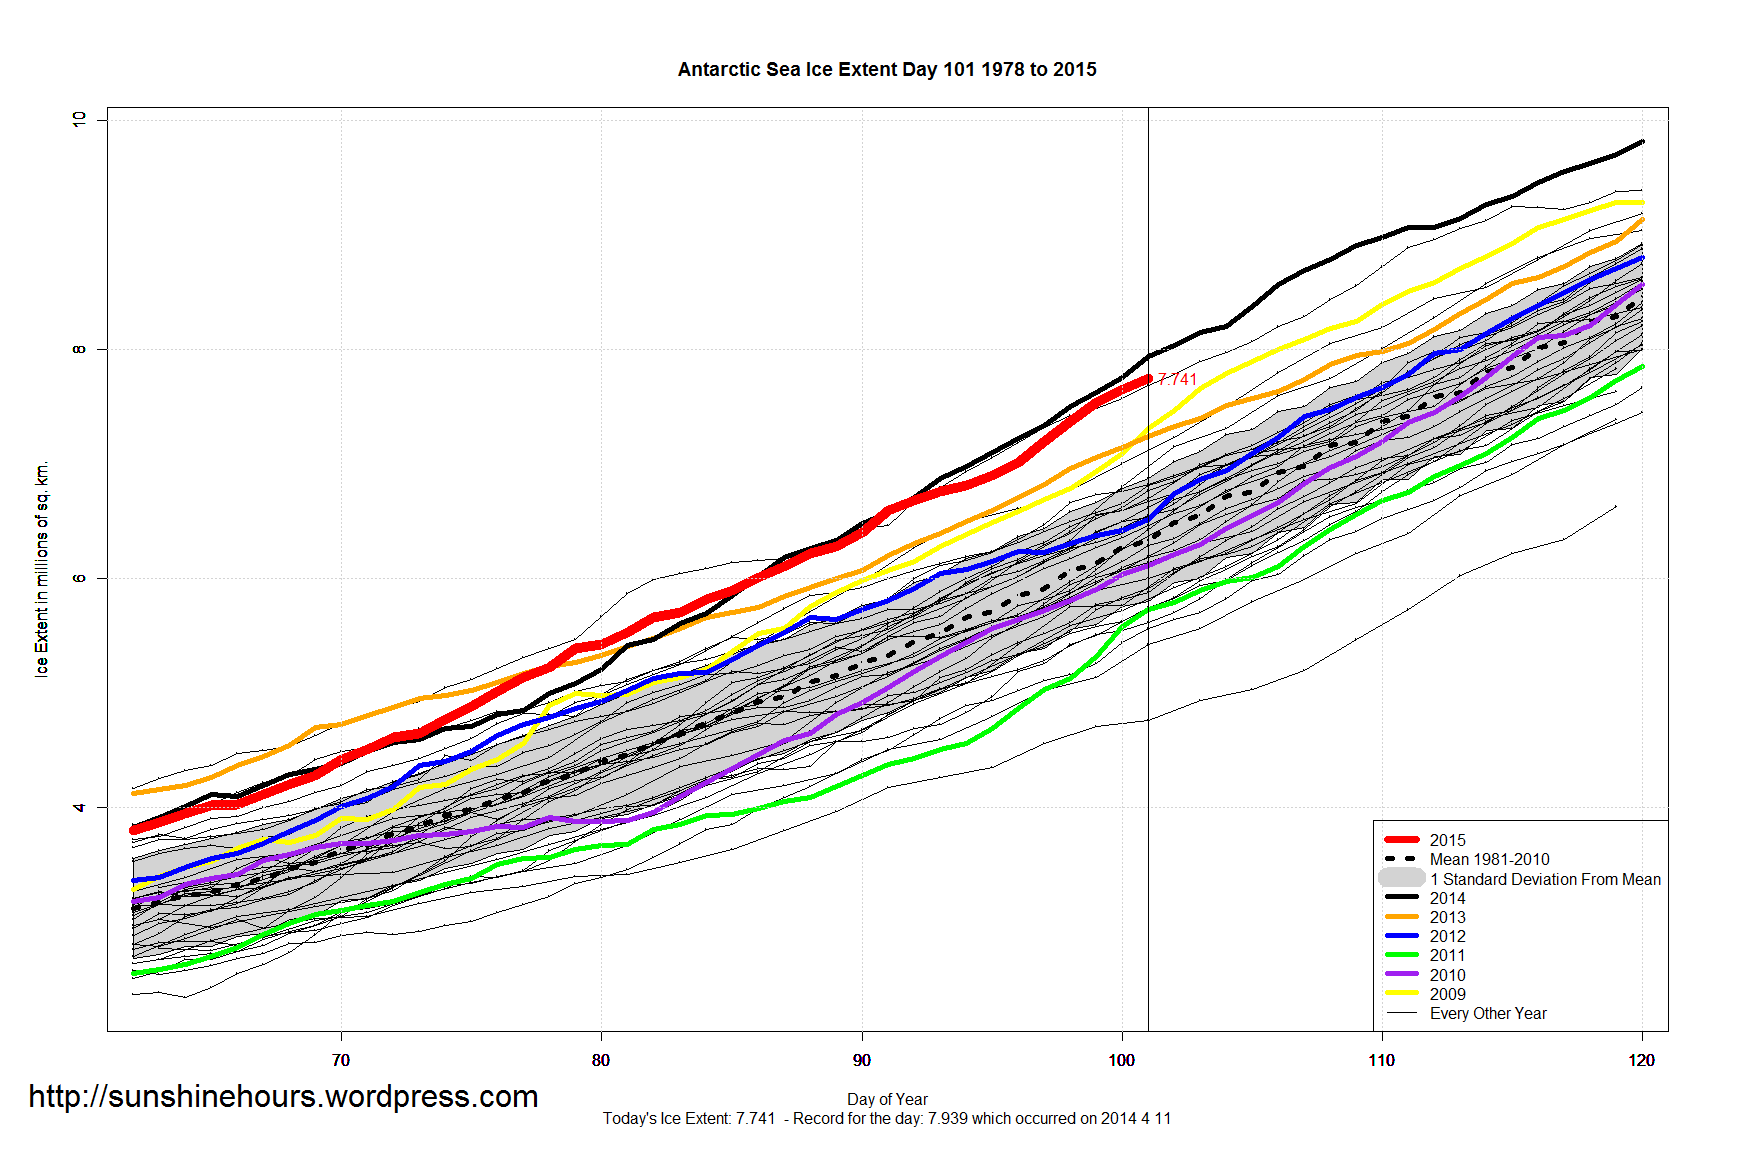
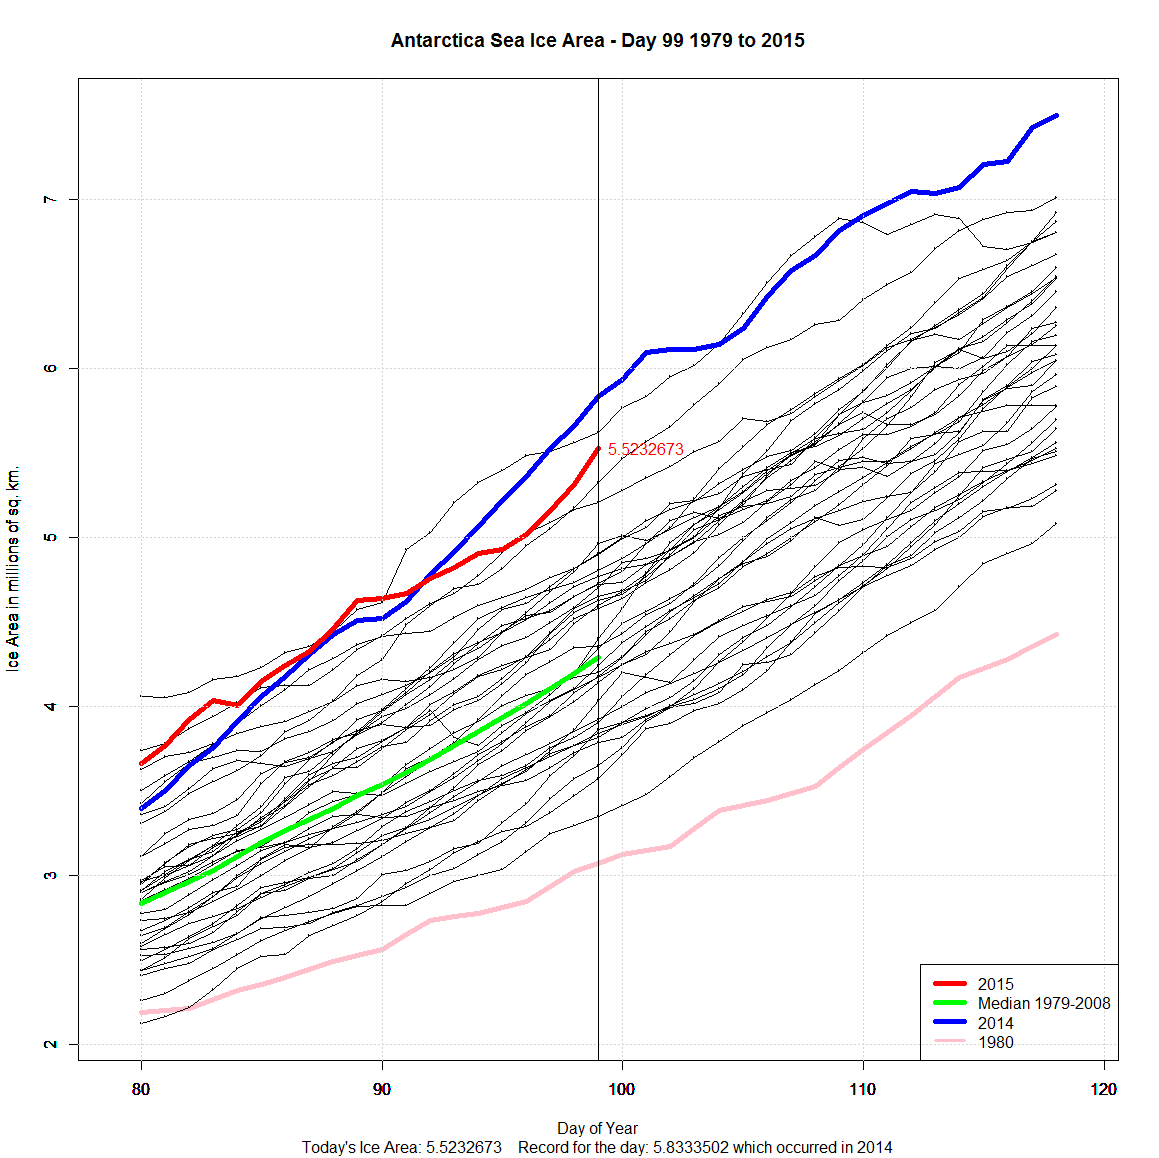
Antarctic 1.6 million above the 1981-2010 mean.

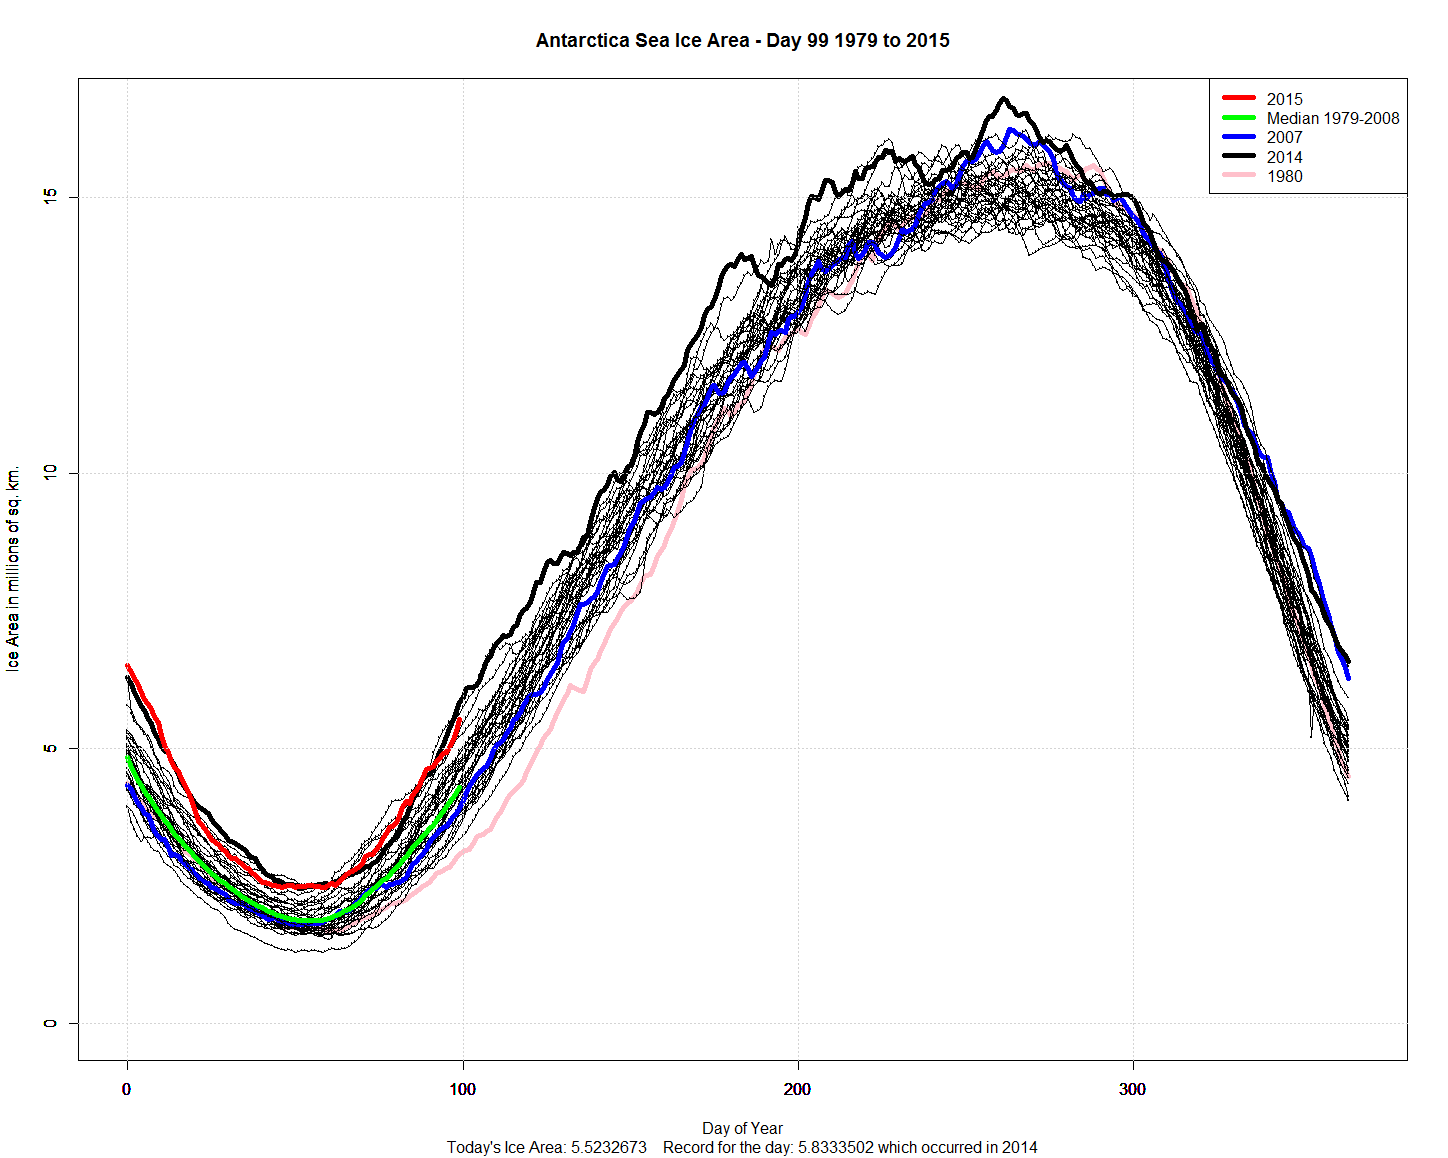
I usually do Sea Ice Extent. But I had a request for Area.
Antarctic Sea Ice Area Data is here. It is usually 5-6 days behind NSIDC Extent data.
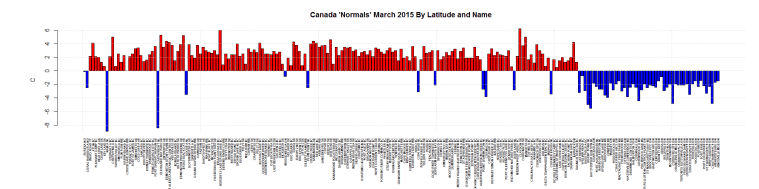
These are just the stations deemed ‘Normals” by Environment Canada. The temperature is the departure from the 1971-2000 average in Celsius. I’m using monthly summary.
This graphs data is sorted by Longitude (West to East) and By Name. Click for bigger.

This graphs data is sorted by Latitude (North to South) and By Name. Click for bigger.