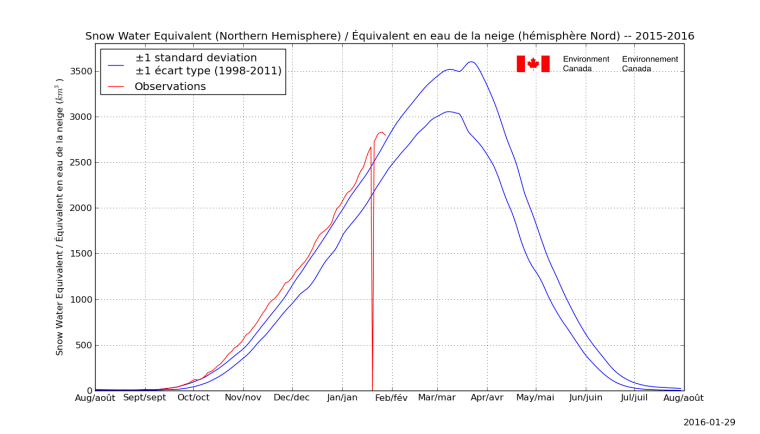
Northern Hemisphere Snow Water Equivalent above normal all year.
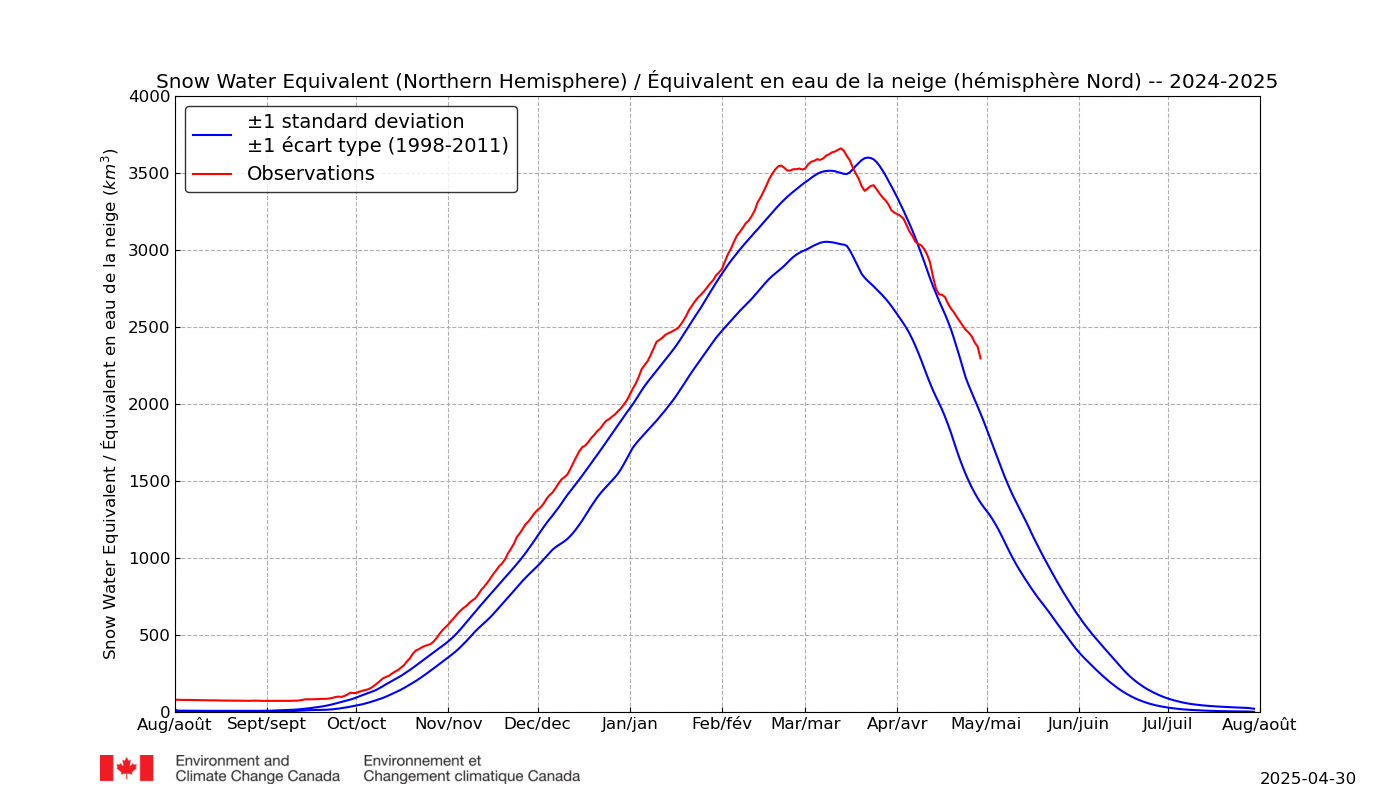
Northern Hemisphere Snow Water Equivalent above normal all year.
I posted some data about temperatures in Edmonton and Alberta. I wanted to visualize it. So I’ve made a grid.
The source of the data is Environment Canadas monthly summaries.
I’m using Tmax, not Tmean. (The logic being that max temps are the problem)
And I’m starting with the July only average for the decade. (I’ll expand in later posts).
There are 1087 stations with July data in Alberta.
I’m narrowing it down to stations with 25 years of data and data all the way up to 2017 and 80% complate.
Things to note:
Only 29 stations make the cut. Only 1 station has the 2010s as the decade with the hottest July average Tmax.
Only 2 stations have data from the 1940s (none before that).
So … AGW ain’t going to kill Albertans in July. They already survived July in the 2000s.
And there isn’t any stations with old and new data. (By that I mean the 30s).
| Station |
Station No |
Records | Min Year | Max Year | pct of data | 2010s | 2000s | 1990s | 1980s | 1970s | 1960s | 1950s | 1940s | 1930s | 1920s | 1910s | 1900s | 1890s | 1880s |
| KANANASKIS | 3053600 | 77 | 1940 | 2017 | 98.7 | 30.4 | 31.1 | 28.3 | 30.1 | 29.3 | 28.8 | 29.3 | 29.9 | – | – | – | – | – | – |
| CAMROSE | 3011240 | 70 | 1946 | 2017 | 97.2 | 29.9 | 31.6 | 28.7 | 30 | 29.1 | 31.1 | 31.2 | 30.9 | – | – | – | – | – | – |
| COLD LAKE A | 3081680 | 65 | 1953 | 2017 | 100 | 30.2 | 31.2 | 29.8 | 30 | 29.3 | 31.4 | 30.9 | – | – | – | – | – | – | – |
| FORT SASKATCHEWAN | 3012710 | 58 | 1958 | 2017 | 96.7 | 31.4 | 32 | 29 | 30.3 | 29.9 | 31.6 | 33.9 | – | – | – | – | – | – | – |
| CRAIGMYLE | 3021940 | 52 | 1960 | 2017 | 89.7 | 31.8 | 33.5 | 30.3 | 32.8 | 32.6 | 32.7 | – | – | – | – | – | – | – | – |
| EDMONTON STONY PLAIN | 301222F | 52 | 1966 | 2017 | 100 | 29.8 | 30.8 | 27.8 | 29.2 | 28.4 | 28.6 | – | – | – | – | – | – | – | – |
| QUEENSTOWN | 3035340 | 51 | 1967 | 2017 | 100 | 31.9 | 33.3 | 31.4 | 33.8 | 34.2 | 32.2 | – | – | – | – | – | – | – | – |
| FORESTBURG PLANT SITE | 3012652 | 50 | 1968 | 2017 | 100 | 31.7 | 34 | 30.9 | 32.6 | 31.8 | 31.7 | – | – | – | – | – | – | – | – |
| HIGH LEVEL A | 3073146 | 47 | 1971 | 2017 | 100 | 30.9 | 29.9 | 29.7 | 29.8 | 29.2 | – | – | – | – | – | – | – | – | – |
| SIMONETTE | 3075937 | 44 | 1974 | 2017 | 100 | 28.9 | 30 | 29.1 | 29.3 | 28.6 | – | – | – | – | – | – | – | – | – |
| VEGREVILLE | 3016GF0 | 37 | 1981 | 2017 | 100 | 30.7 | 31.3 | 29.7 | 30.3 | – | – | – | – | – | – | – | – | – | – |
| FABYAN | 3012515 | 36 | 1981 | 2017 | 97.3 | 29.9 | 32.2 | 29.7 | 31.9 | – | – | – | – | – | – | – | – | – | – |
| LLOYDMINSTER A | 3013961 | 36 | 1982 | 2017 | 100 | 29.4 | 31.6 | 29.6 | 31.7 | – | – | – | – | – | – | – | – | – | – |
| ELK ISLAND NAT PARK | 3012275 | 33 | 1982 | 2017 | 91.7 | 30.8 | 31.3 | 29.9 | 29.4 | – | – | – | – | – | – | – | – | – | – |
| BRULE BLACK CAT | 3060903 | 31 | 1987 | 2017 | 100 | 30.7 | 31 | 28.8 | 29.8 | – | – | – | – | – | – | – | – | – | – |
| PICTURE BUTTE WEST | 303N1G3 | 31 | 1987 | 2017 | 100 | 33.6 | 34.6 | 31.3 | 33.2 | – | – | – | – | – | – | – | – | – | – |
| ENTWISTLE | 3062451 | 30 | 1988 | 2017 | 100 | 29.9 | 31.3 | 29.1 | 29.8 | – | – | – | – | – | – | – | – | – | – |
| UNIVERSITY OF ALBERTA METABOLIC CENTRE | 301FFNJ | 30 | 1987 | 2017 | 96.8 | 31.8 | 32.2 | 29.5 | 30.8 | – | – | – | – | – | – | – | – | – | – |
| OKOTOKS | 303M9JM | 28 | 1990 | 2017 | 100 | 32.8 | 33.3 | 29.9 | – | – | – | – | – | – | – | – | – | – | – |
| BROOKS | 3030QLP | 26 | 1989 | 2017 | 89.7 | 33.3 | 35 | 33.2 | 34 | – | – | – | – | – | – | – | – | – | – |
| BOW ISLAND | 3030768 | 25 | 1993 | 2017 | 100 | 33.7 | 34.3 | 31.6 | – | – | – | – | – | – | – | – | – | – | – |
| BOW VALLEY | 3050778 | 25 | 1993 | 2017 | 100 | 32.1 | 32.2 | 29.1 | – | – | – | – | – | – | – | – | – | – | – |
| COP UPPER | 3031875 | 25 | 1993 | 2017 | 100 | 31.1 | 31.3 | 28.5 | – | – | – | – | – | – | – | – | – | – | – |
| CROWSNEST | 3051R4R | 25 | 1993 | 2017 | 100 | 31 | 32 | 29.1 | – | – | – | – | – | – | – | – | – | – | – |
| ESTHER 1 | 301B460 | 25 | 1993 | 2017 | 100 | 32.9 | 34.8 | 32.3 | – | – | – | – | – | – | – | – | – | – | – |
| LACOMBE CDA 2 | 3023722 | 25 | 1993 | 2017 | 100 | 30.1 | 31.3 | 28.4 | – | – | – | – | – | – | – | – | – | – | – |
| SUNDRE A | 3026KNQ | 25 | 1993 | 2017 | 100 | 30.6 | 31.1 | 28.5 | – | – | – | – | – | – | – | – | – | – | – |
| THREE HILLS | 3026479 | 25 | 1993 | 2017 | 100 | 30.7 | 32.5 | 29.9 | – | – | – | – | – | – | – | – | – | – | – |
| VAUXHALL CDA CS | 3036682 | 25 | 1993 | 2017 | 100 | 33.6 | 34.8 | 32.8 | – | – | – | – | – | – | – | – | – | – | – |
This annoys me so I bring it up every once in a while.
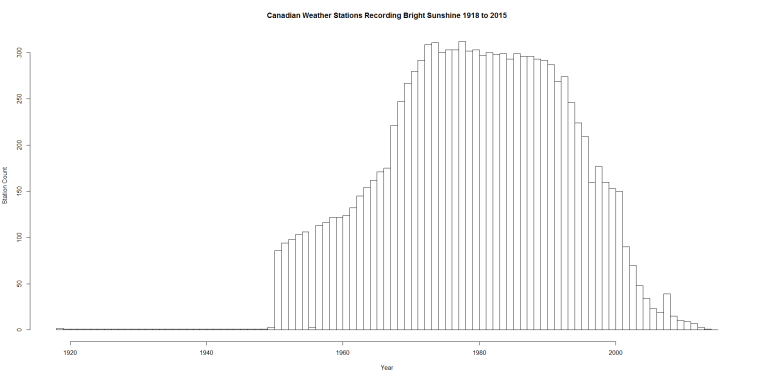
Could global warming be caused because of more sunshine? In Canada, we’ll never know. The stopped collecting that data in 2015.
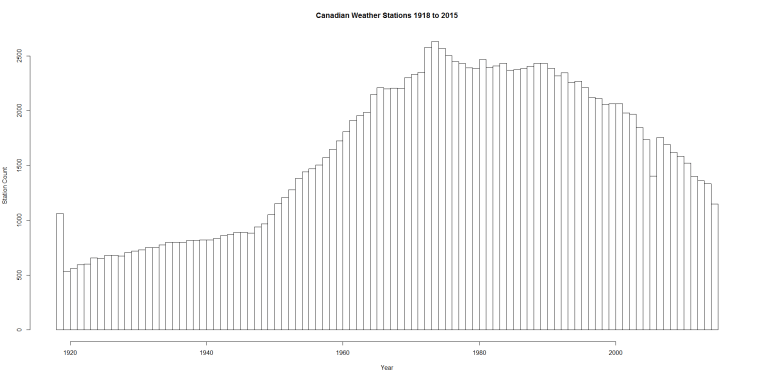
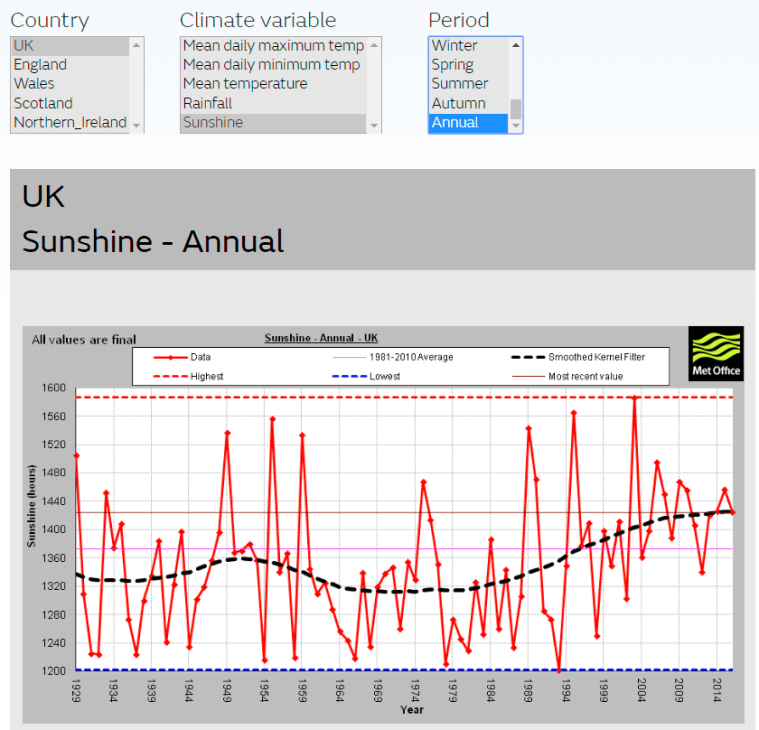
Here are three graphs. One shows the number of weather stations (half of what there used to be) and one shows the number collecting sunshine data. A 3rd graph shows what you can do with UK sunshine data.
https://www.metoffice.gov.uk/climate/uk/summaries/actualmonthly
Northern Hemisphere Snow Water Equivalent above normal all year … except for the day all the snow melted (and then came back).
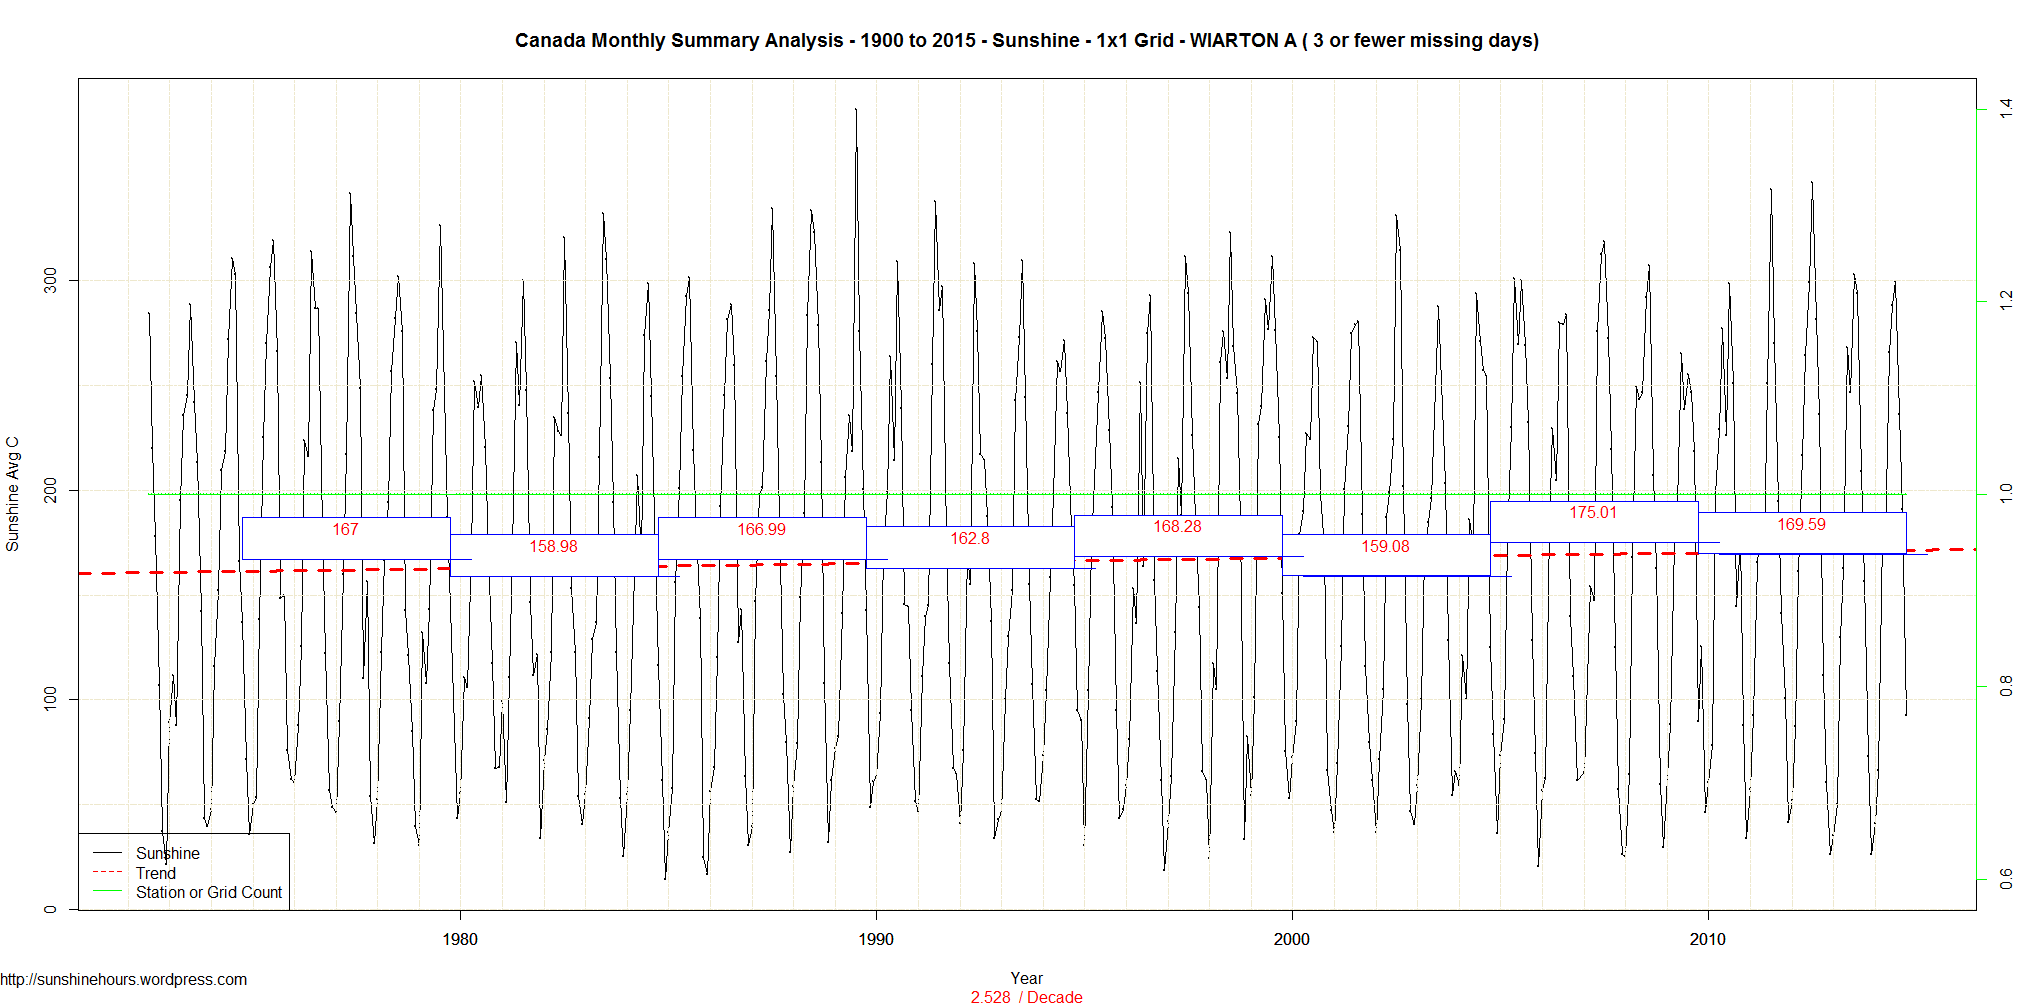
Once up a time (June of 1978 to be precise) if you downloaded Environment Canada’s monthly summaries, you would have found 313 stations with “Bright Sunshine” hours.
Even two years ago, these stations were reporting sunshine data:
TORONTO LESTER B. PEARSON INT’L A
CARTWRIGHT
GOOSE A
VICTORIA INT’L A
COMOX A
VANCOUVER INT’L A
WIARTON A
As of today, only WIARTON A reports sunshine data and for May 2015 25 out of 31 days had no valid measurements.
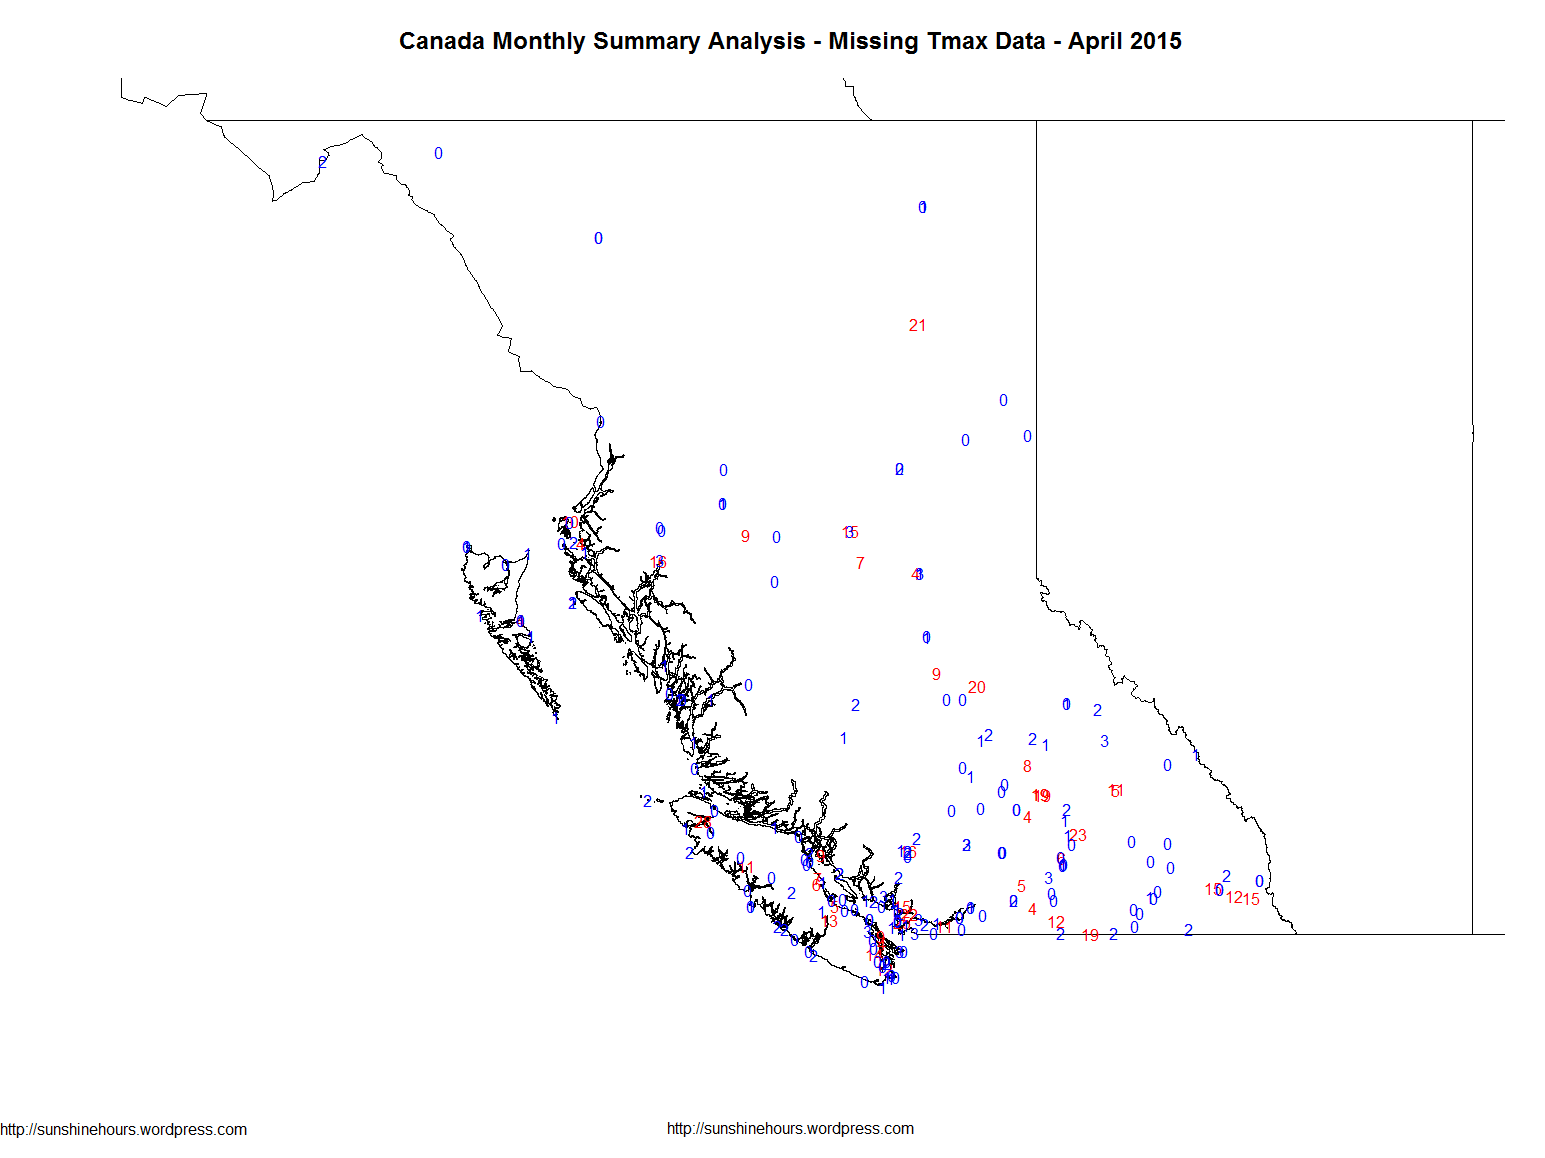
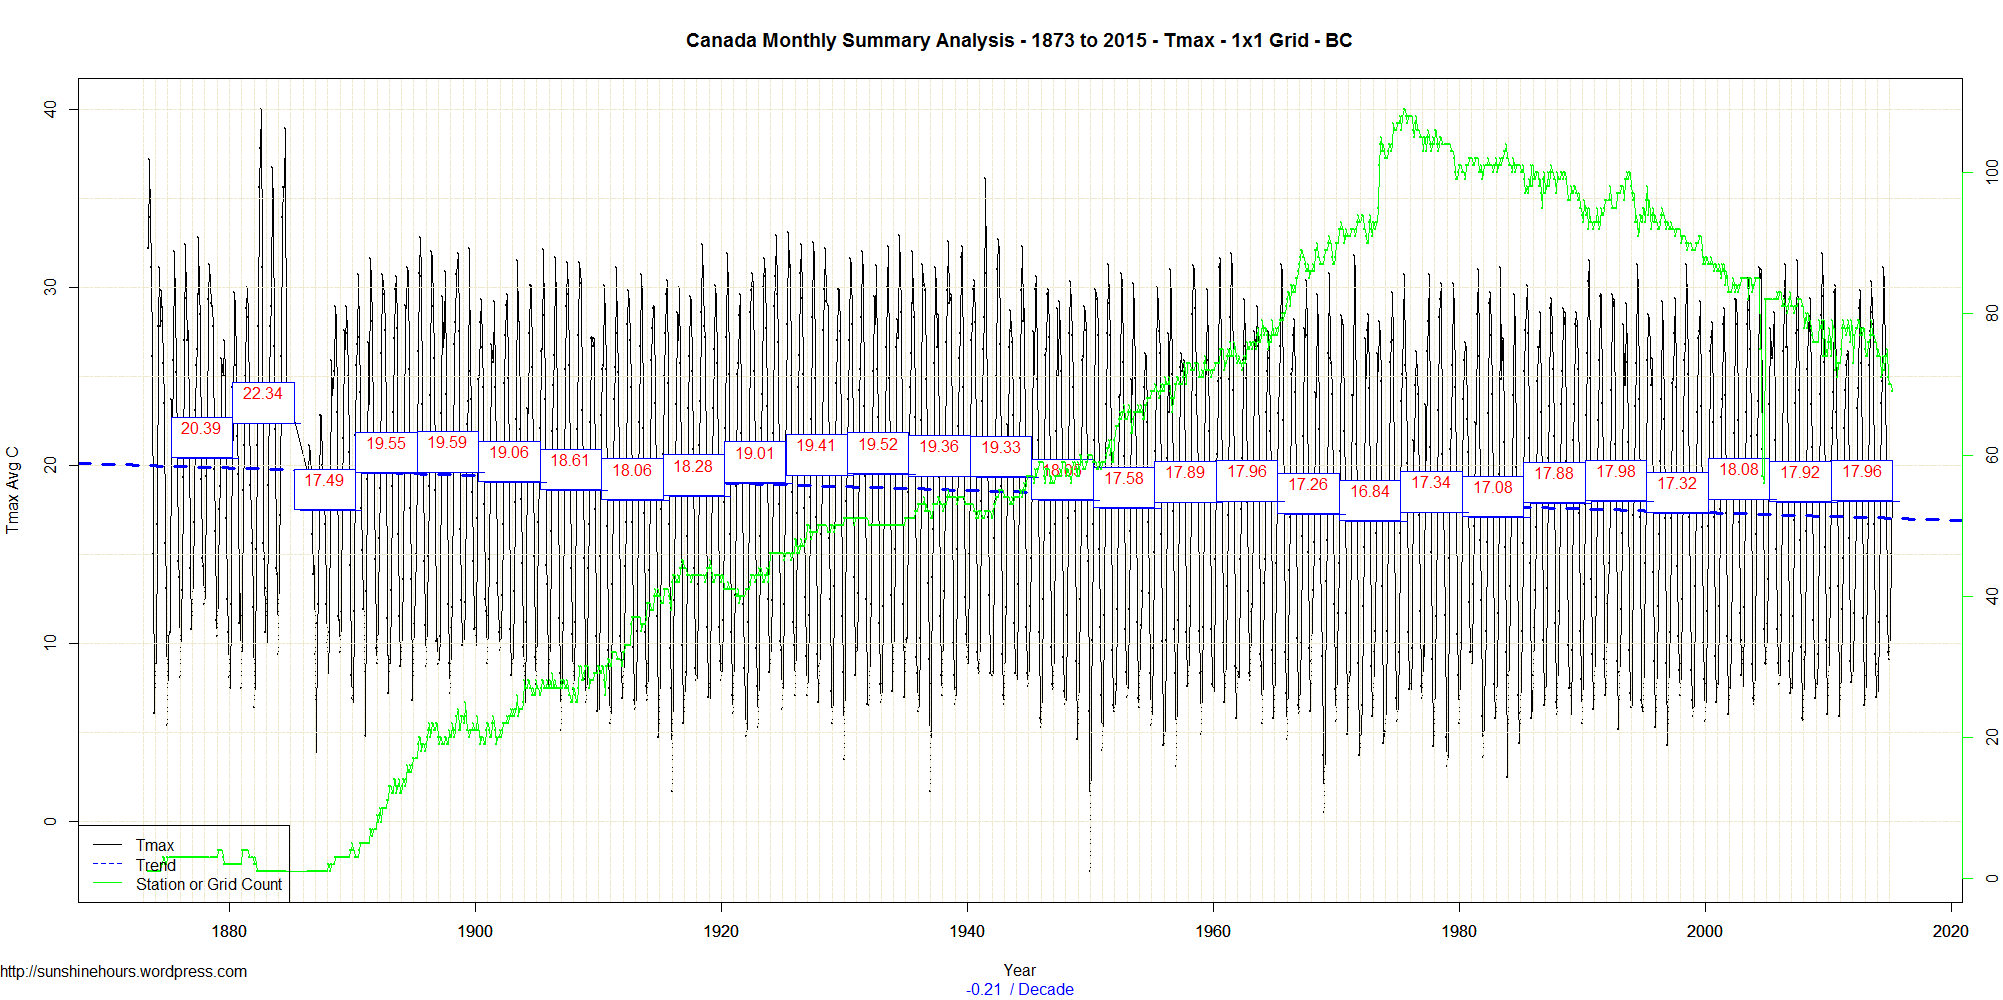
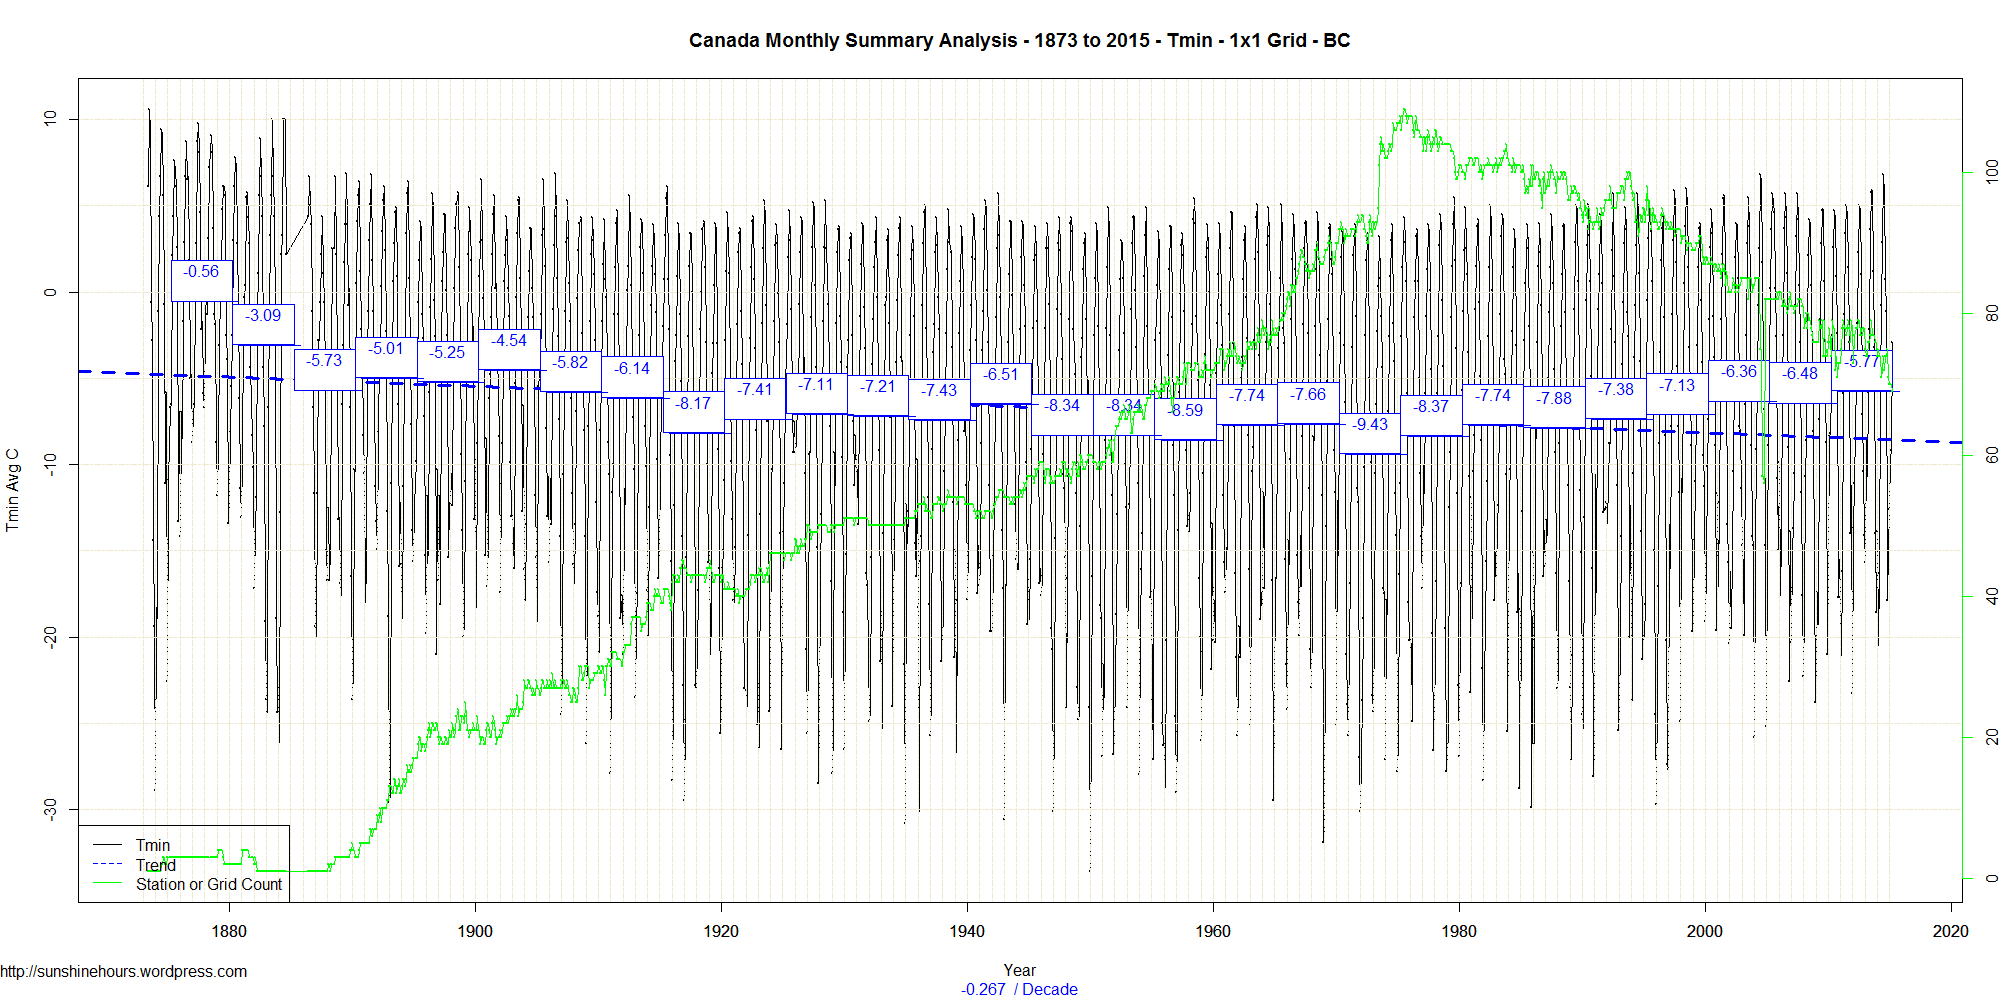
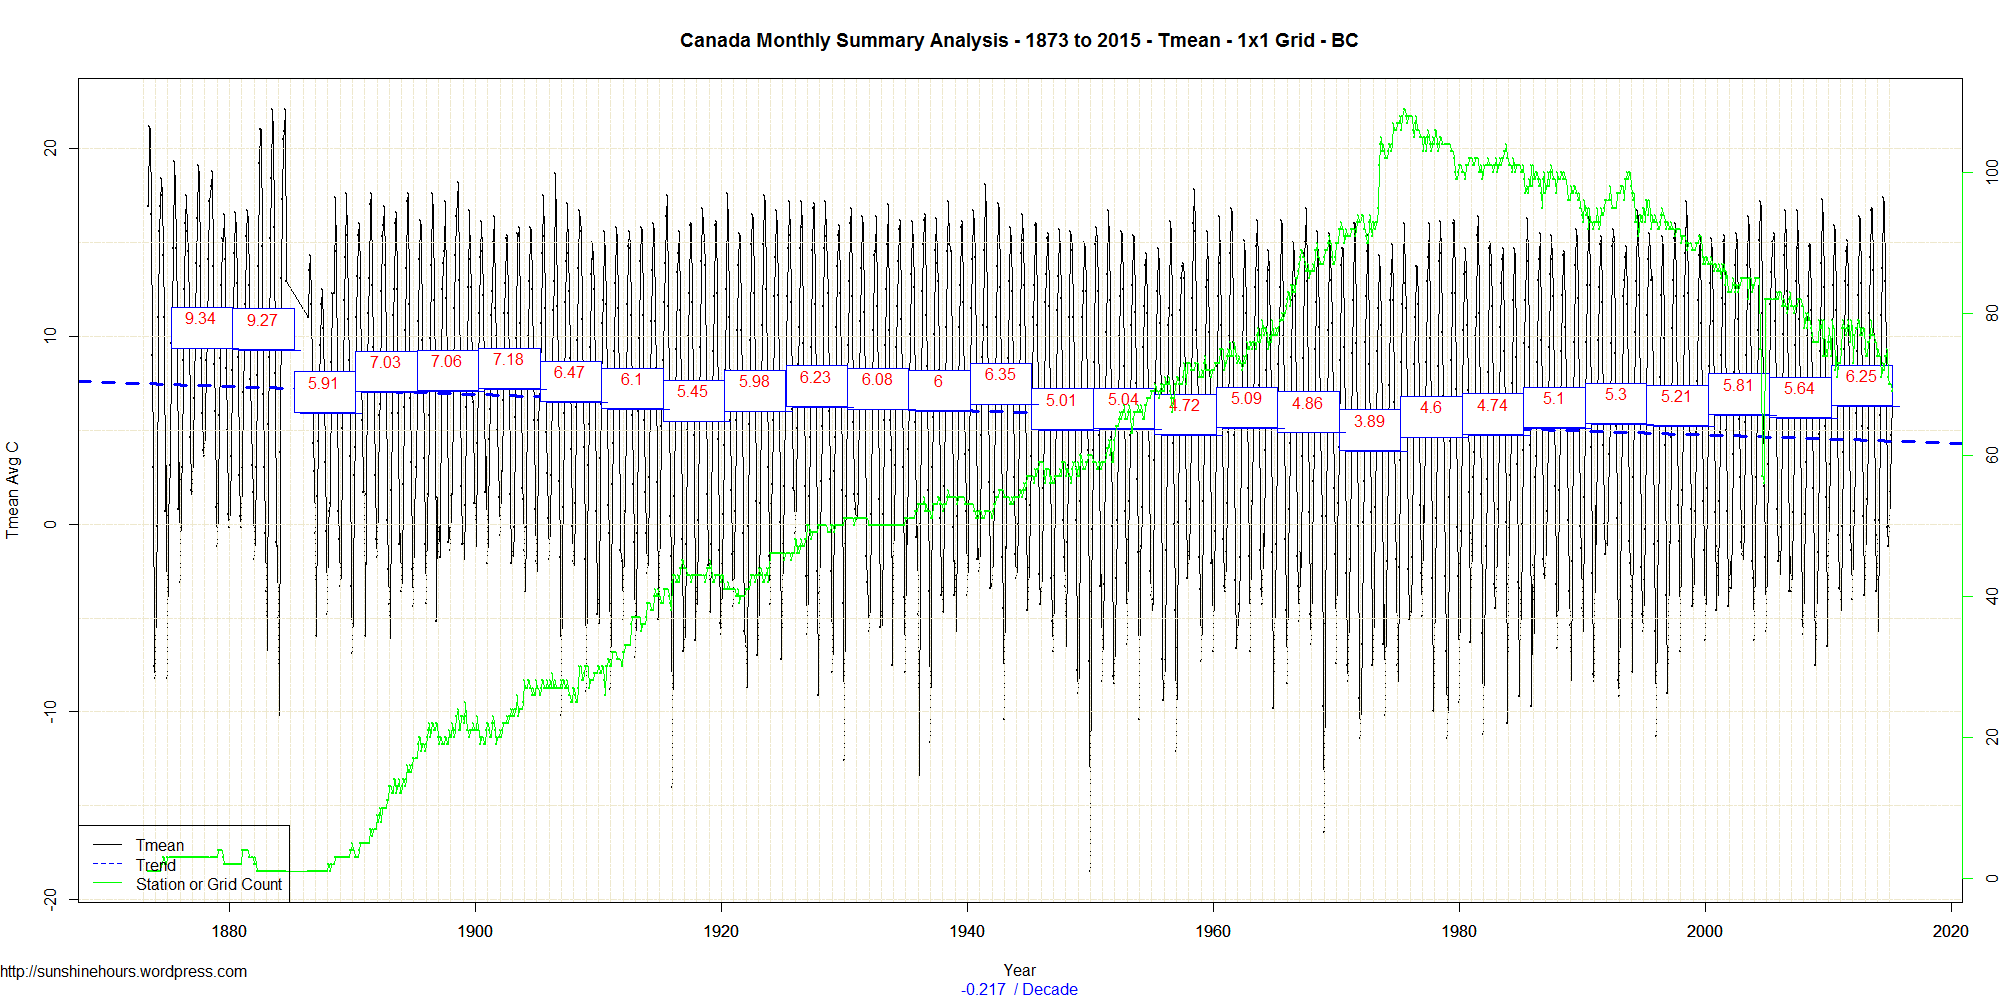
This a followup to this post: British Columbia Canada Tmax , Tmin and Tmean from 1873 (On 1×1 Grid)
The following map shows which stations were missing (or not missing) daily Tmax data in the monthly summary for April 2015.
Blue had 0-3 days missing. Red more than 3. What saddens me is that 19 out of the 43 “red” stations were also “Normals” – which means they were reference stations.
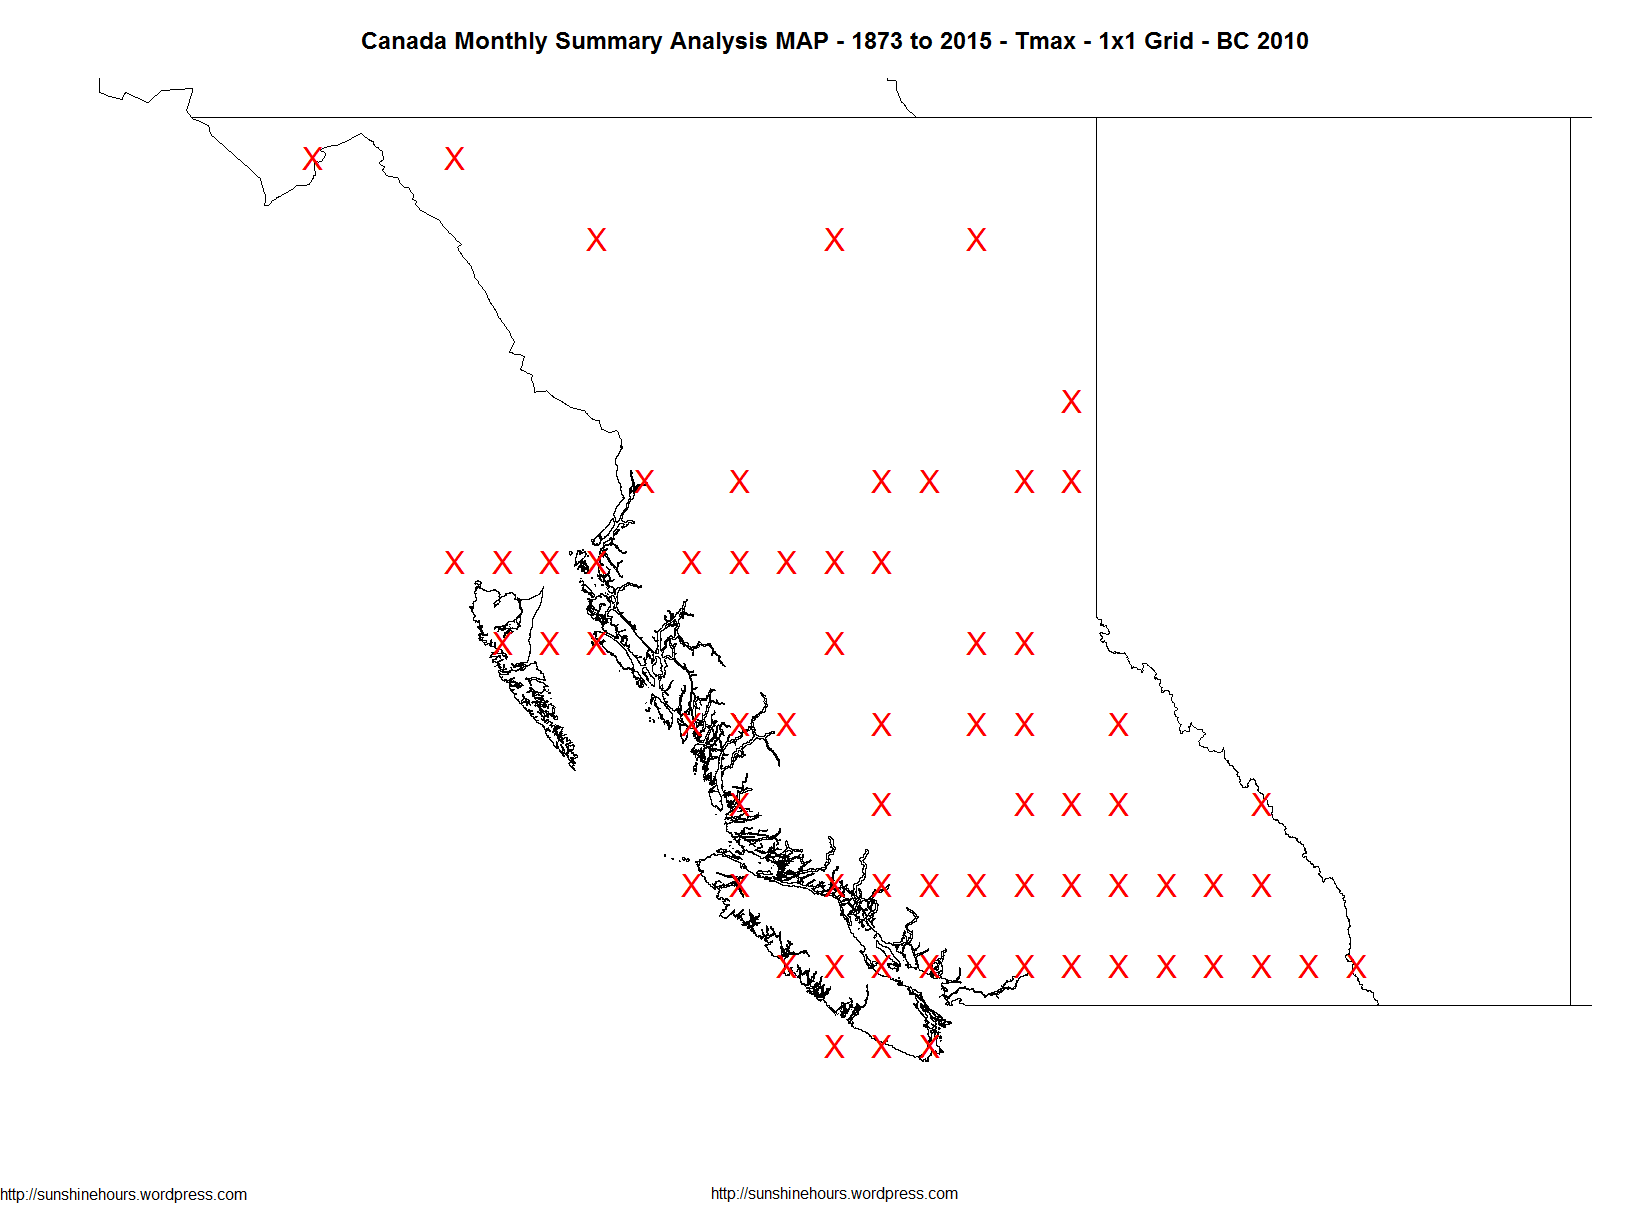
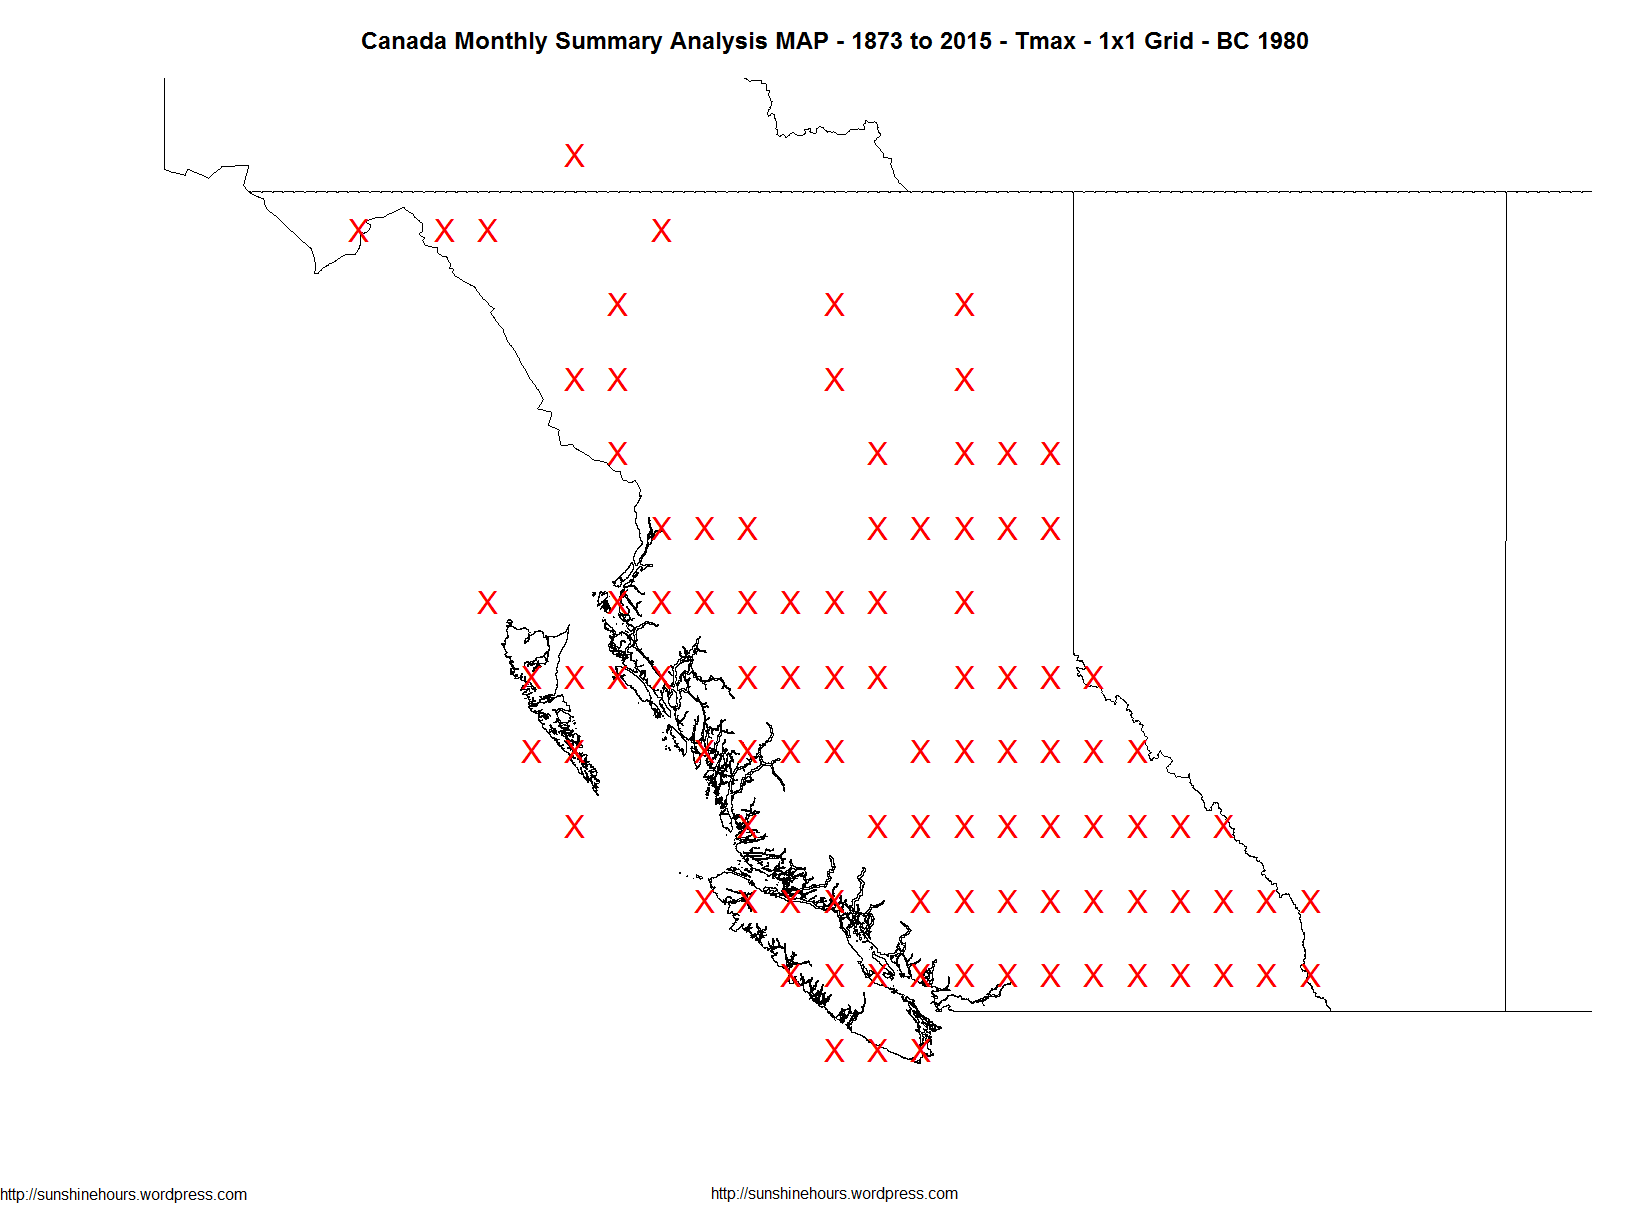
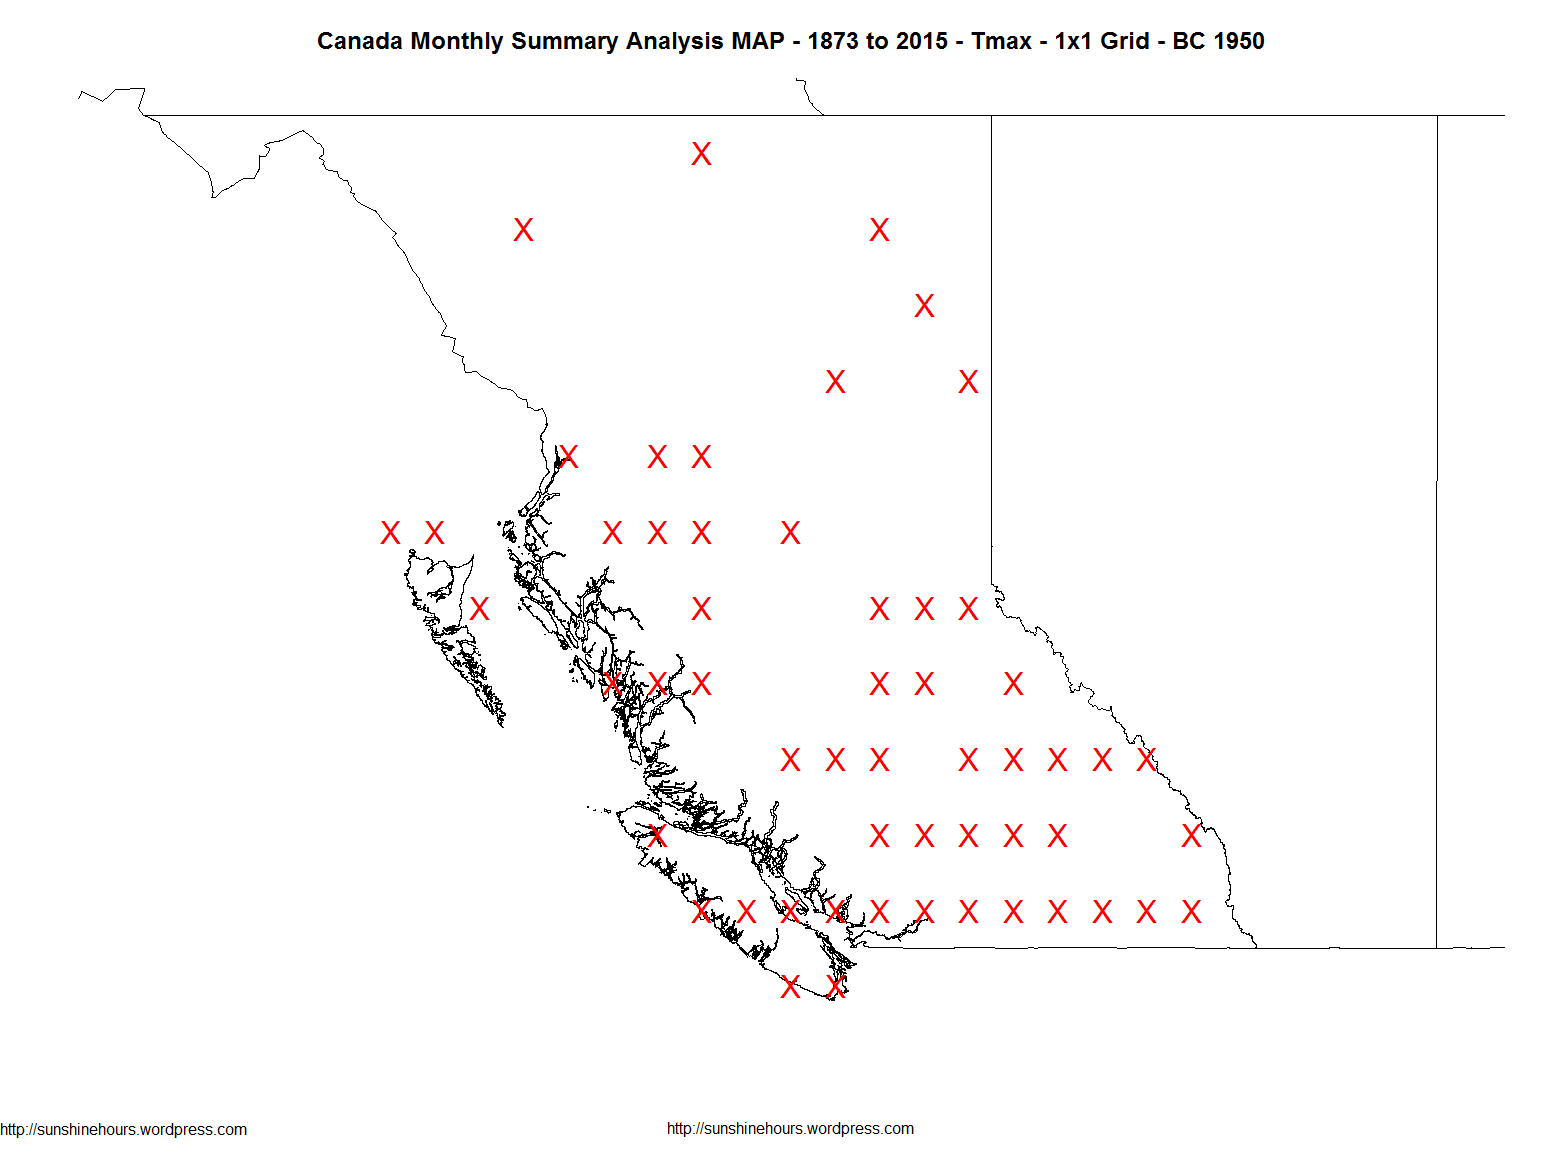
This a followup to this post: British Columbia Canada Tmax , Tmin and Tmean from 1873 (On 1×1 Grid)
The following maps show which grid cells (apprximately) had data in a few key years.
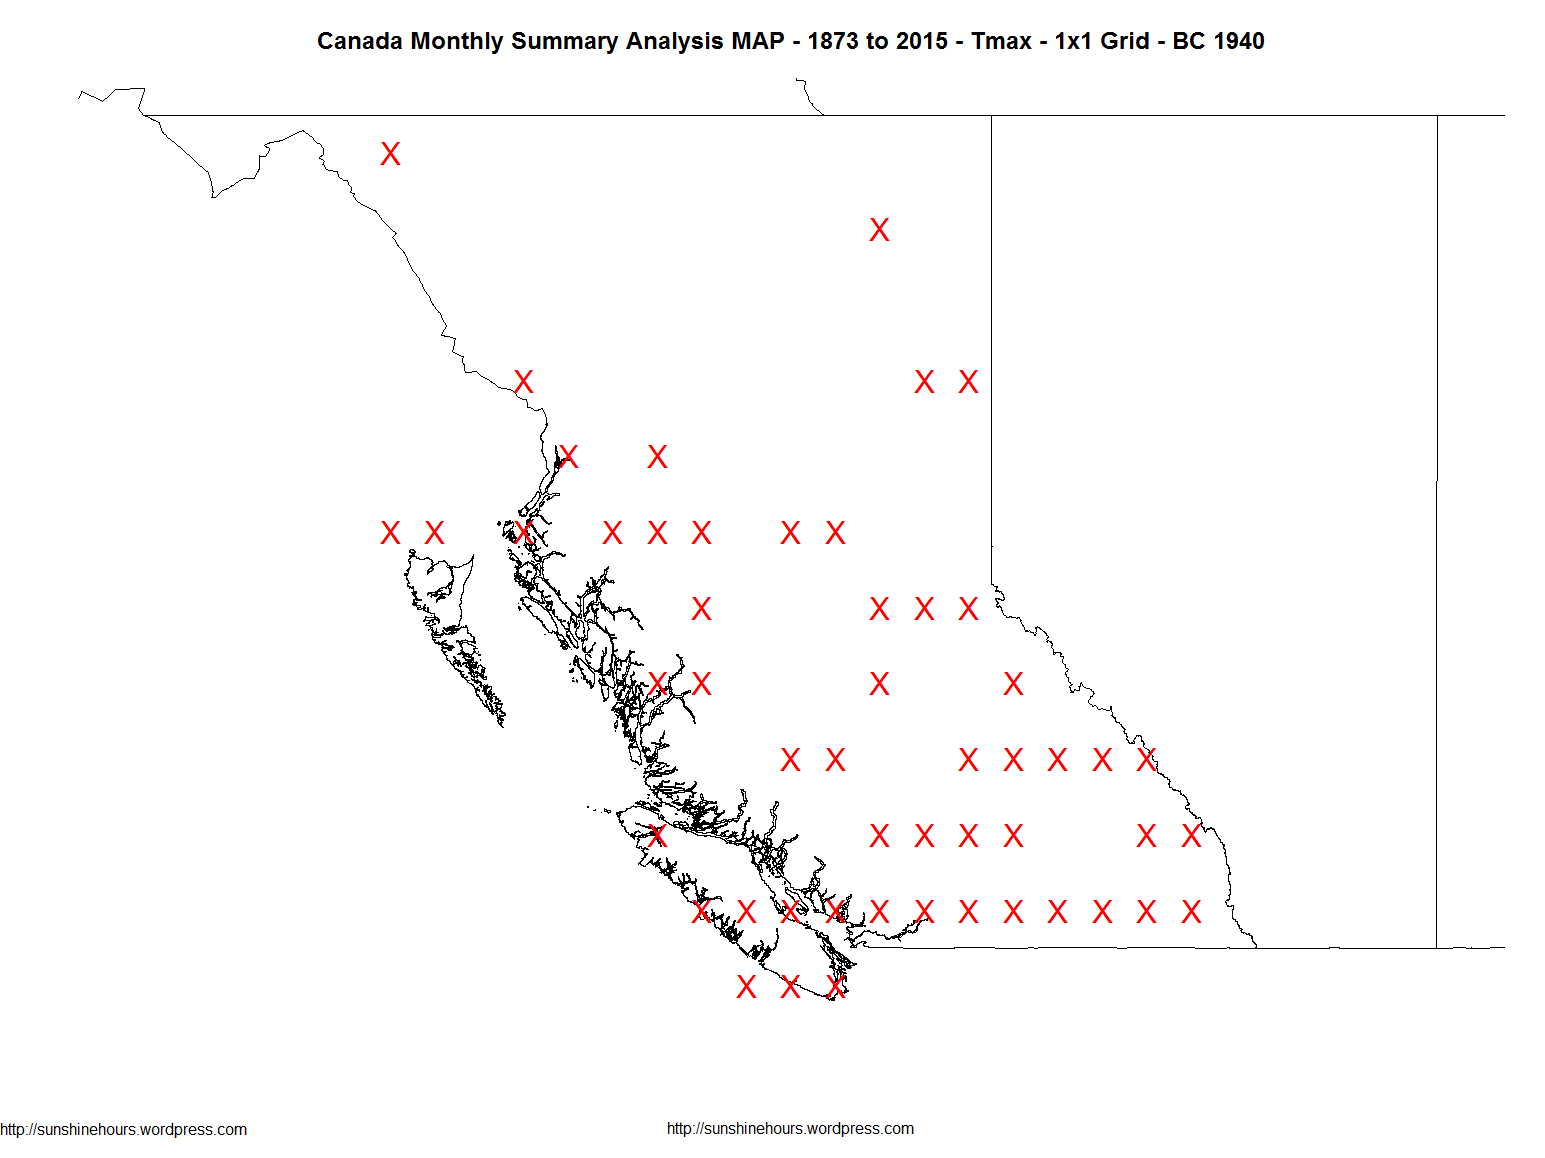
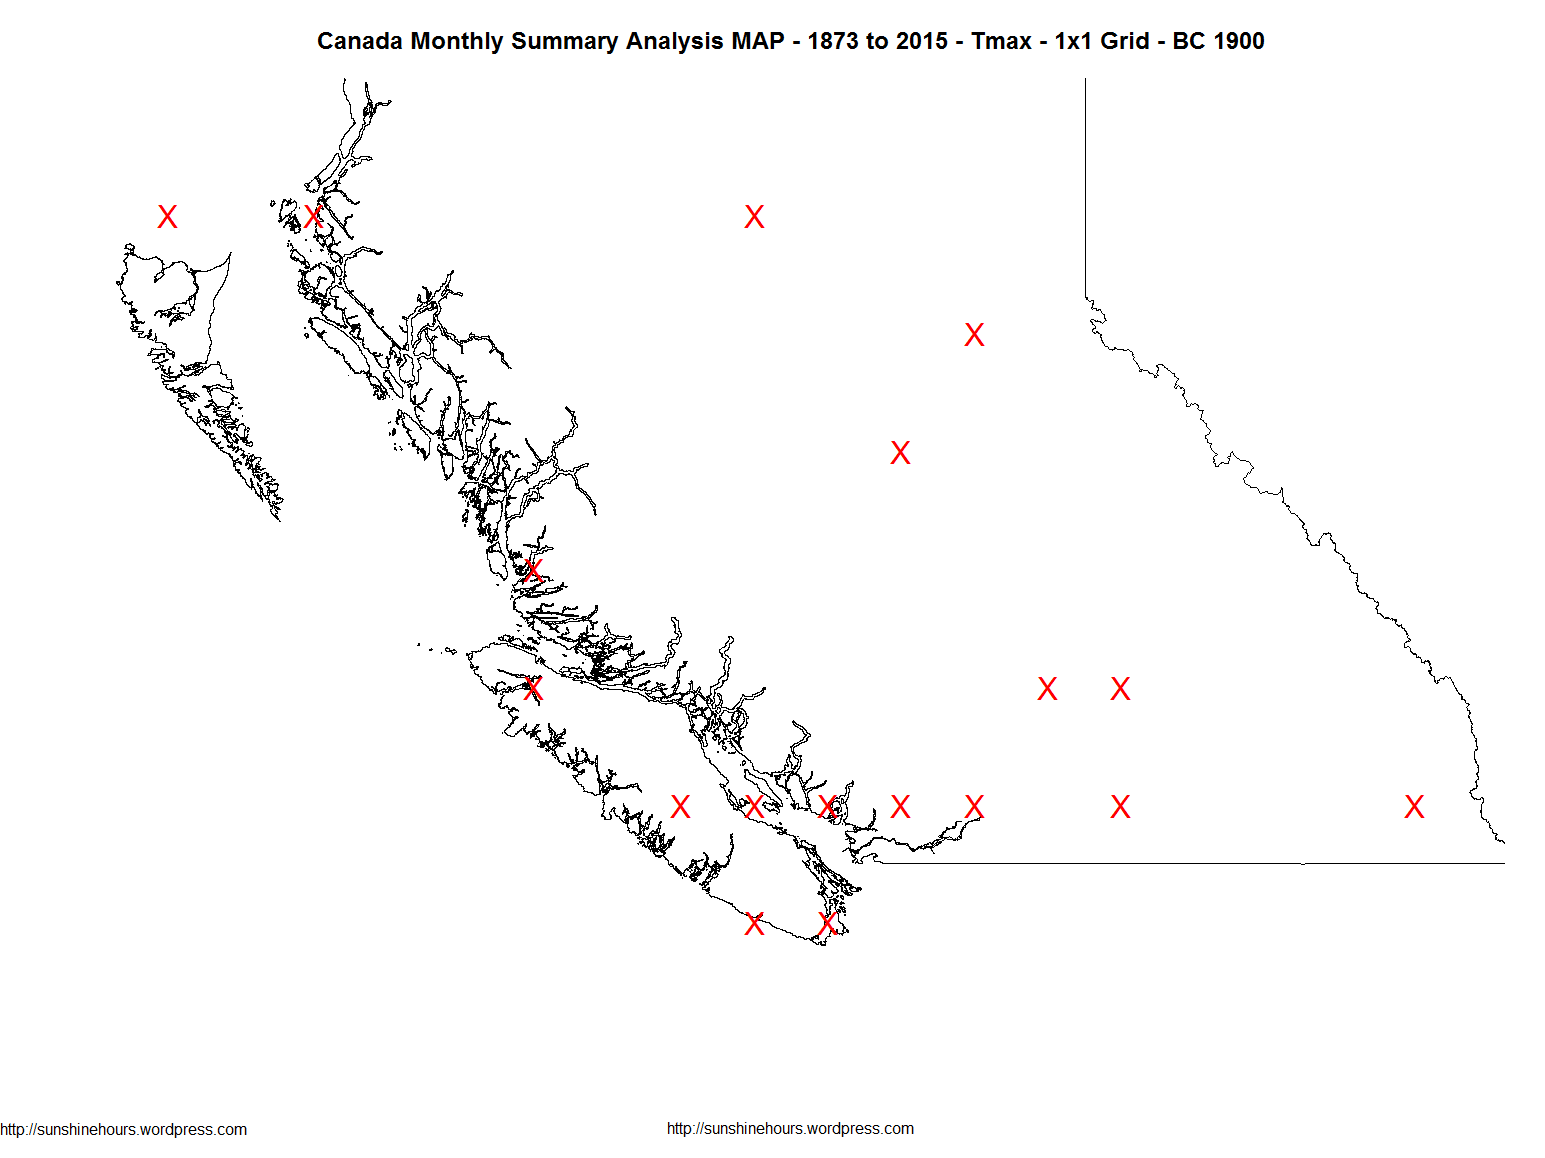
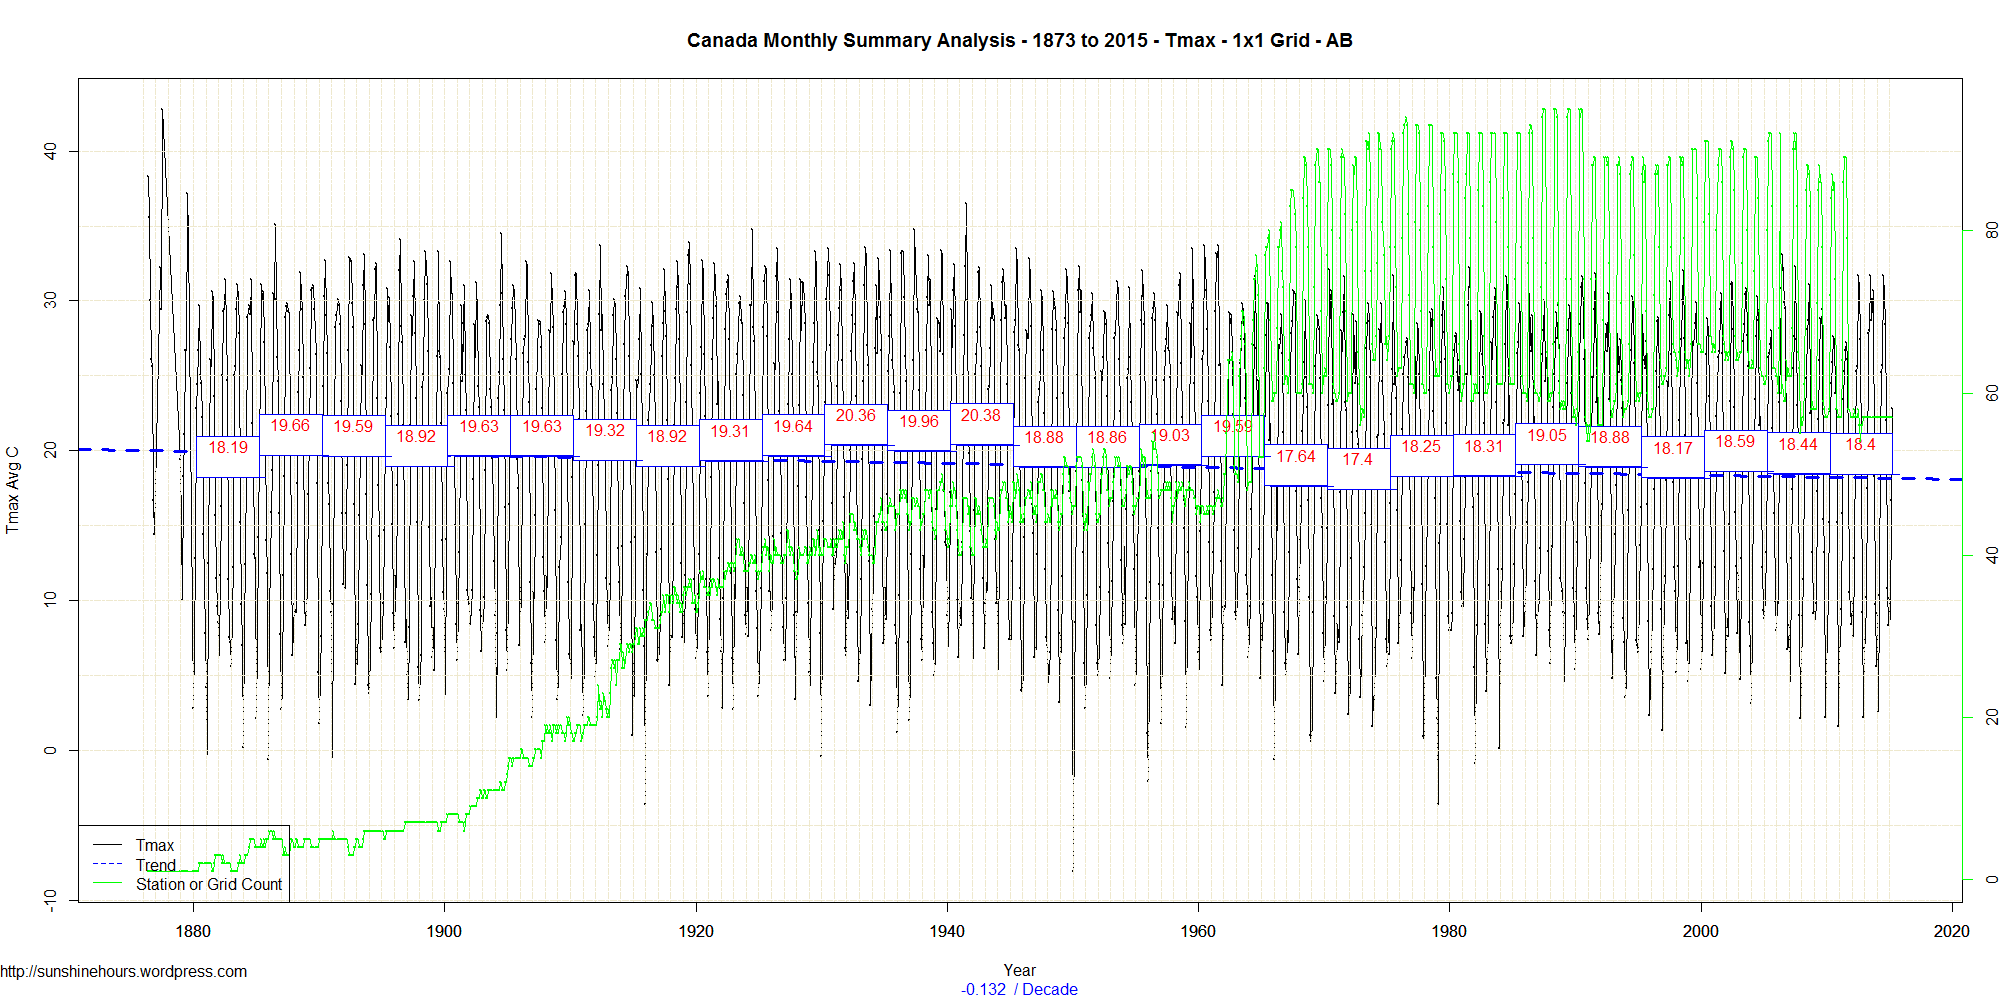
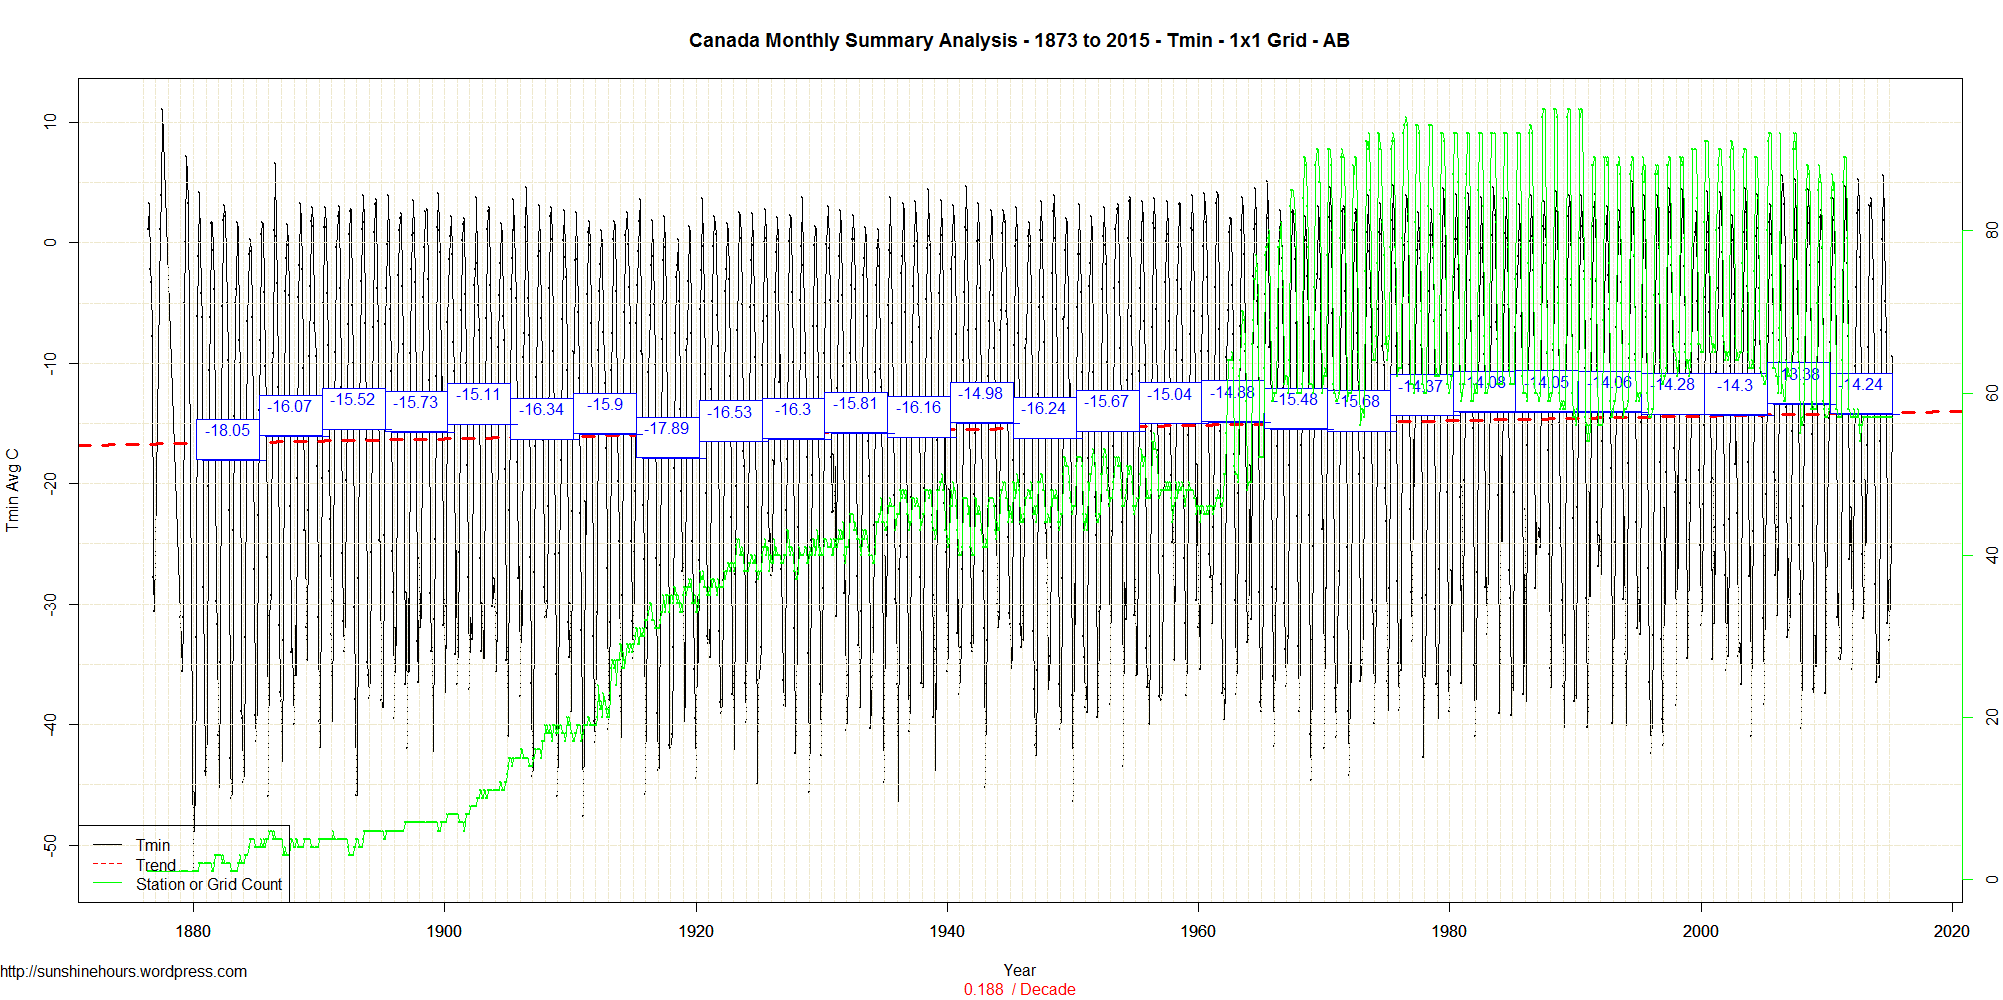
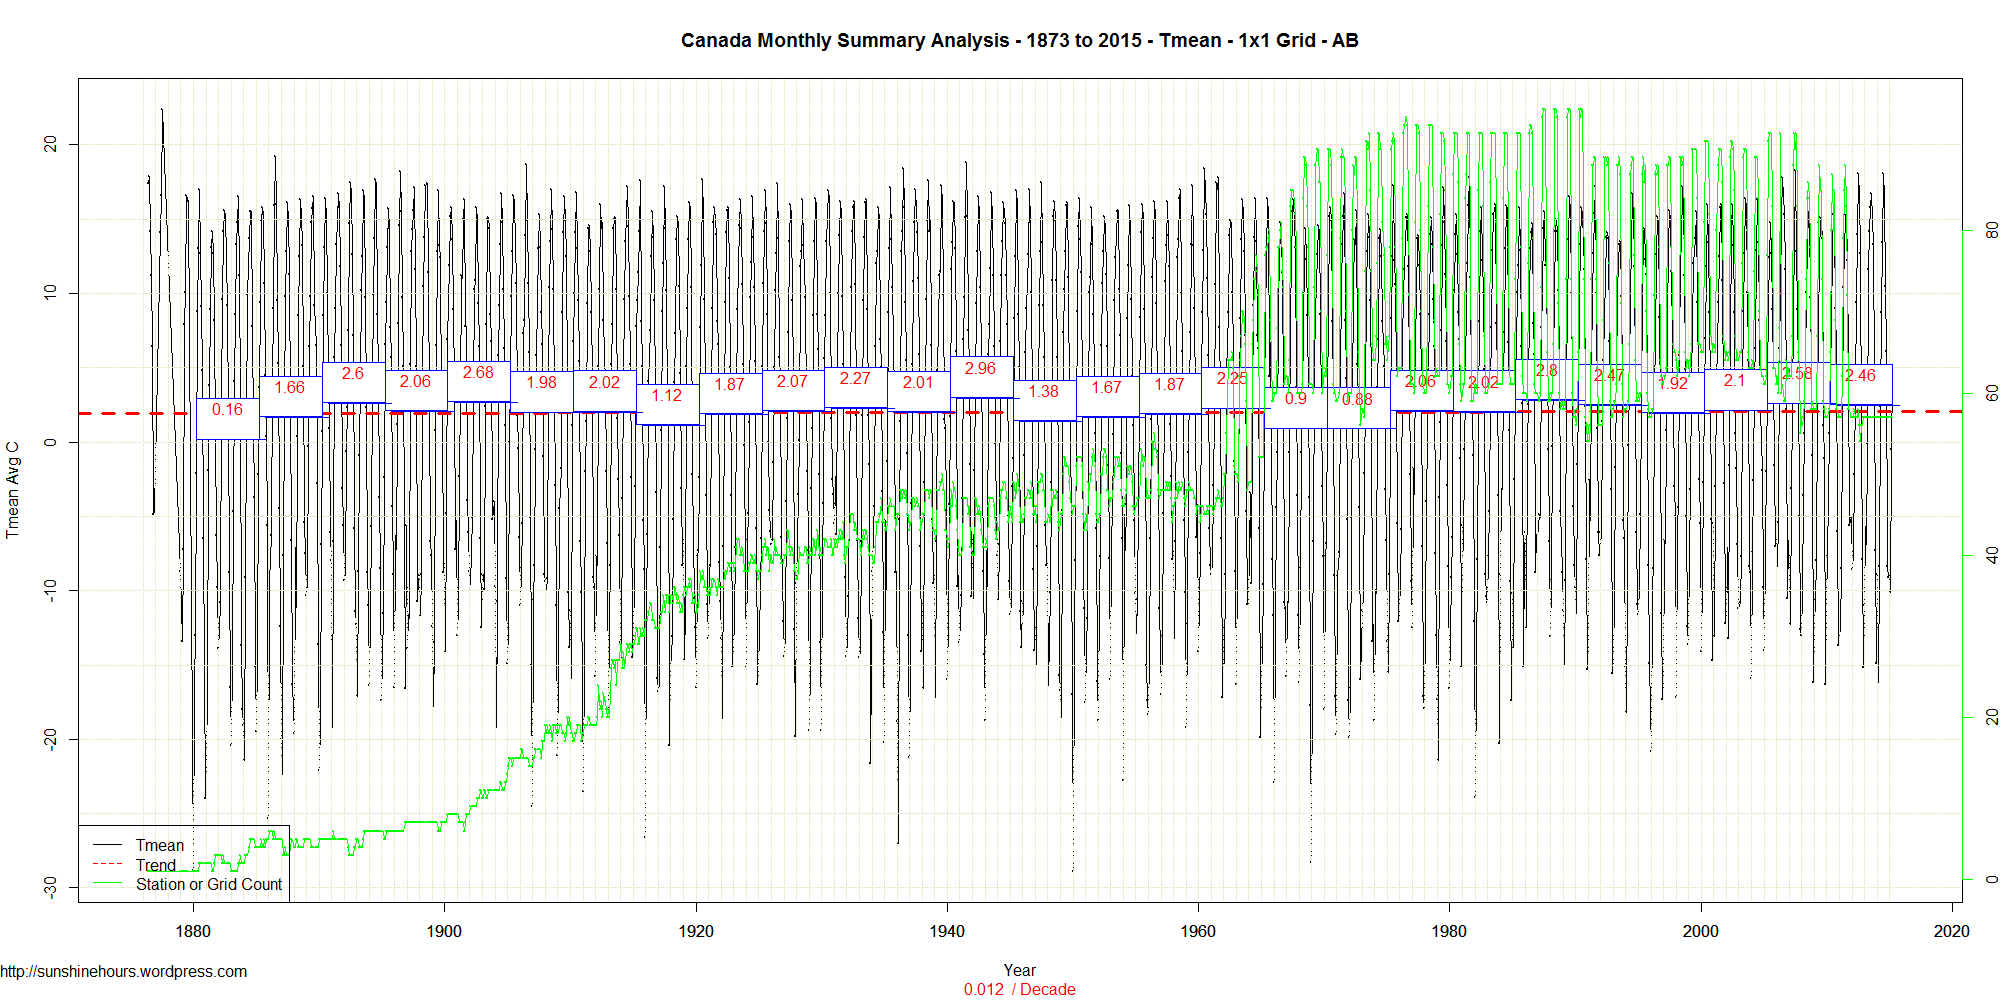
This is the Alberta followup the BC post. You can read the explnations.
In the terms of Tmax the coldest period in Alberta (using 5 year means) was 1972-1976.
The warmest period was 1940 – 1944. In fact it was 2C warmer in 1940-1944 than 2011 – 2015. (The 1930s were just slightly cooler than the early 40s)
You may ask why the green line of grid counts goes up and down so much. It appears there are many more stations reporting in May/Jun/Jul/Aug/Sep than in the winter.
Tmax
Tmin
Tmean
Click for larger:
Step 1: Use Data from Environment Canada’s monthly summaries.
Step 2: Summarize the data by 1×1 grid square so no region dominates.
Step 3: Graph Tmax, Tmin and Tmean.
The black line is the monthly data. The blue boxes contain the 5 year mean (and I set the 5 year period by just going back from the most recent data in 5 year increments)
The green line is the number of 1×1 grid squares. The blue dashed line is the trend from 1873 (which is the earliest data).
(I won’t count the pre-1900 data as too important since there were so few stations)
Tmax was 1.5C warmer in the the 1920s/30s/40s than now.
Tmin now is the hottest its been since 1900.
Tmean in the early 40s was slightly warmer than now.
Tmean/Tmin has been warming since 1970 thanks to Tmin … not Tmax.
Click for larger:
Tmax
Tmin
Tmean
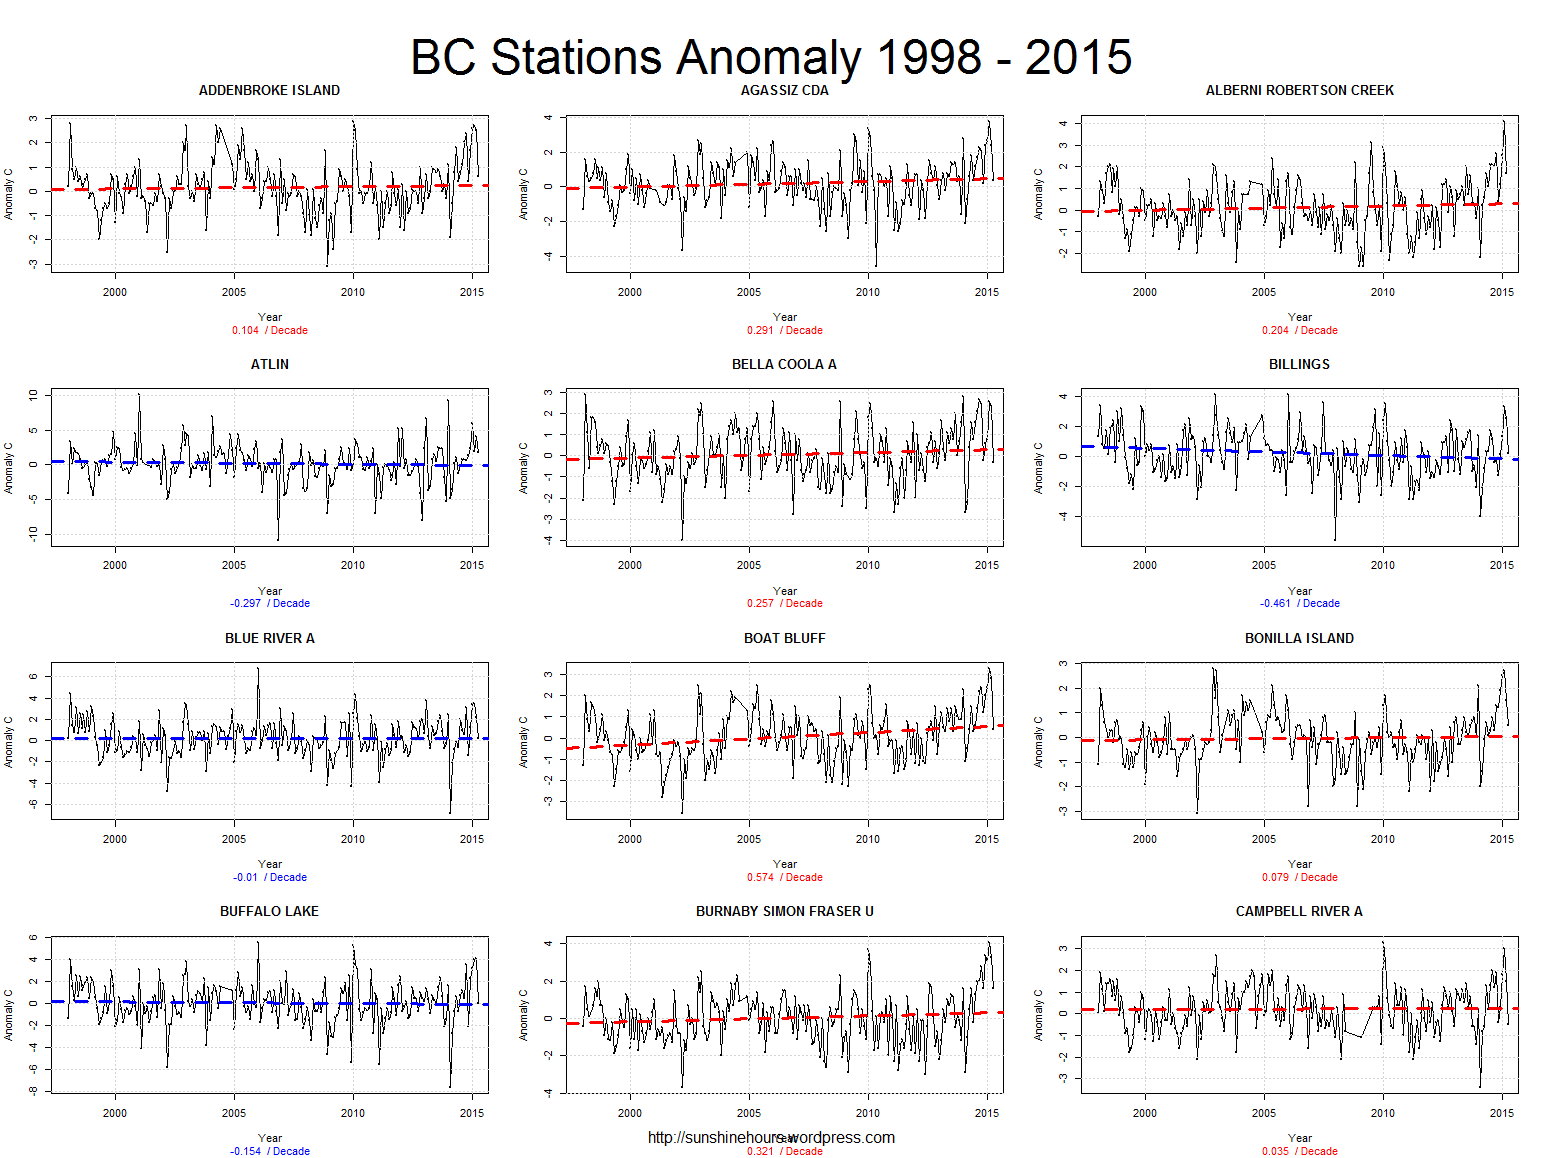
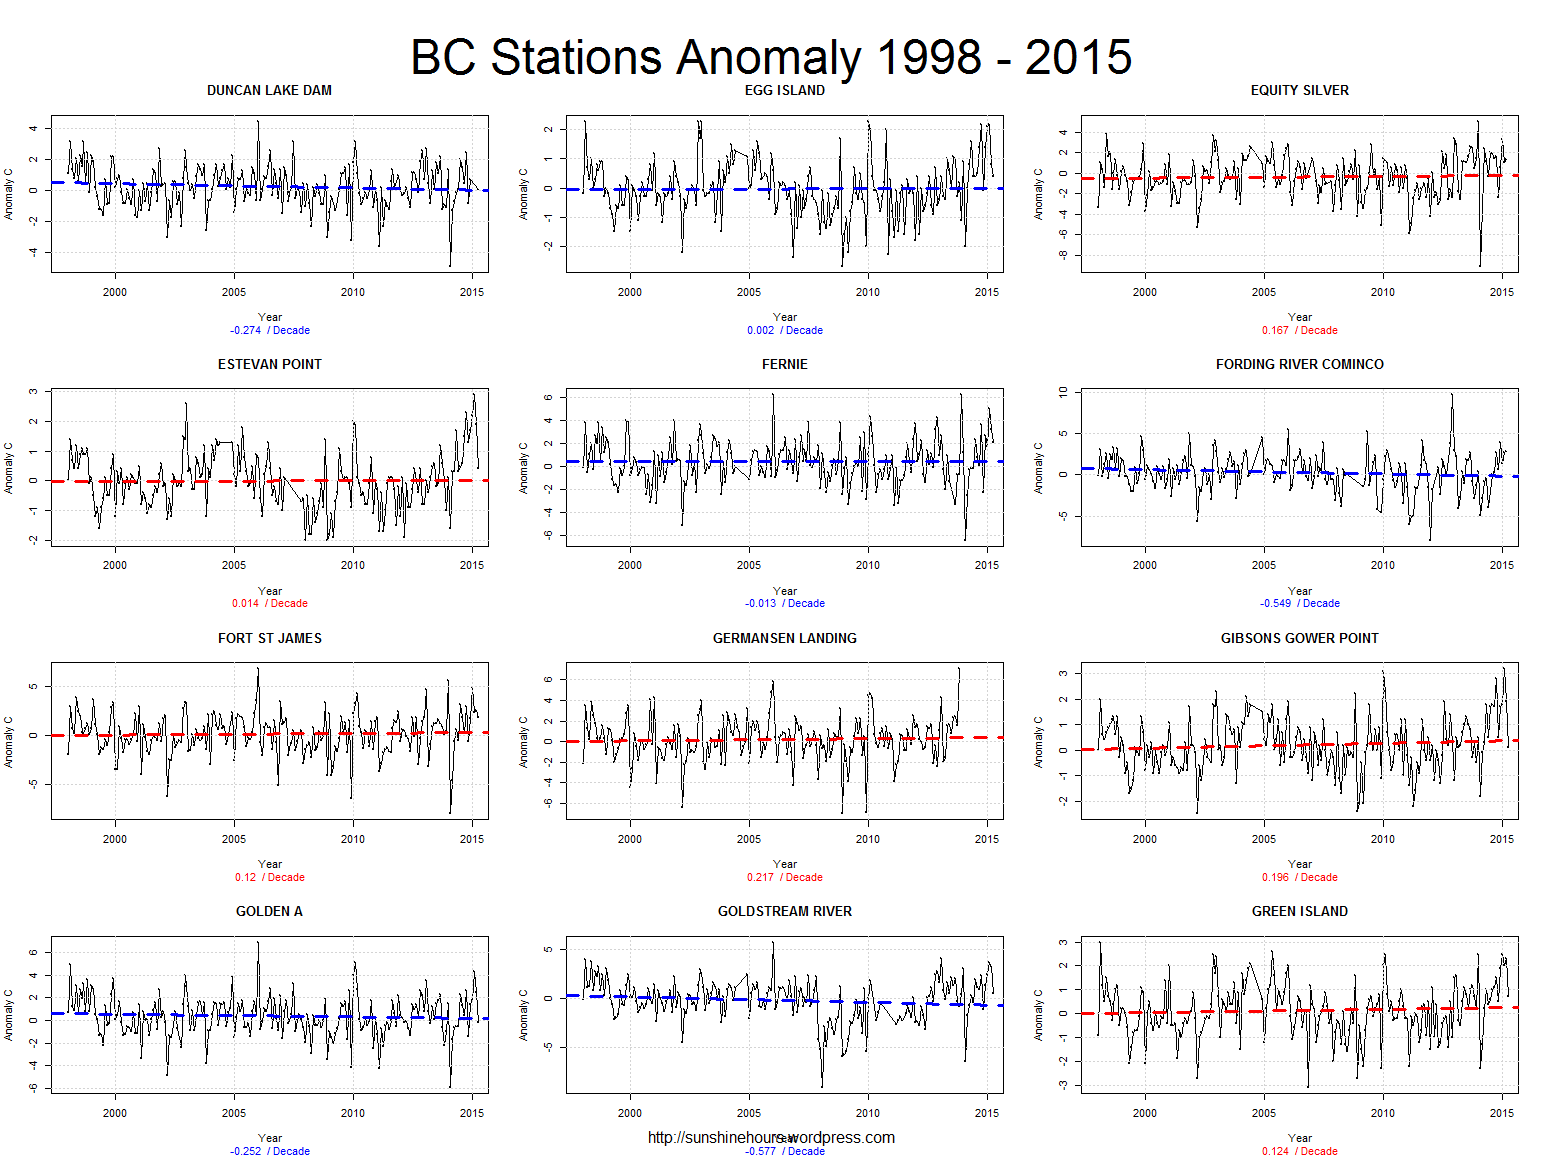
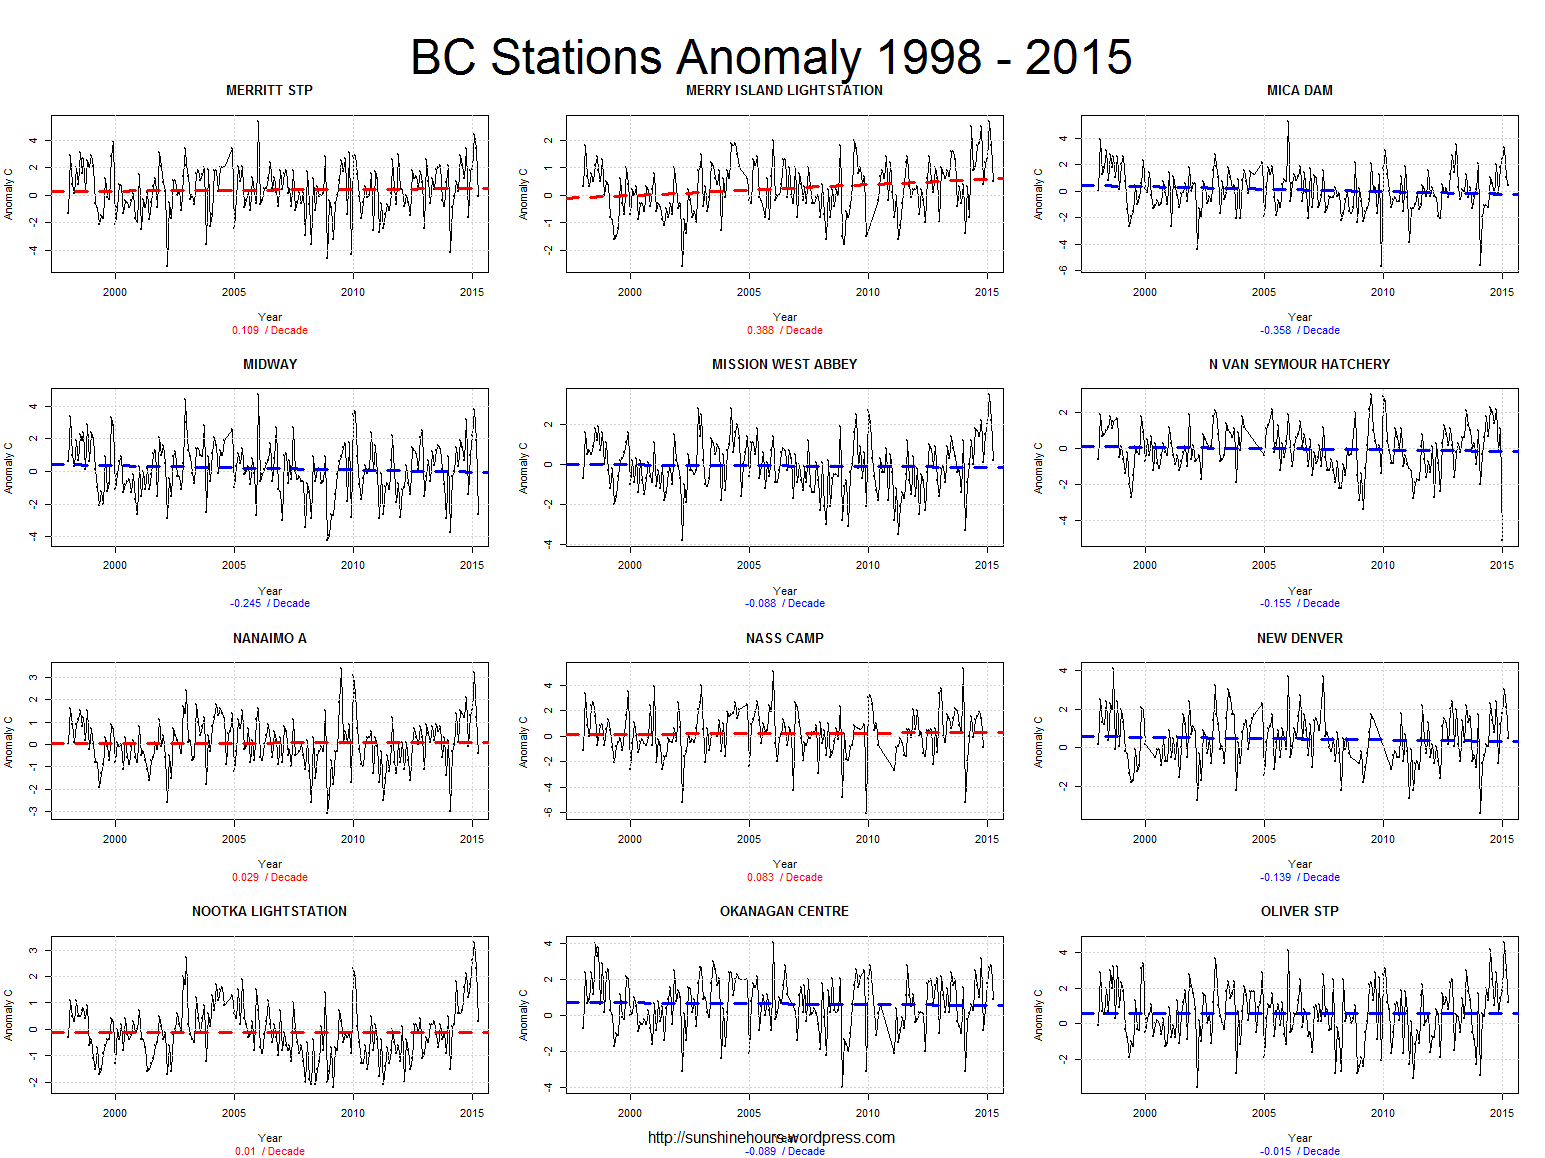
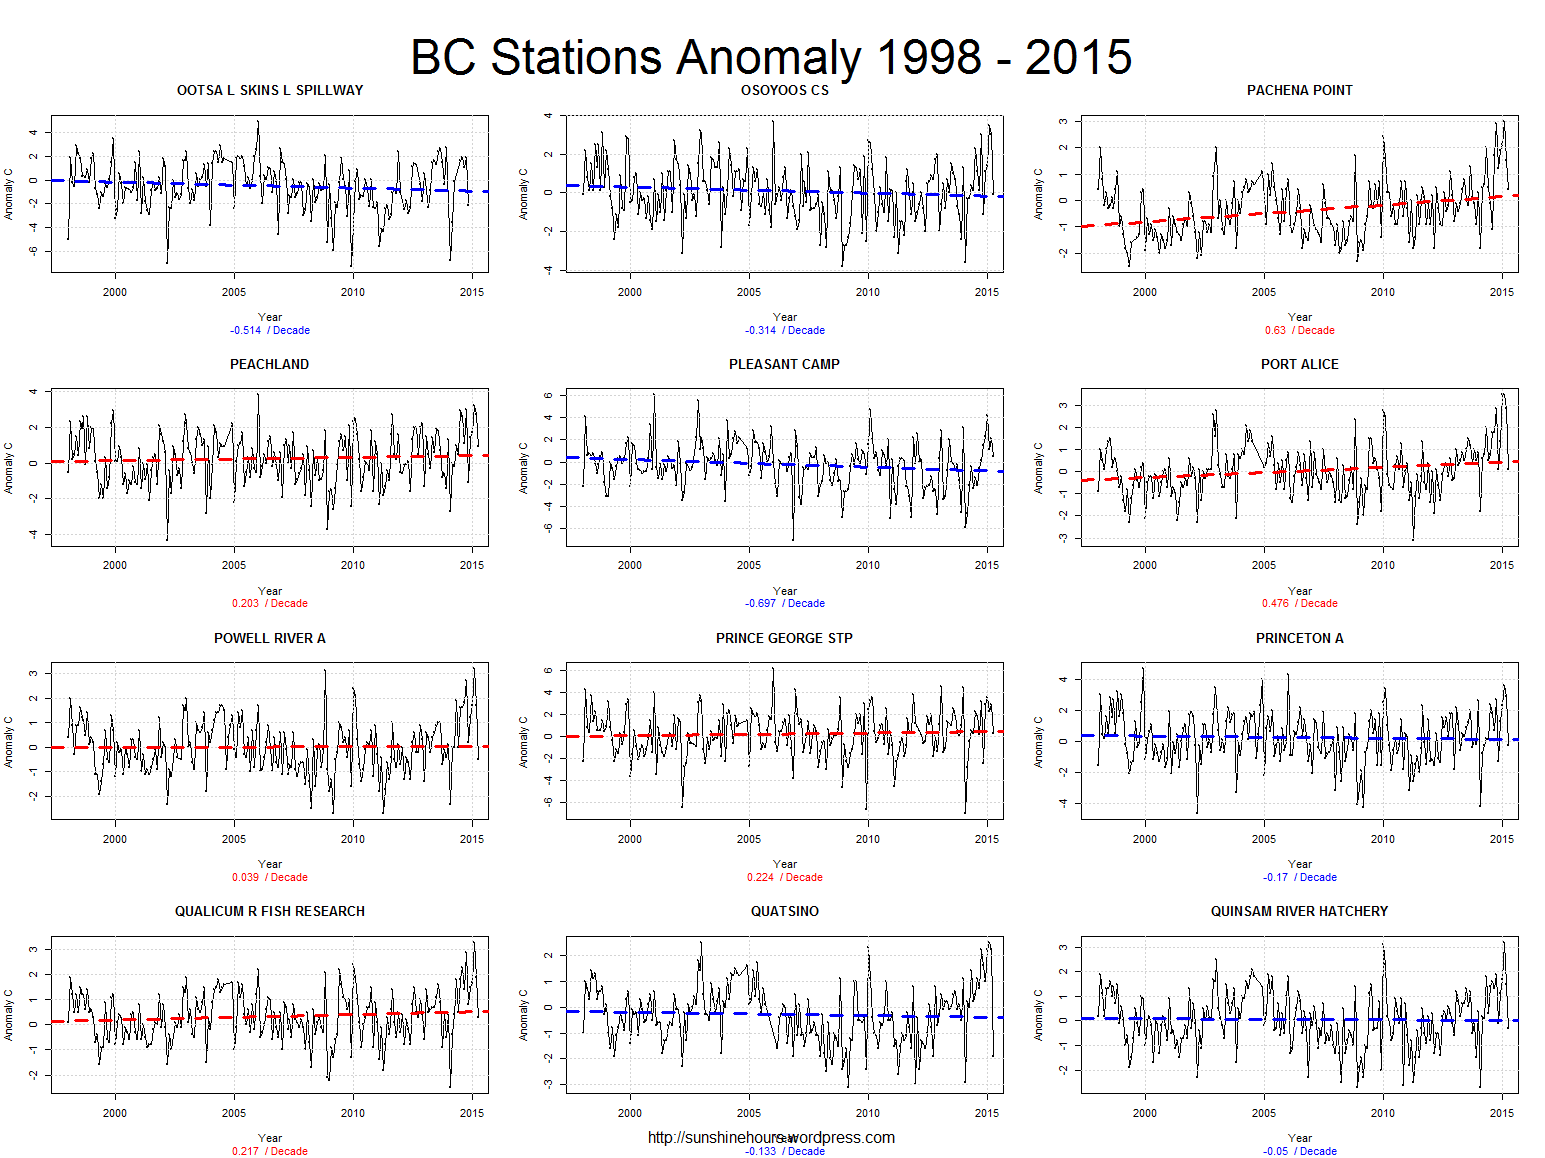
Using Environment Canada’s monthly summaries.
And selecting stations with ‘Normals’ (anomalies from 1981 – 2010) and 90% of the datapoints.