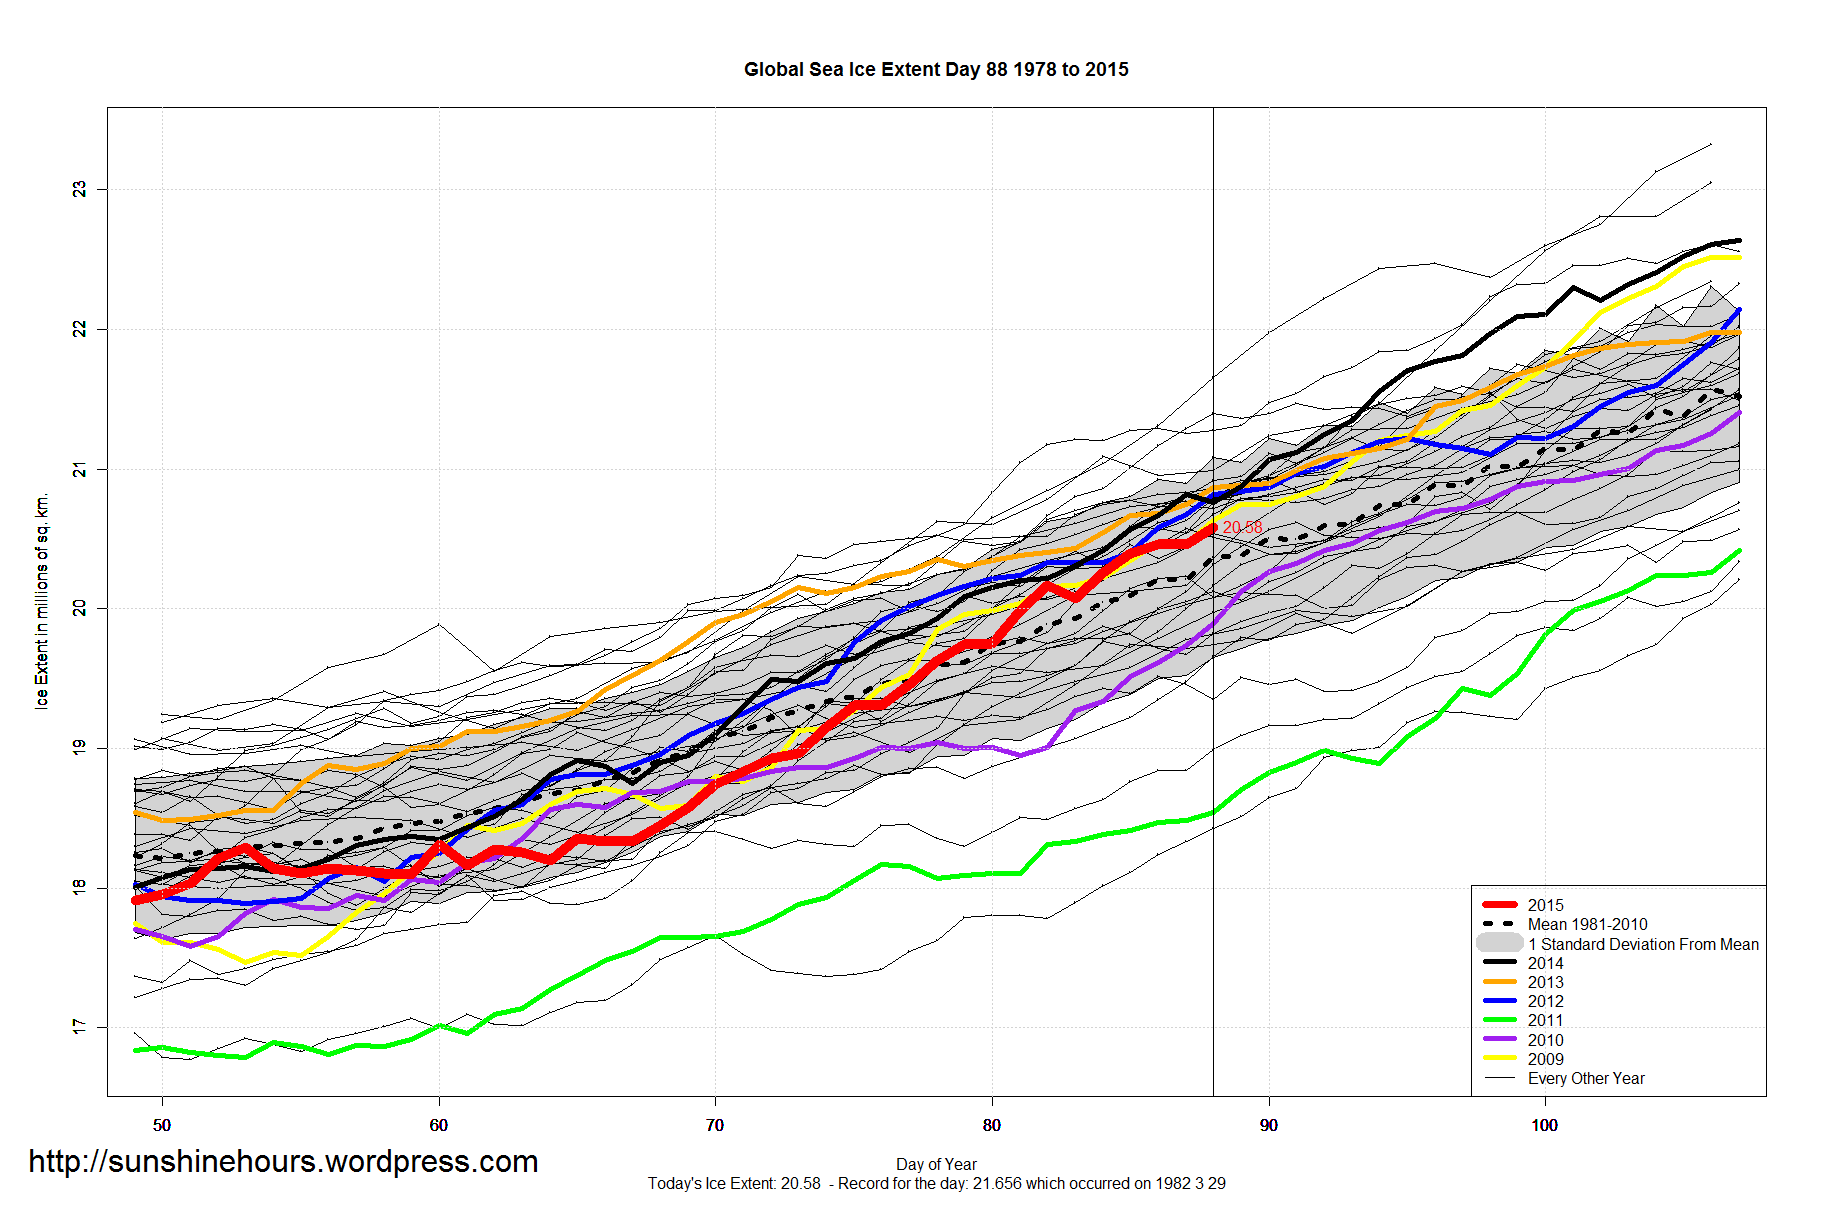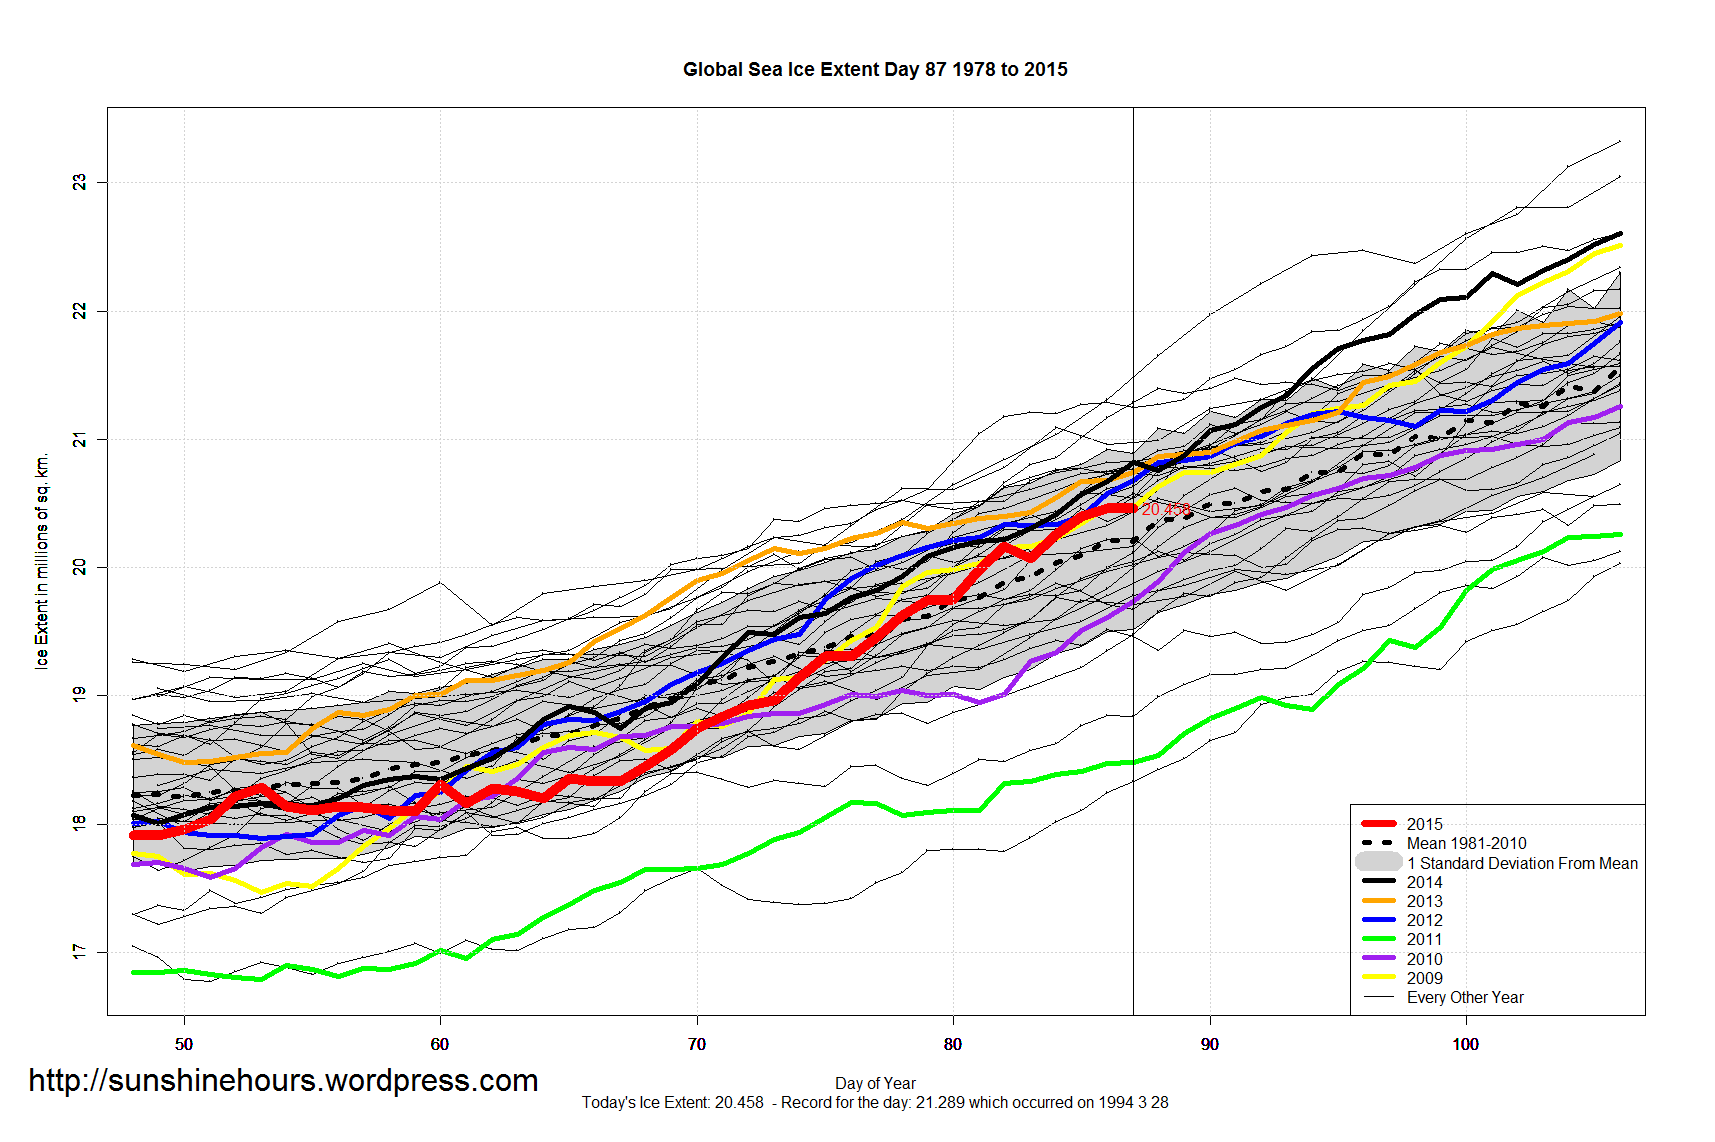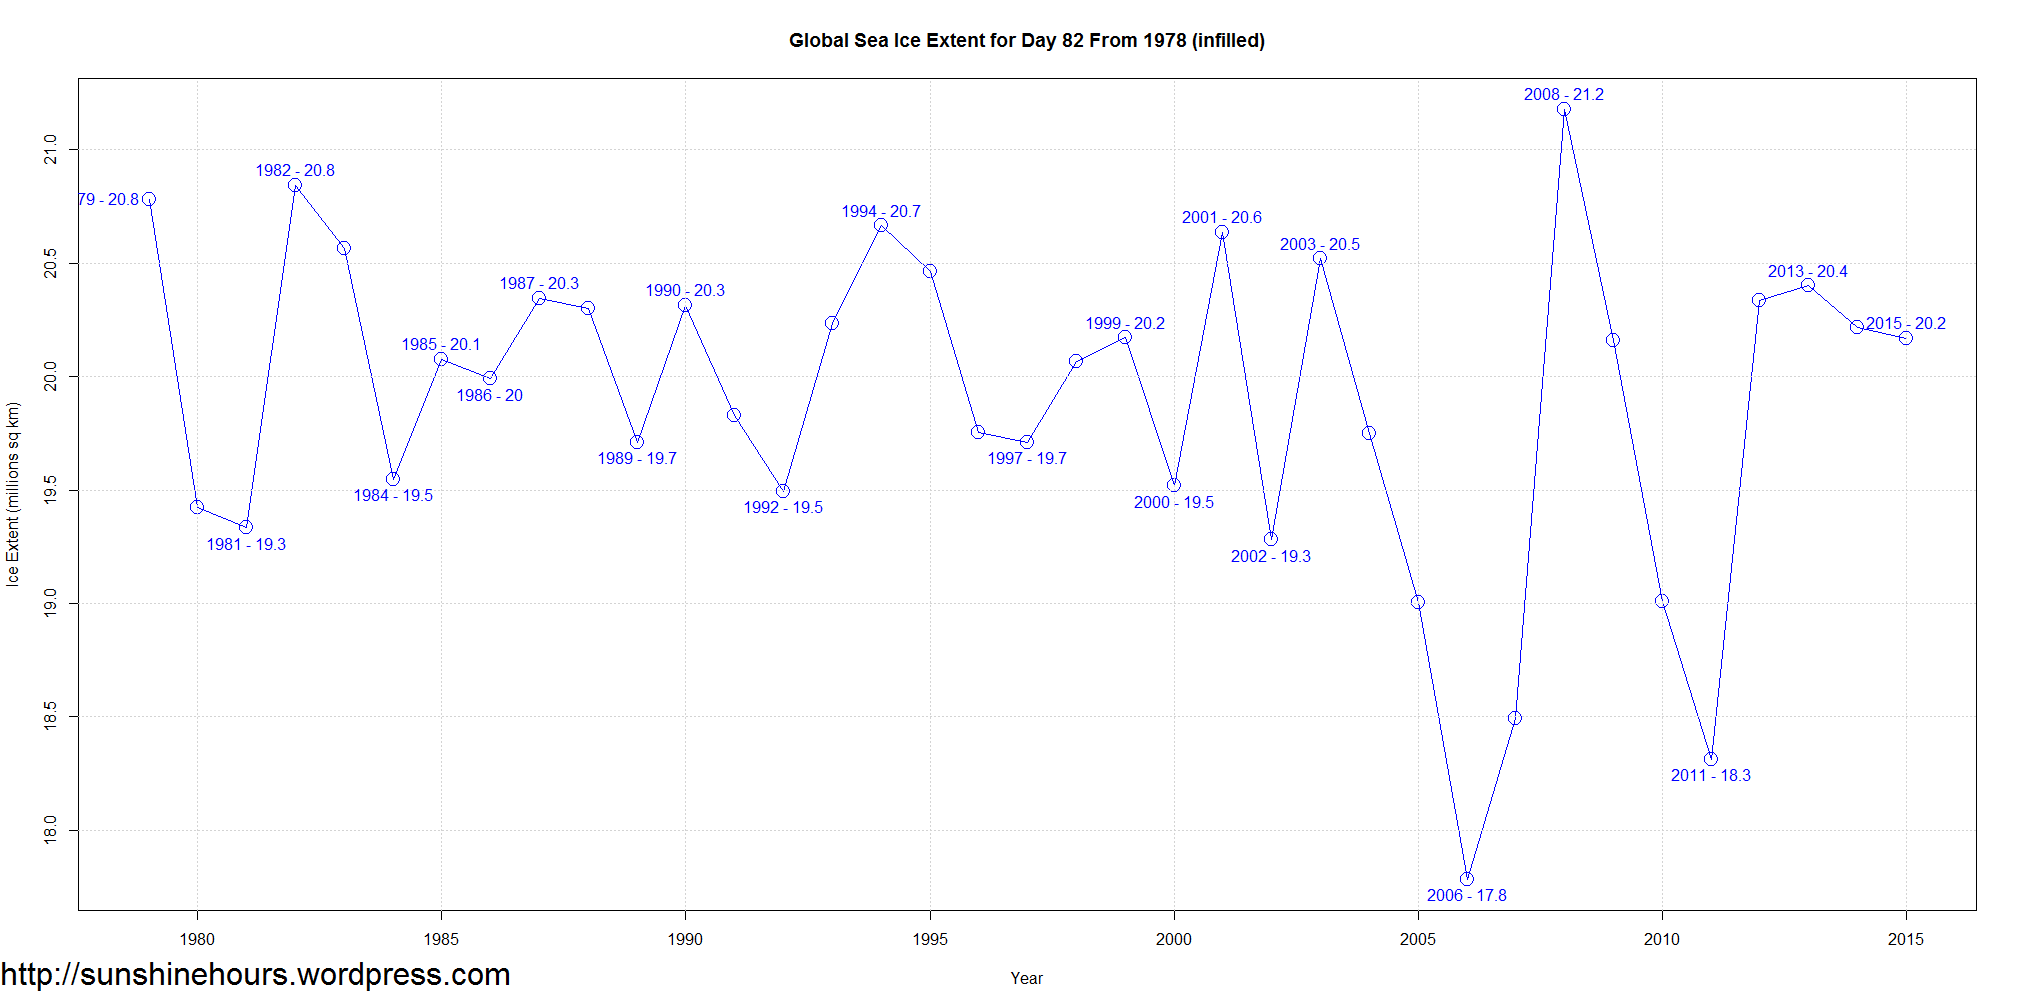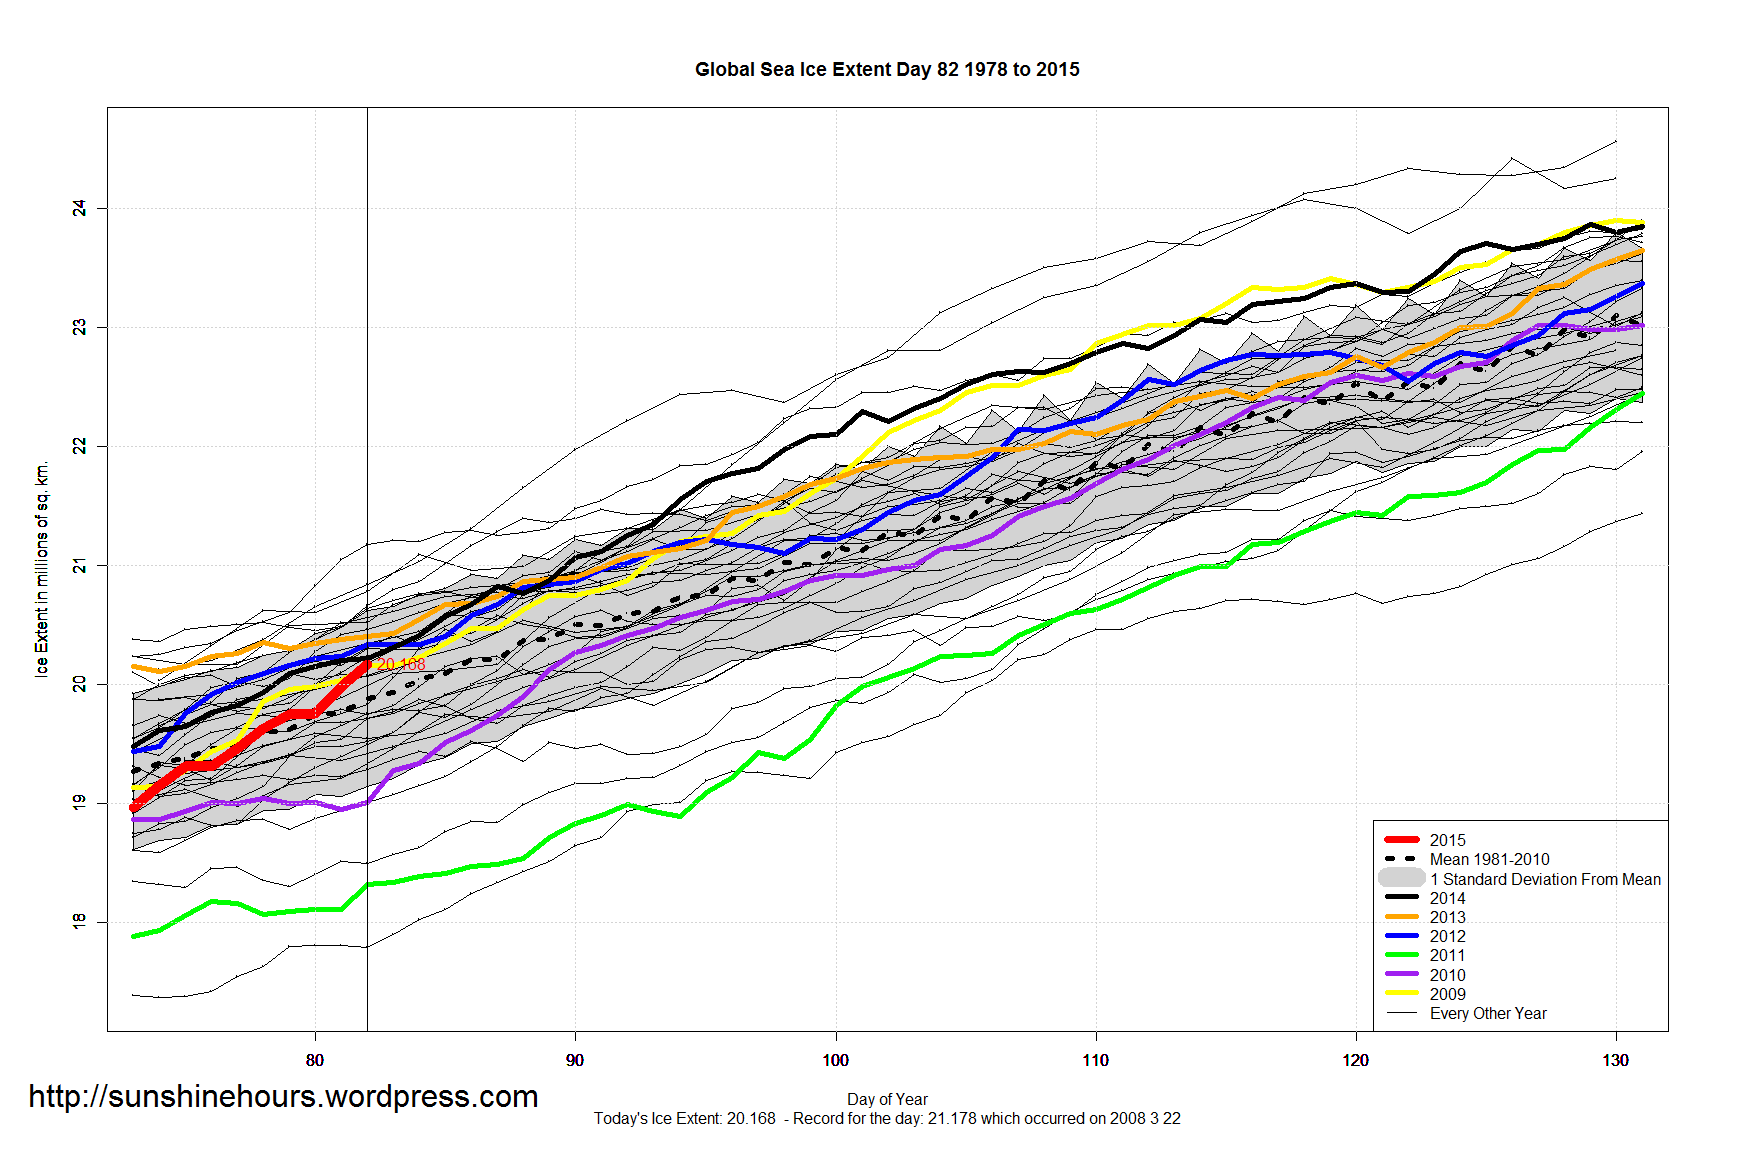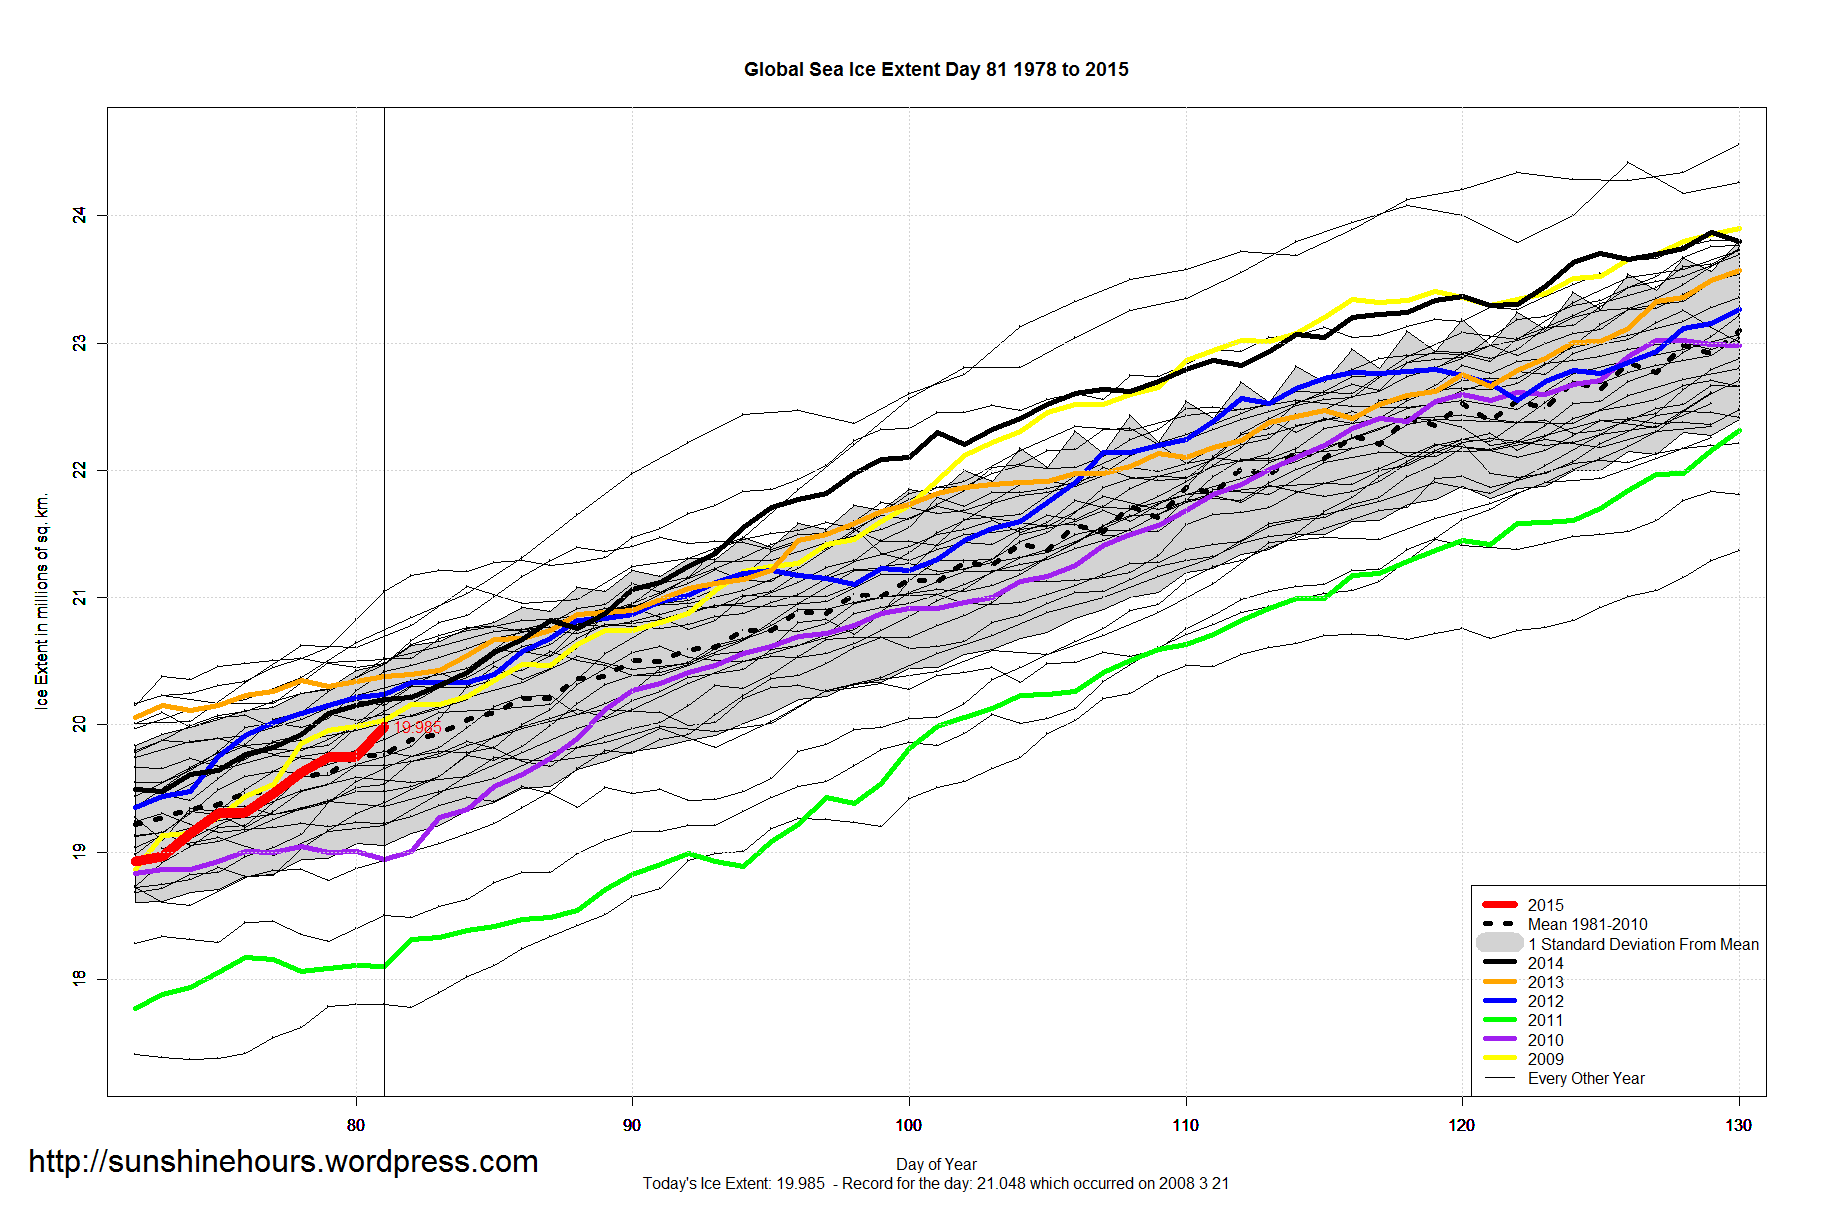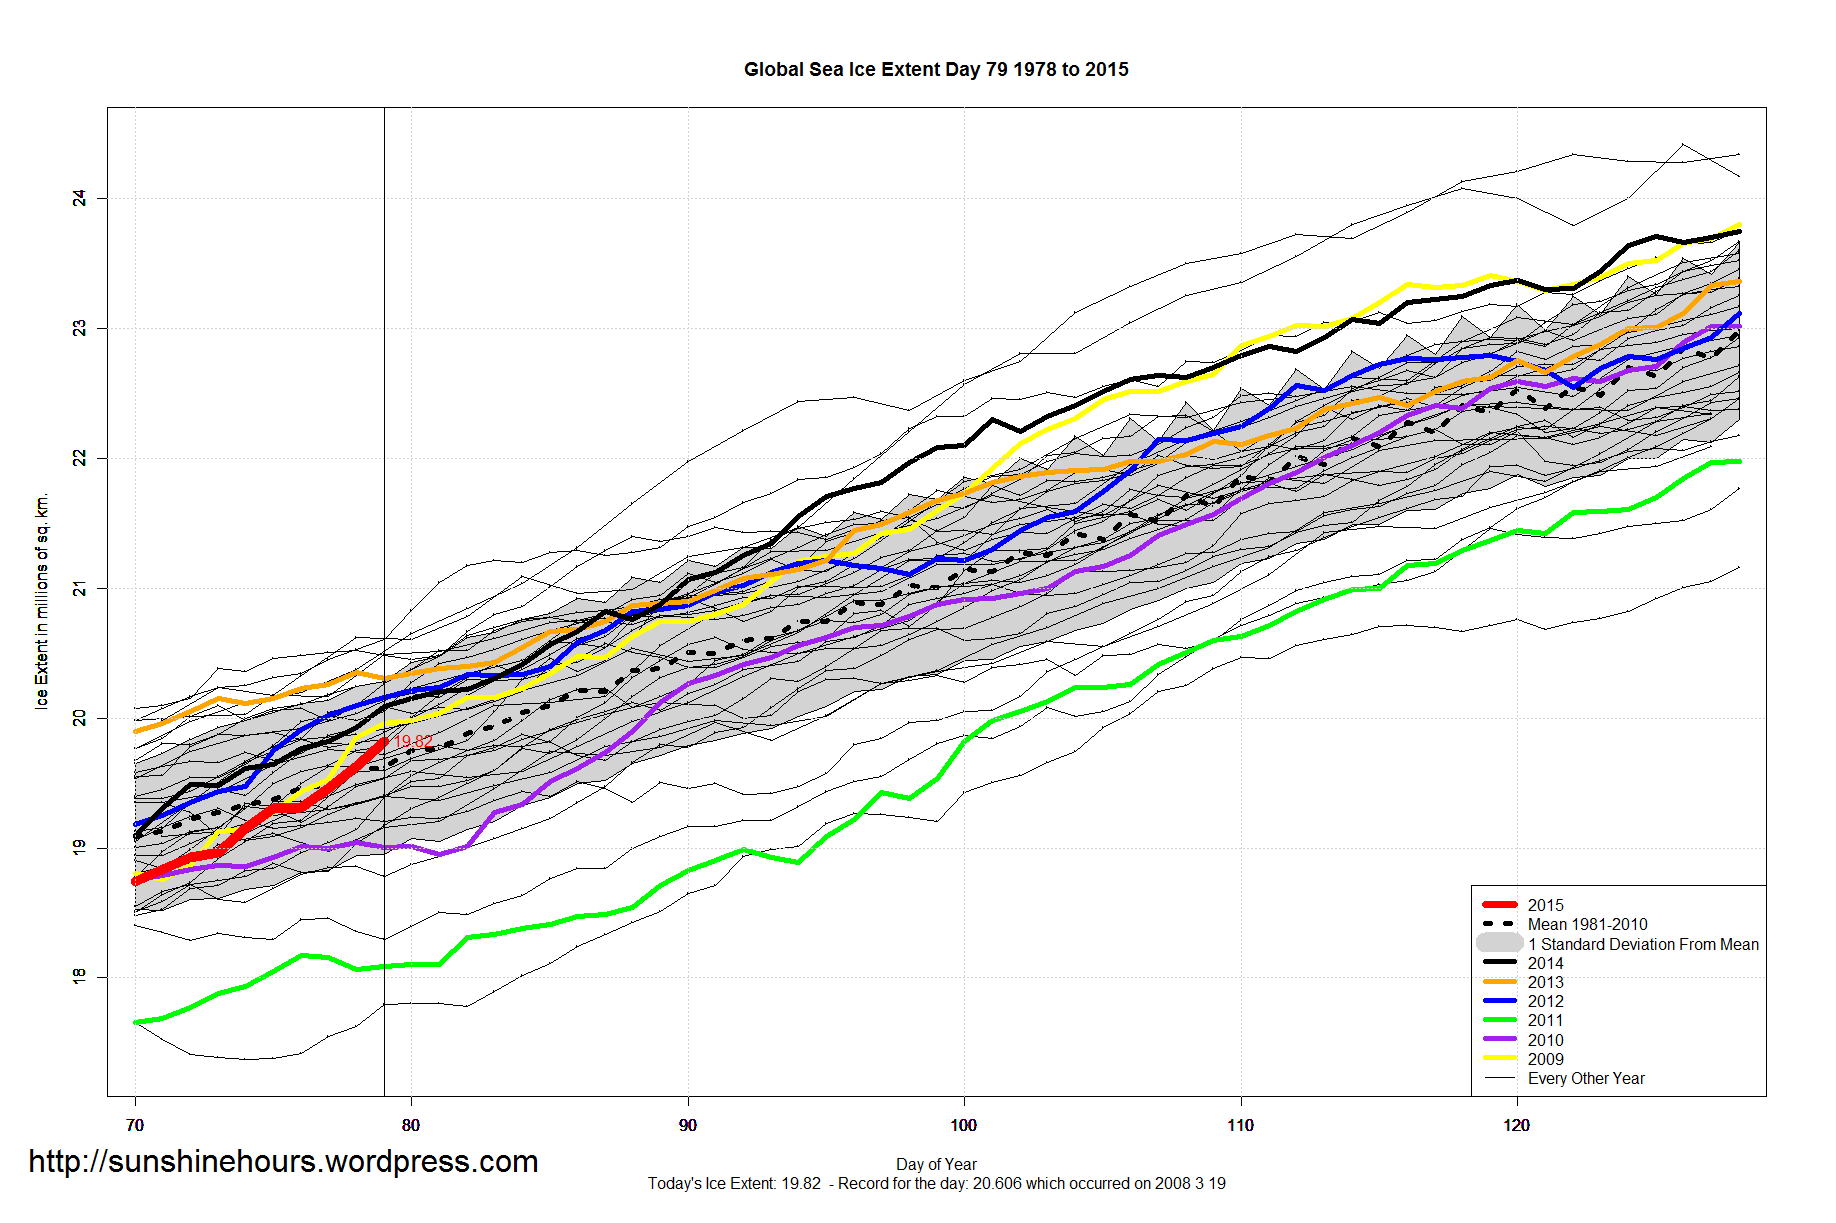


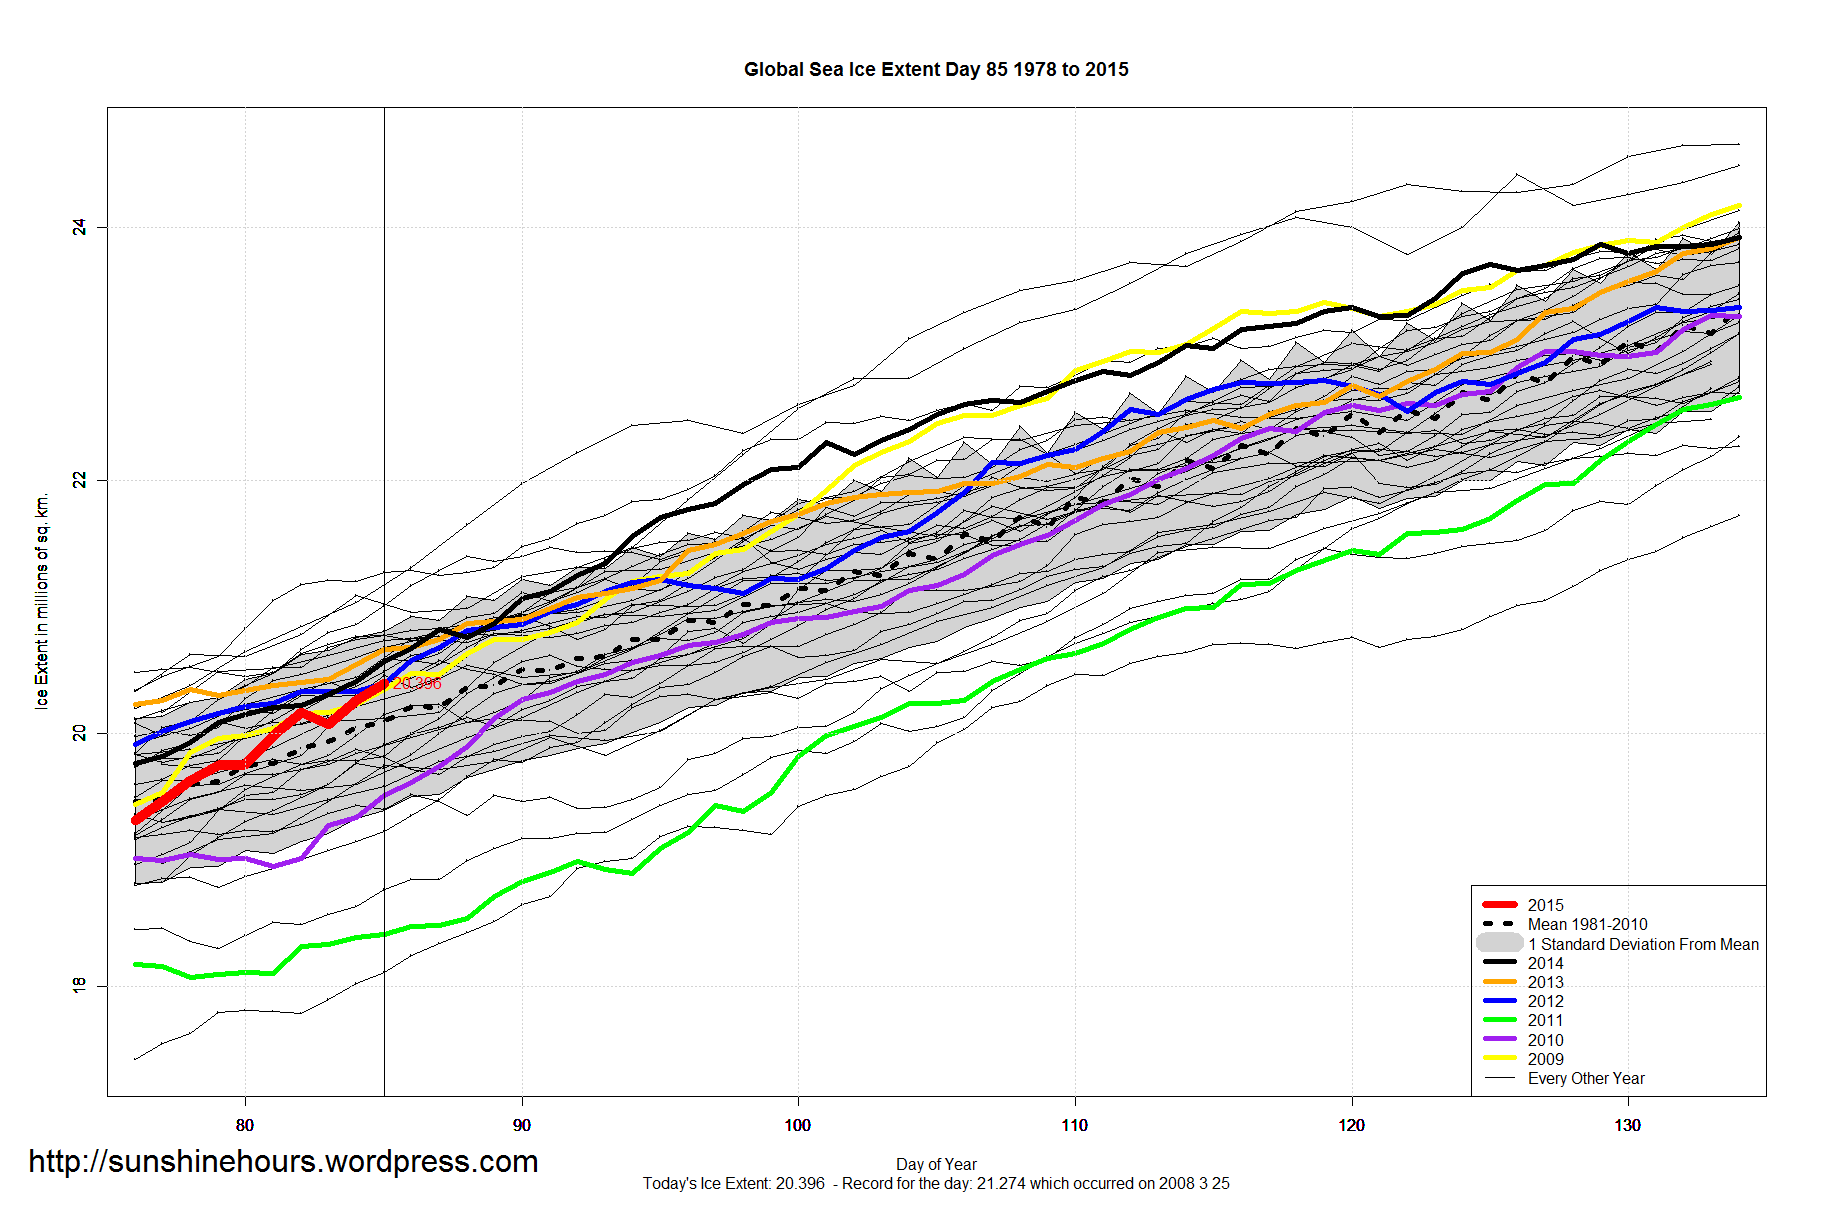
Global Sea Ice is above the 1981-2010 mean.
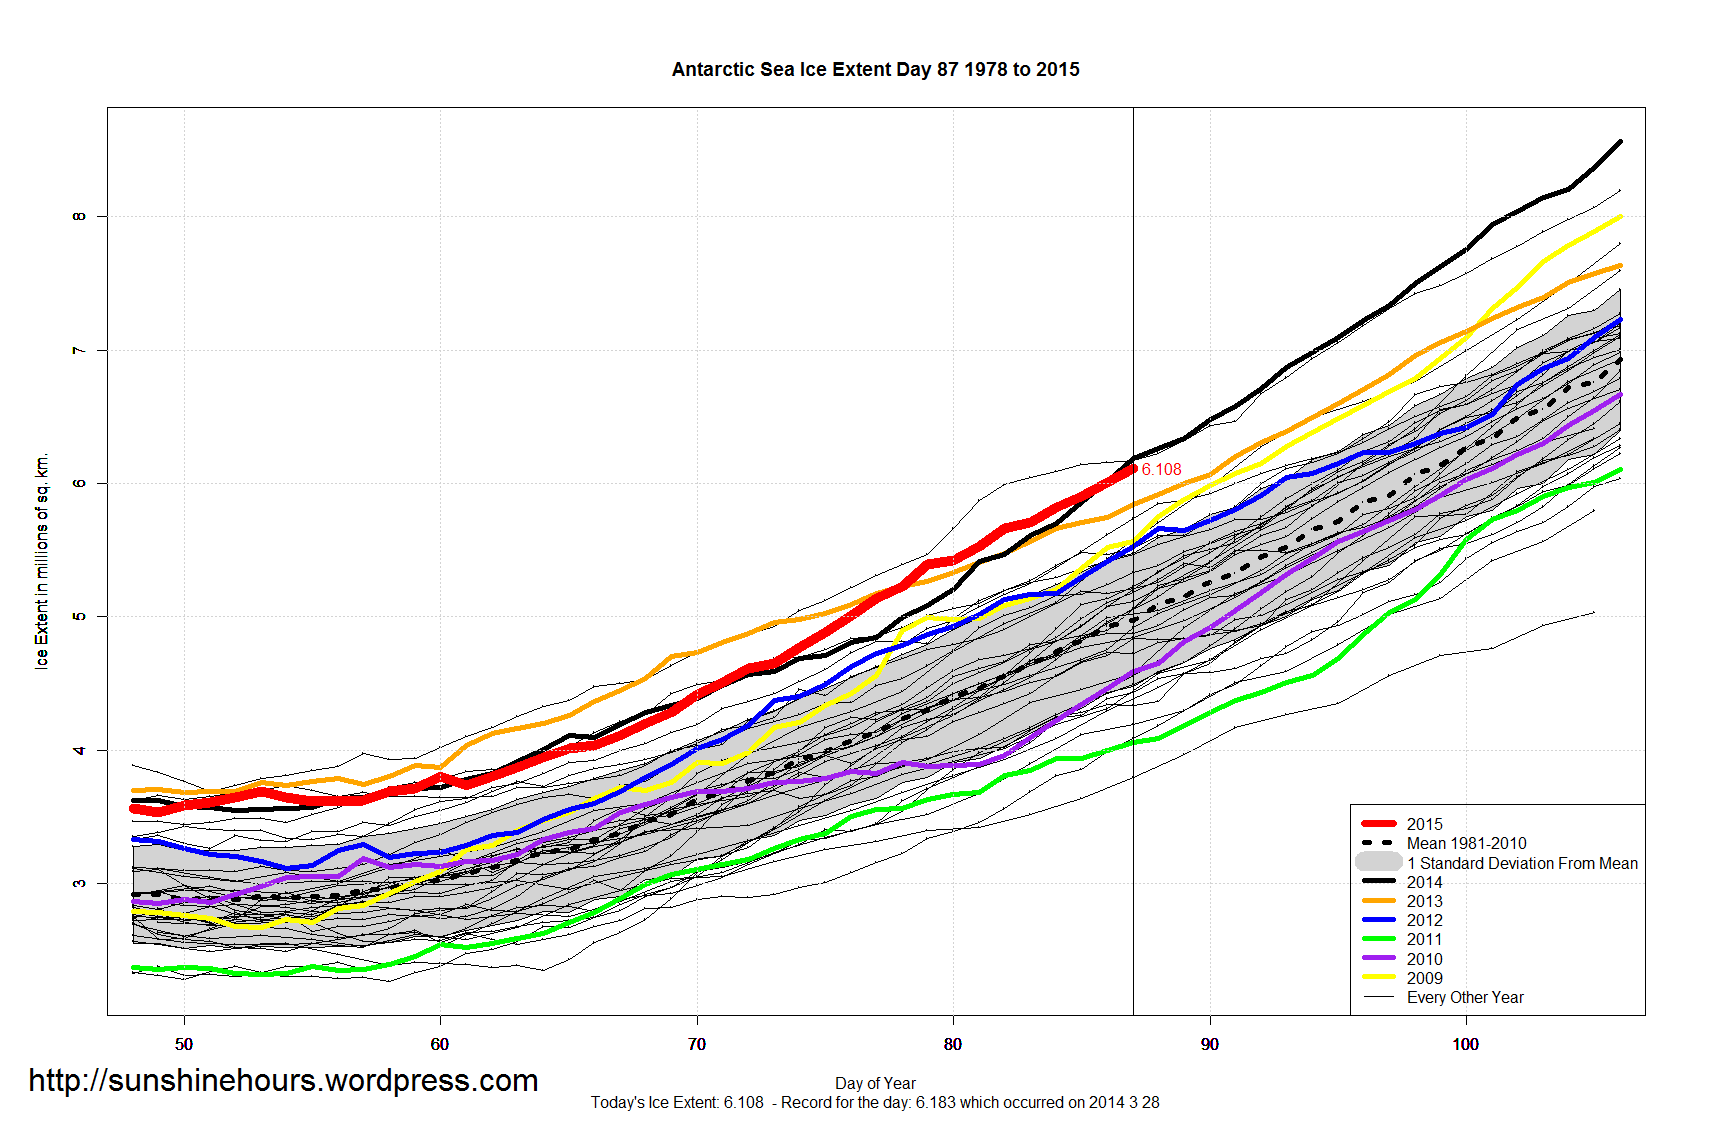
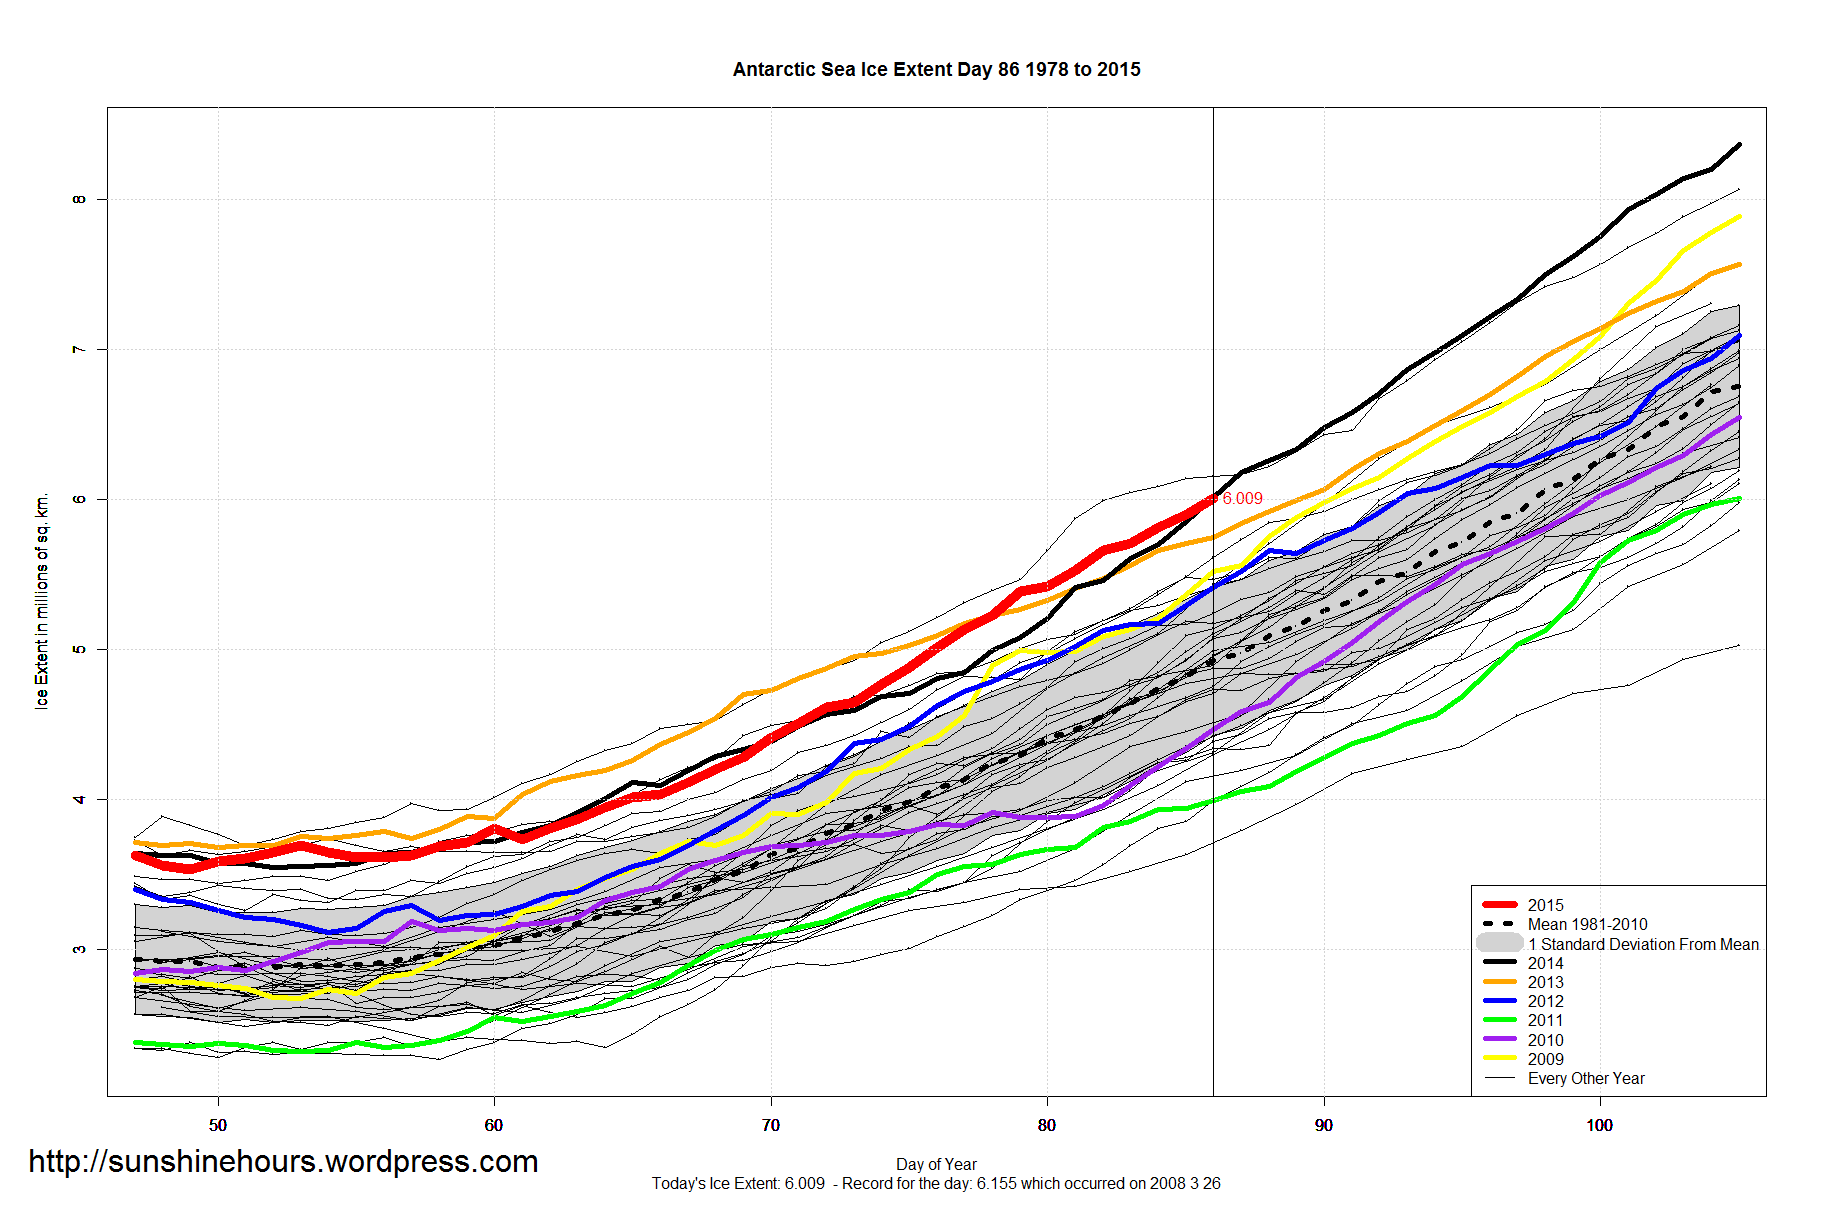
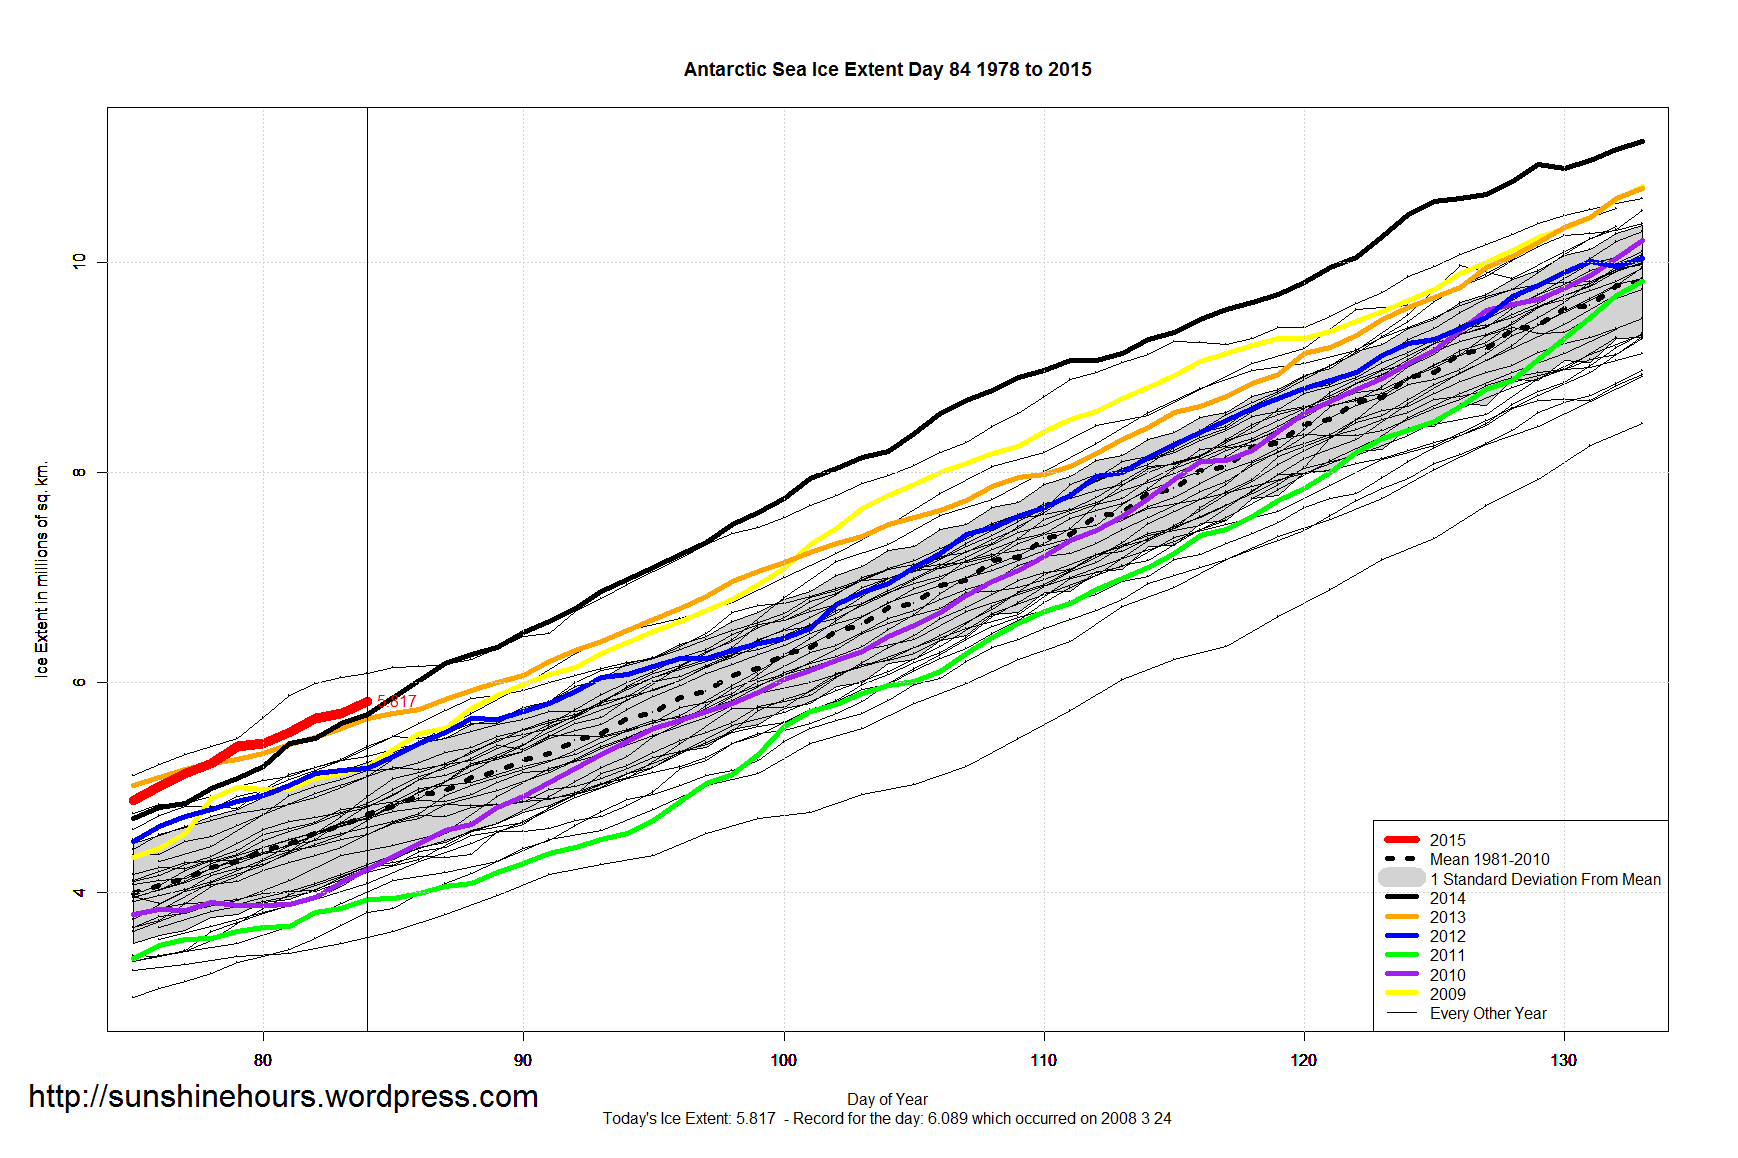
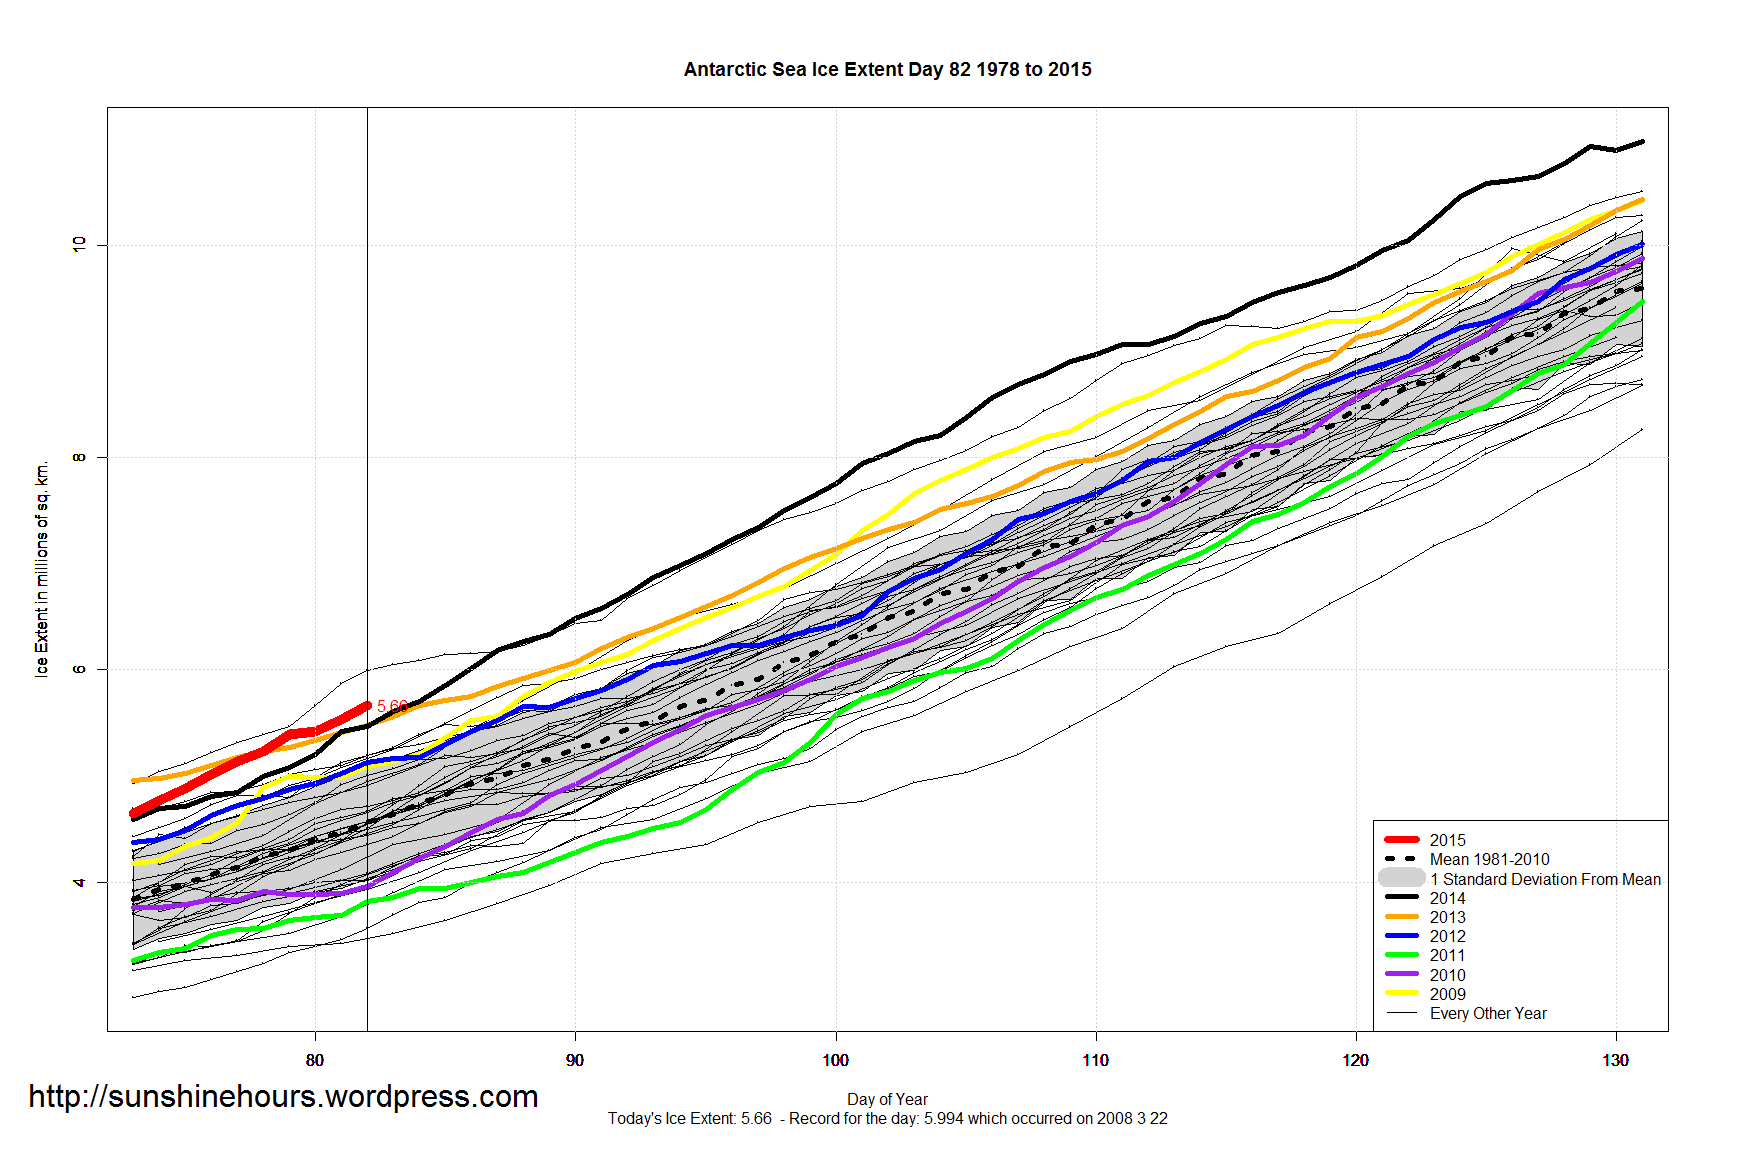
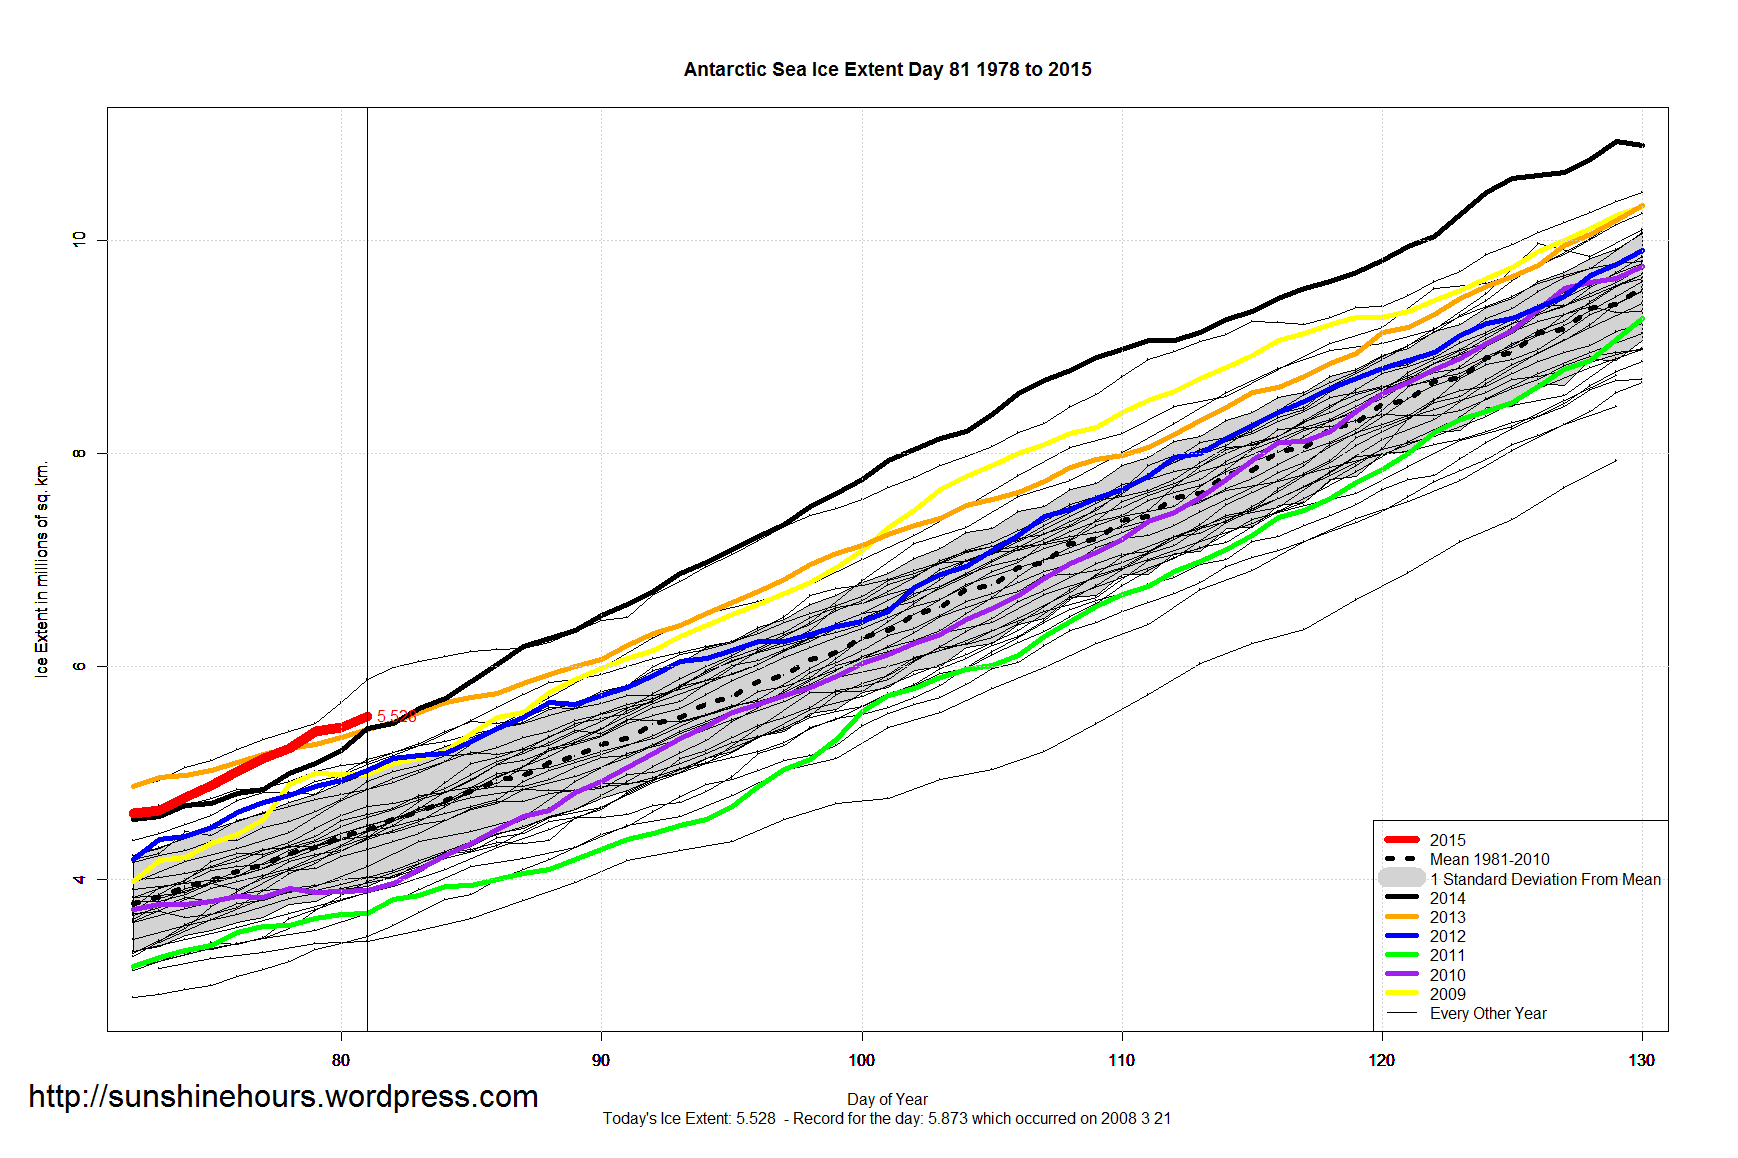
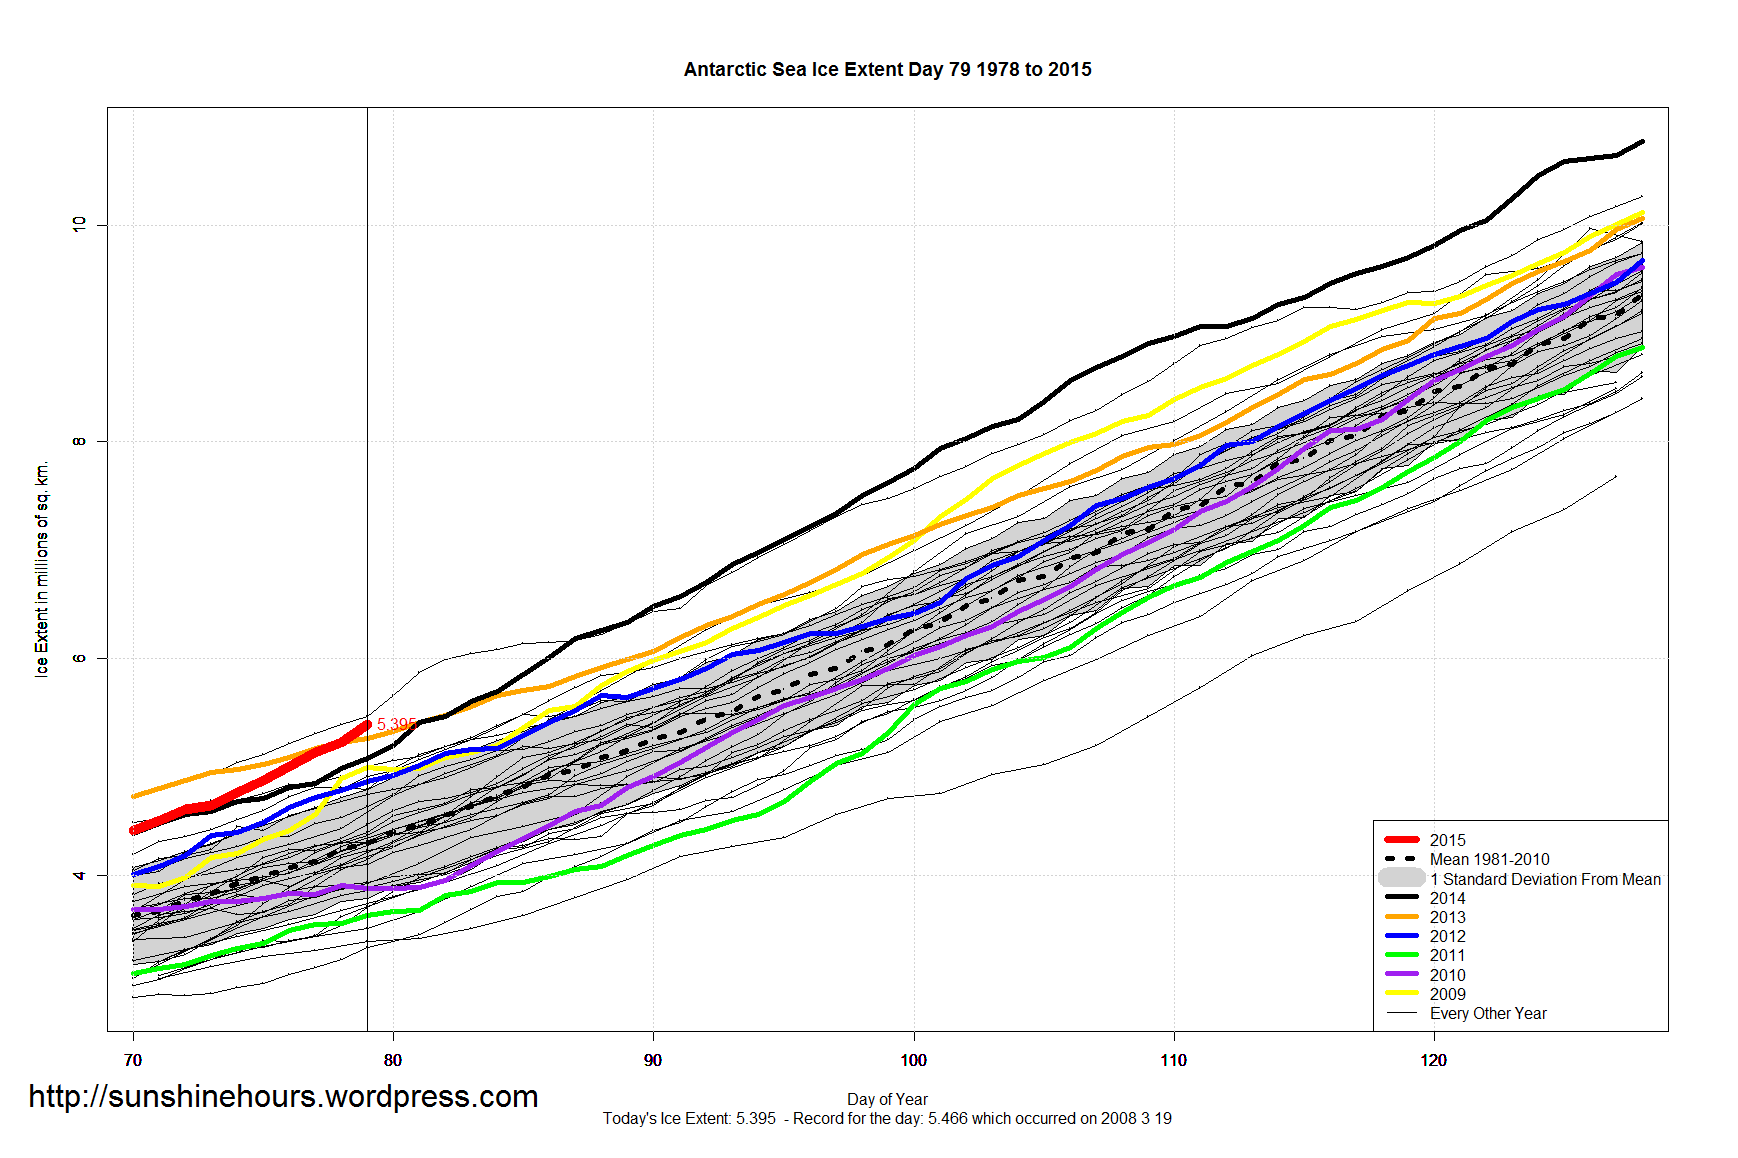
Antarctica is 2 standard deviations above the mean and has been for the last 10 days – and 49 days in total so far in 2015. In January there were 18 days 3 STD above.
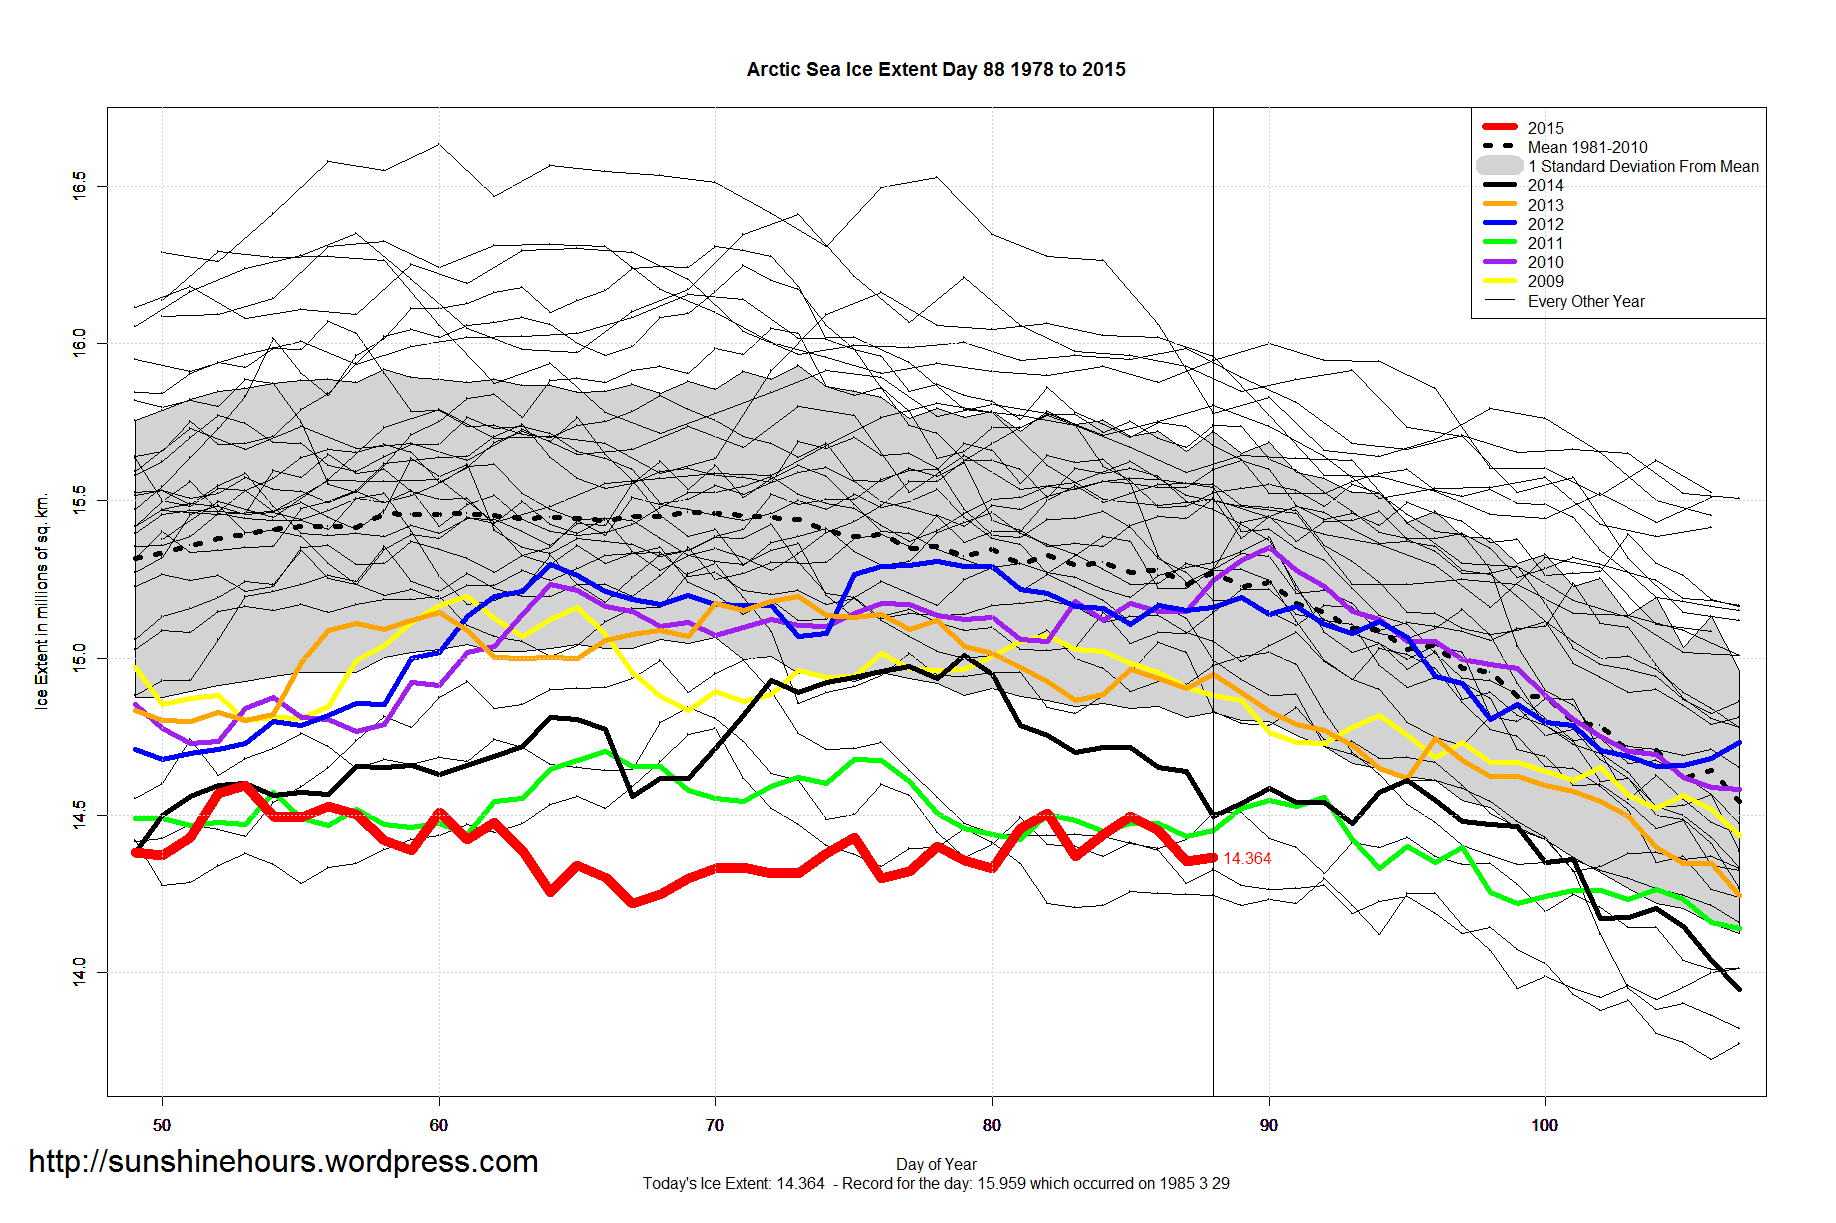
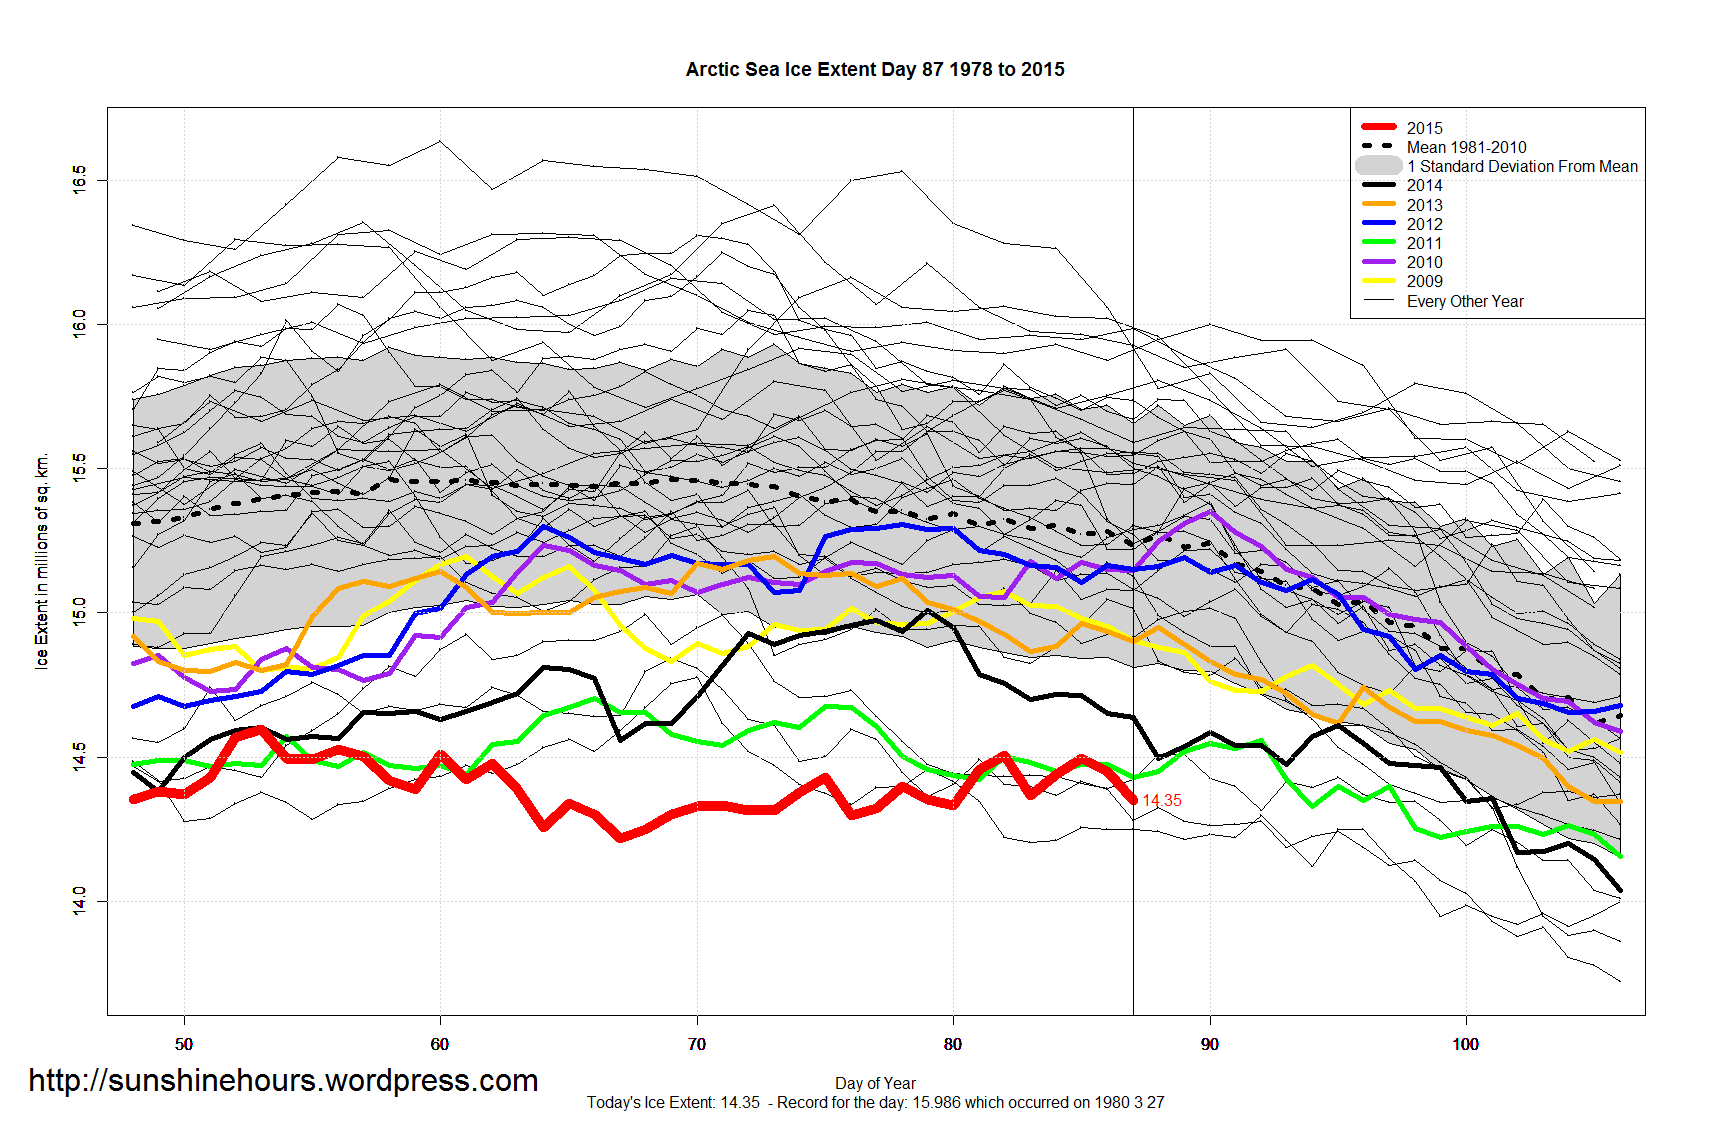
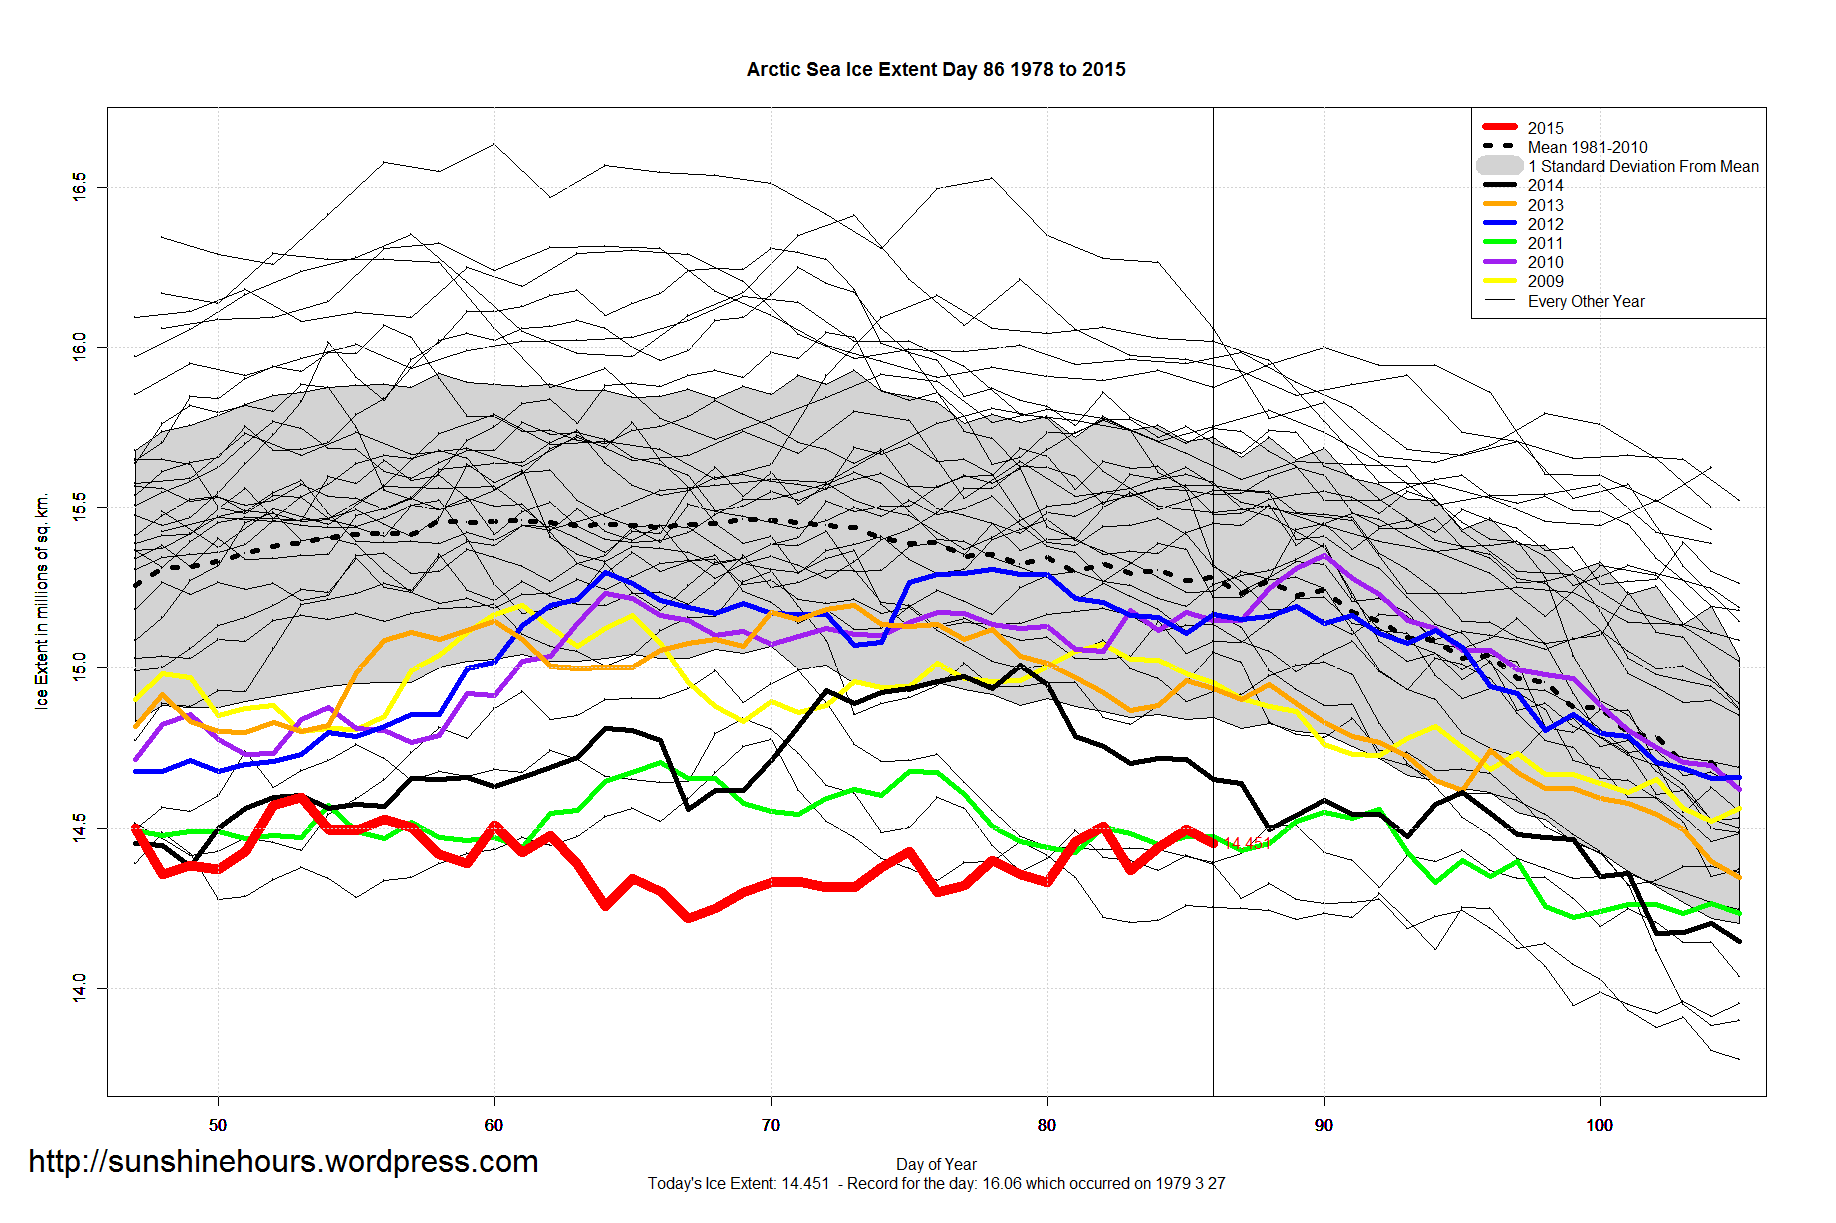
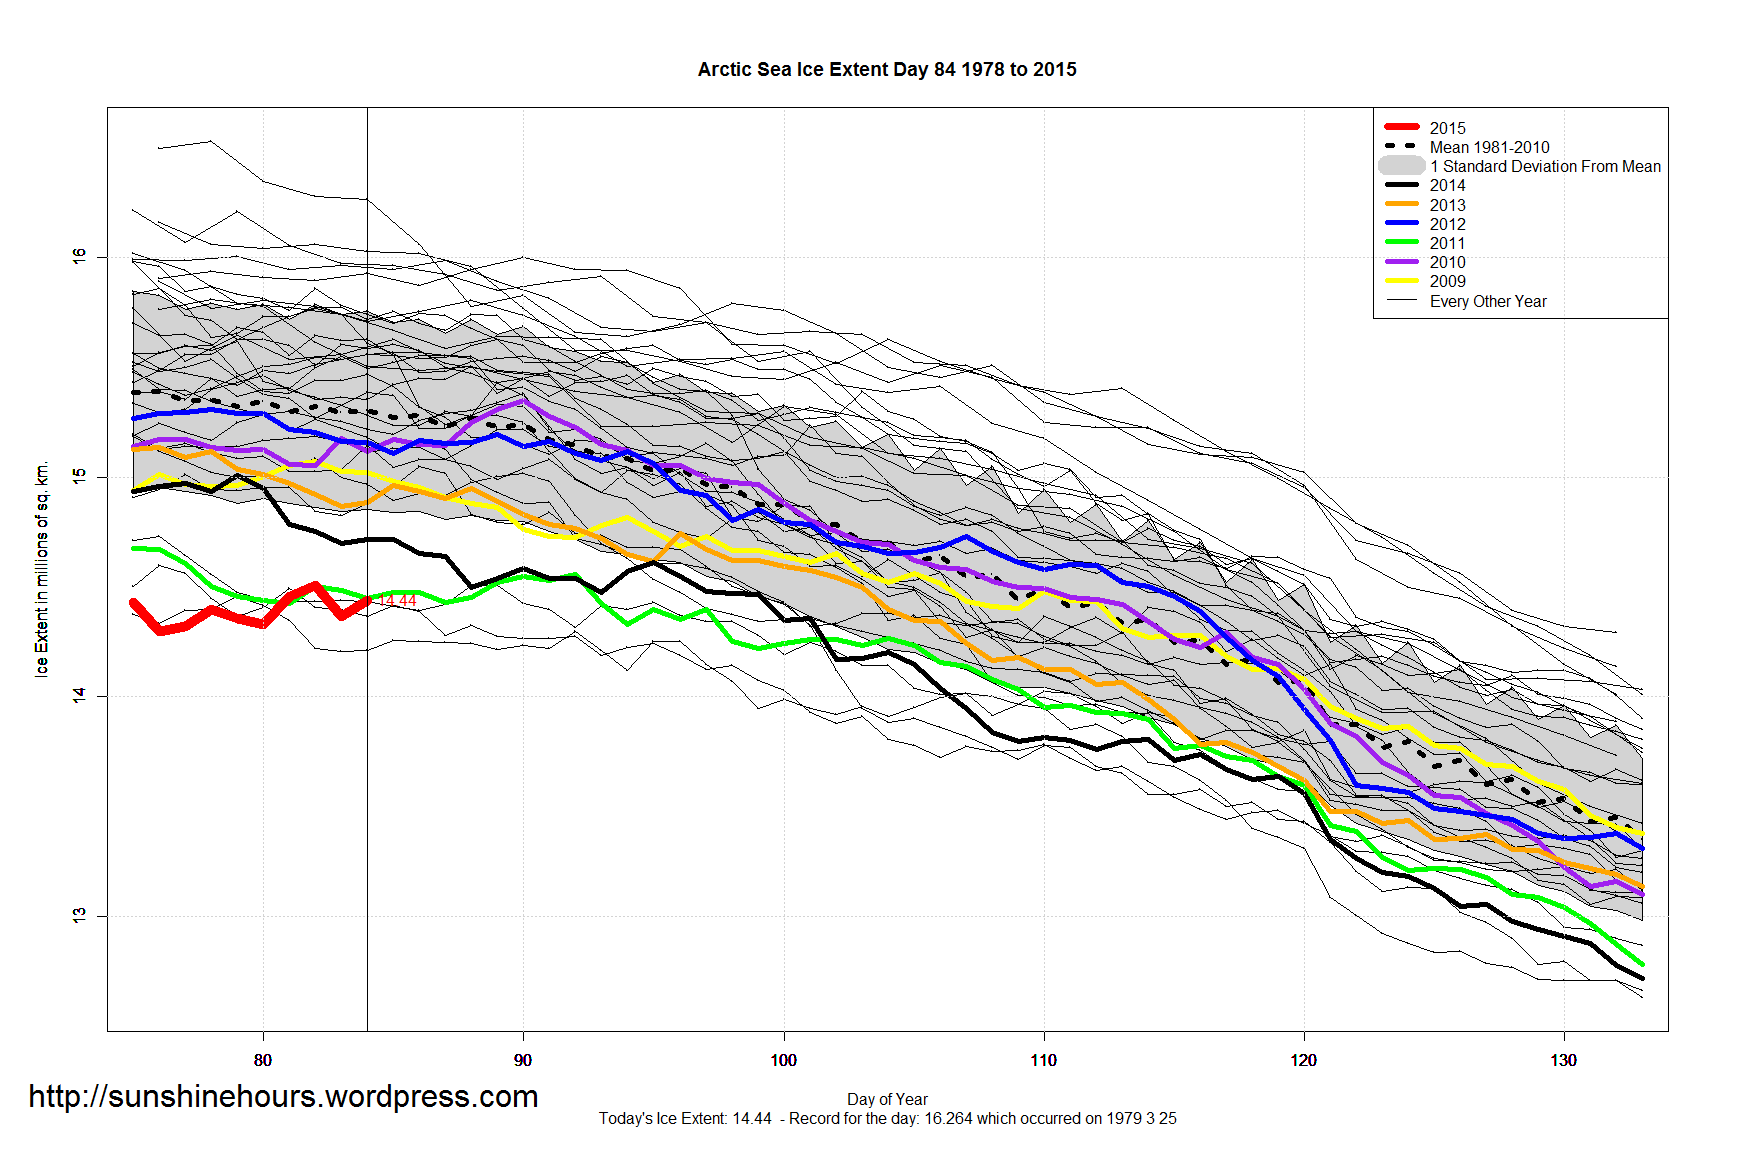
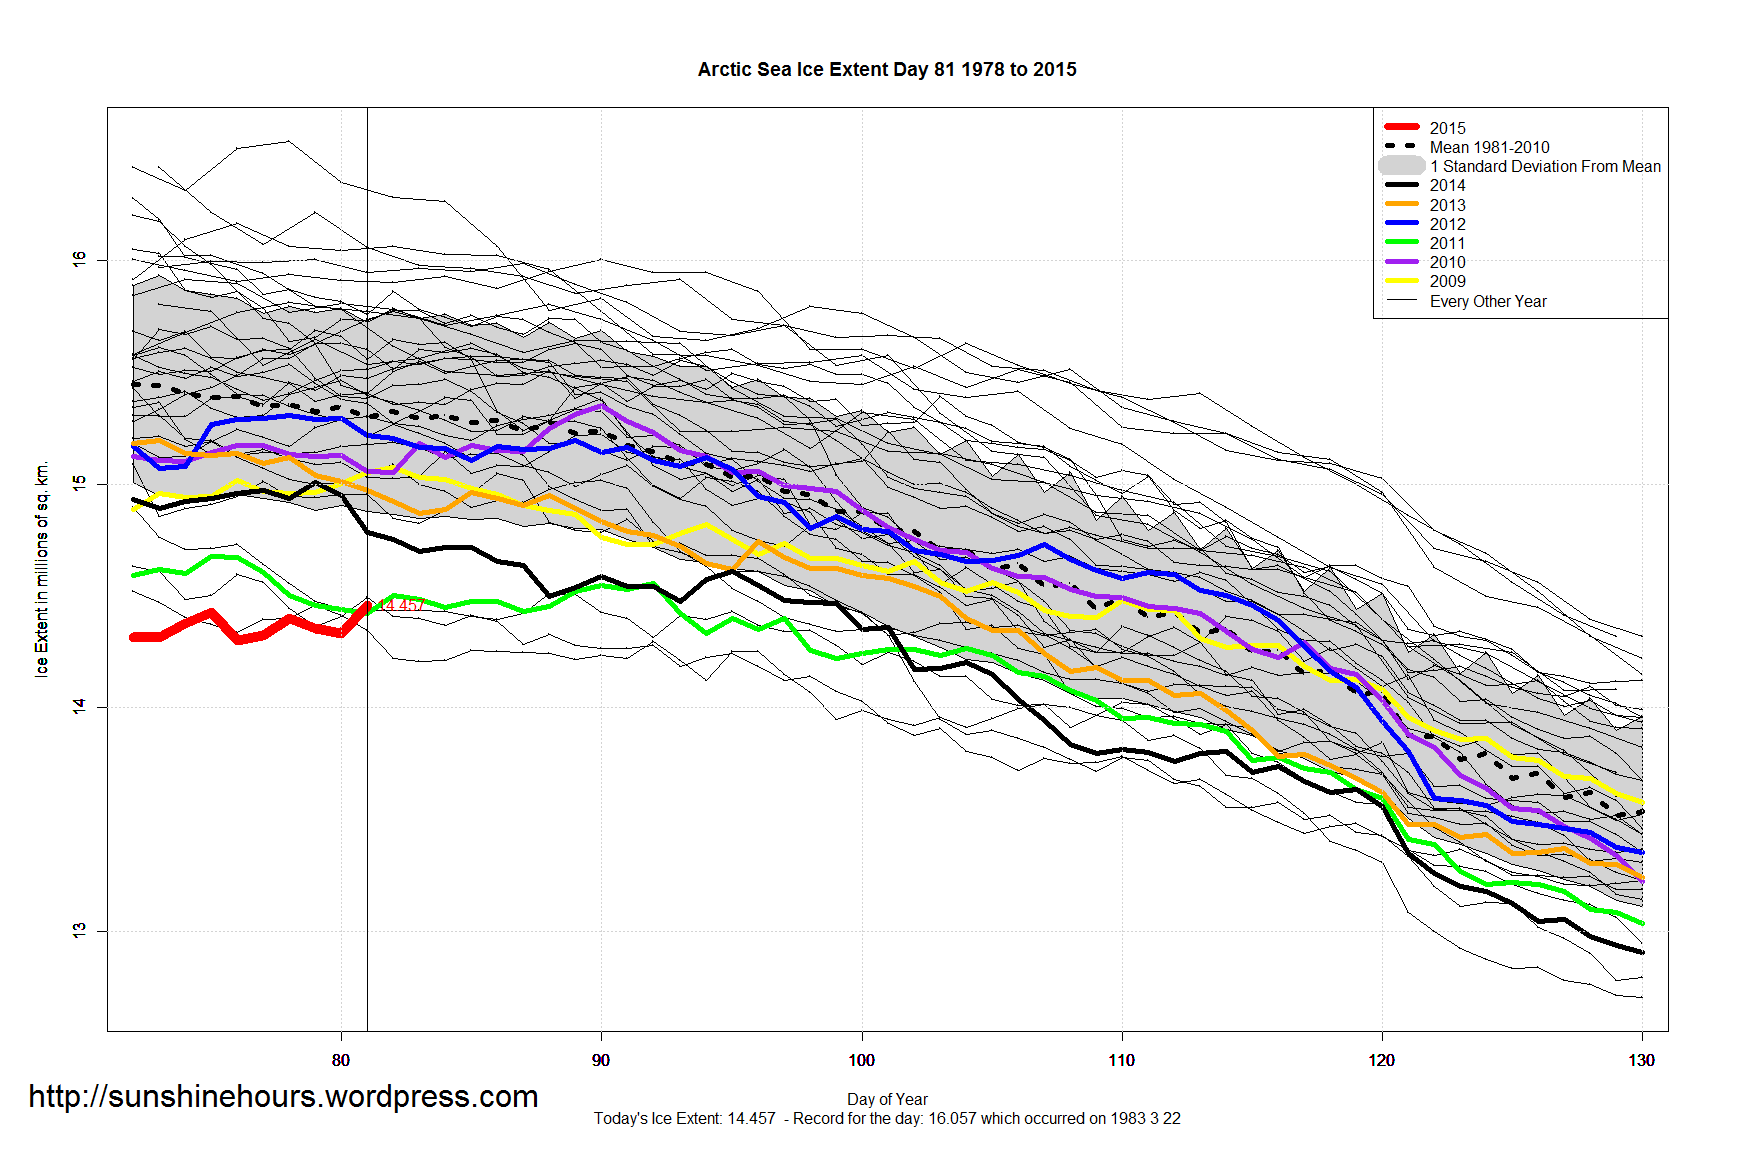
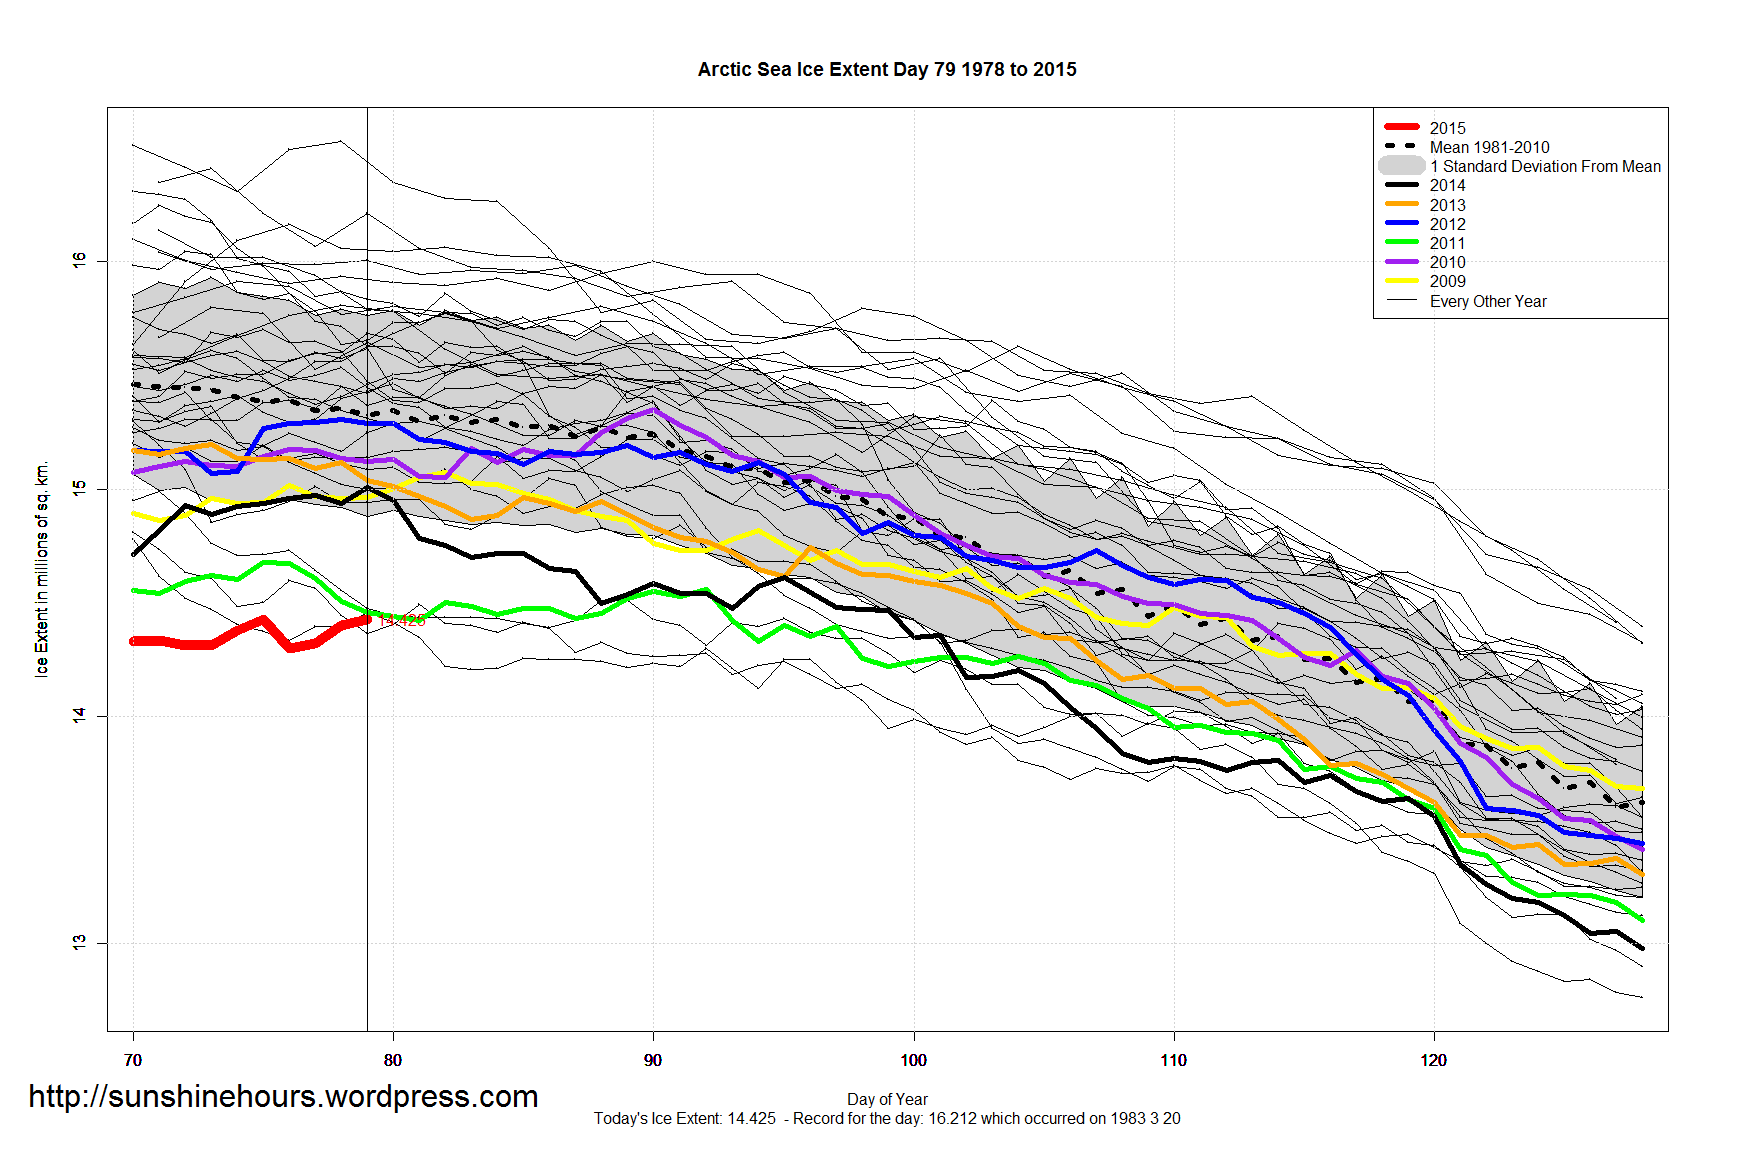
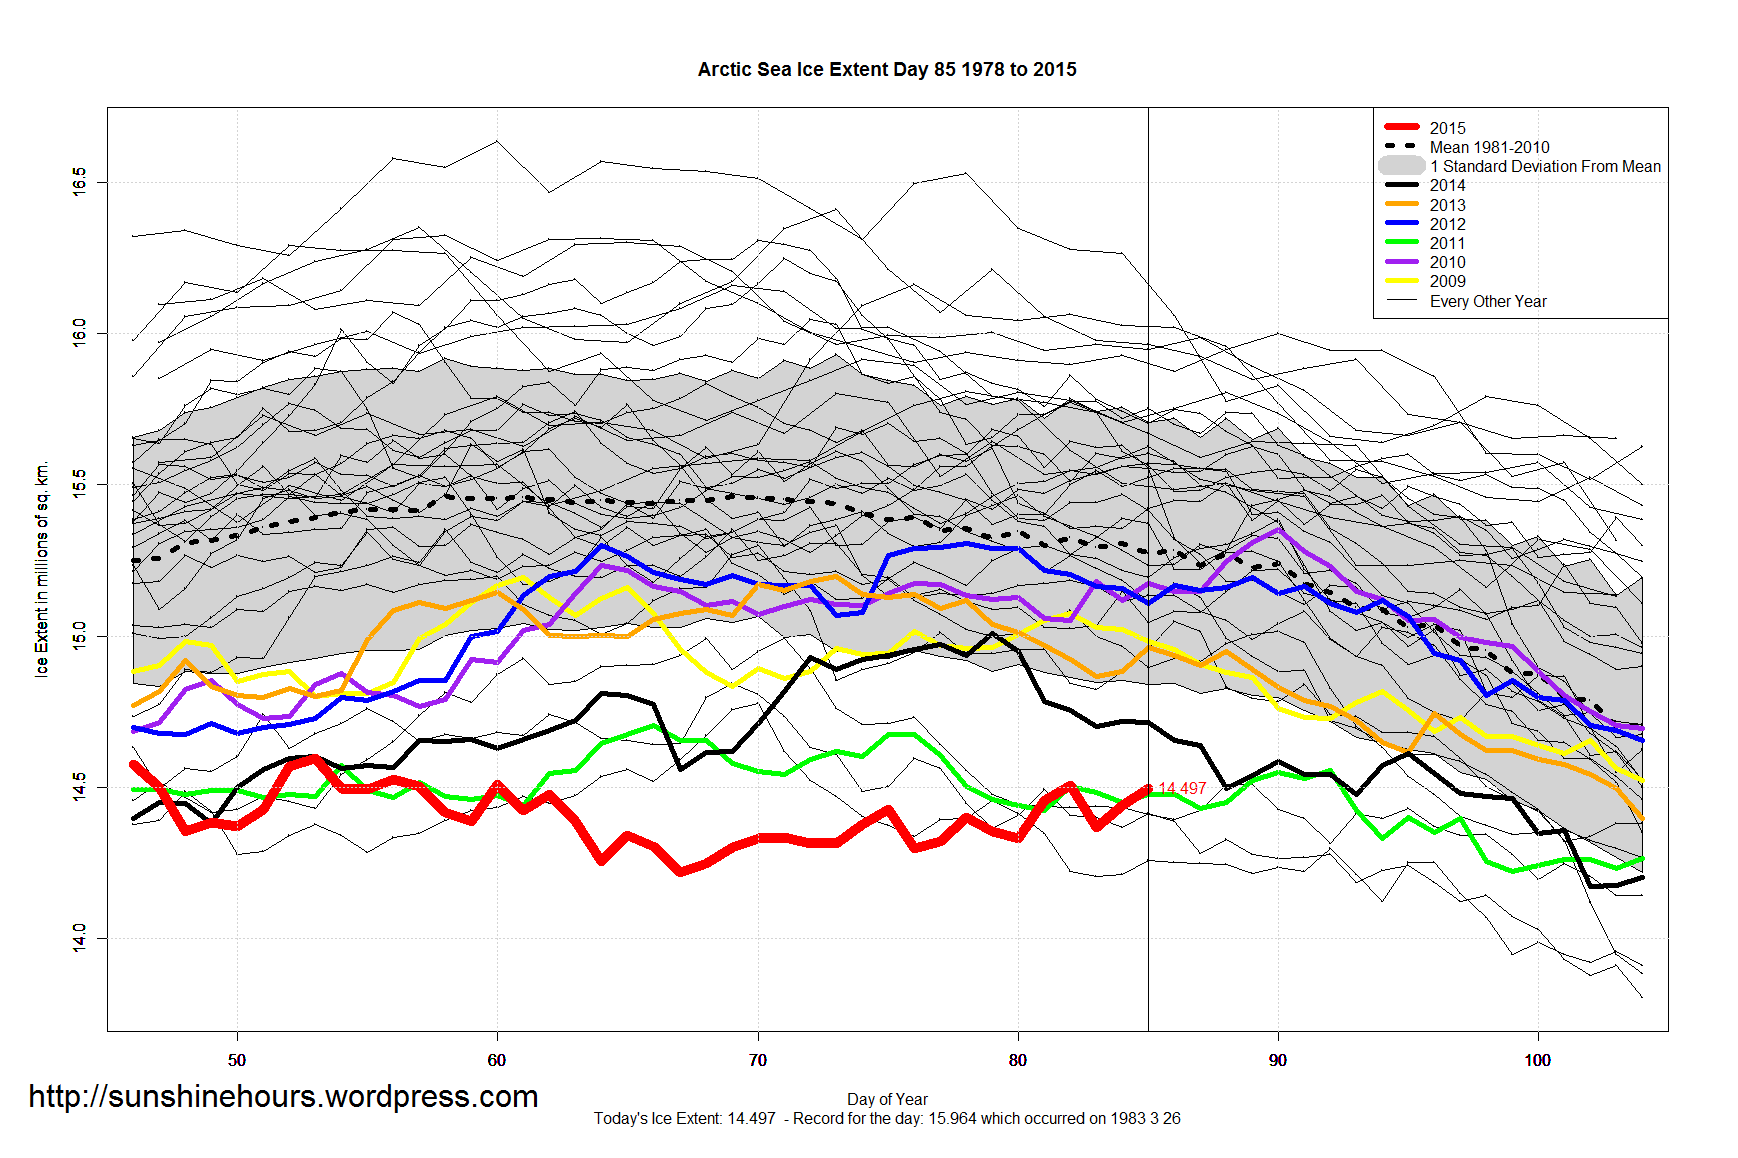
The Arctic is only 98,000 sq km below the ‘maximum’ for 2015 which I called on day 53 (which may still turn out to be wrong). (See bottom graph for last 40 days)

A couple of years ago I posted an article about waste heat.
“The waste heat generated by car engines, power plants, home furnaces and other fossil fuel-burning machinery plays an unappreciated role in influencing regional climates, new computer simulations suggest. By altering atmospheric circulation, human-made heat may raise temperatures by as much as 1 degree Celsius during winter in the northernmost parts of the world.”
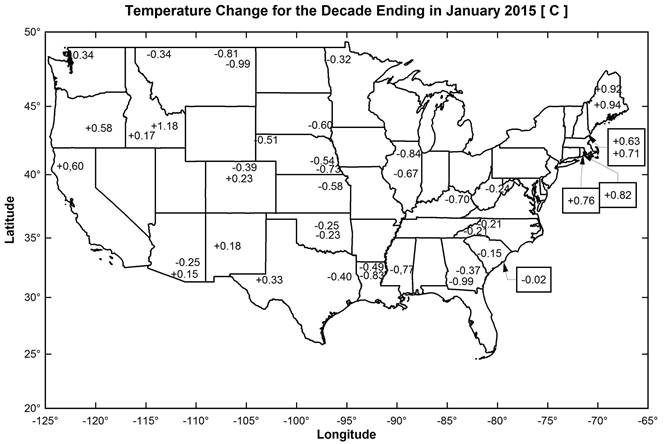
Compare this map of CRN temperature changes from a WUWT article to the population growth map.