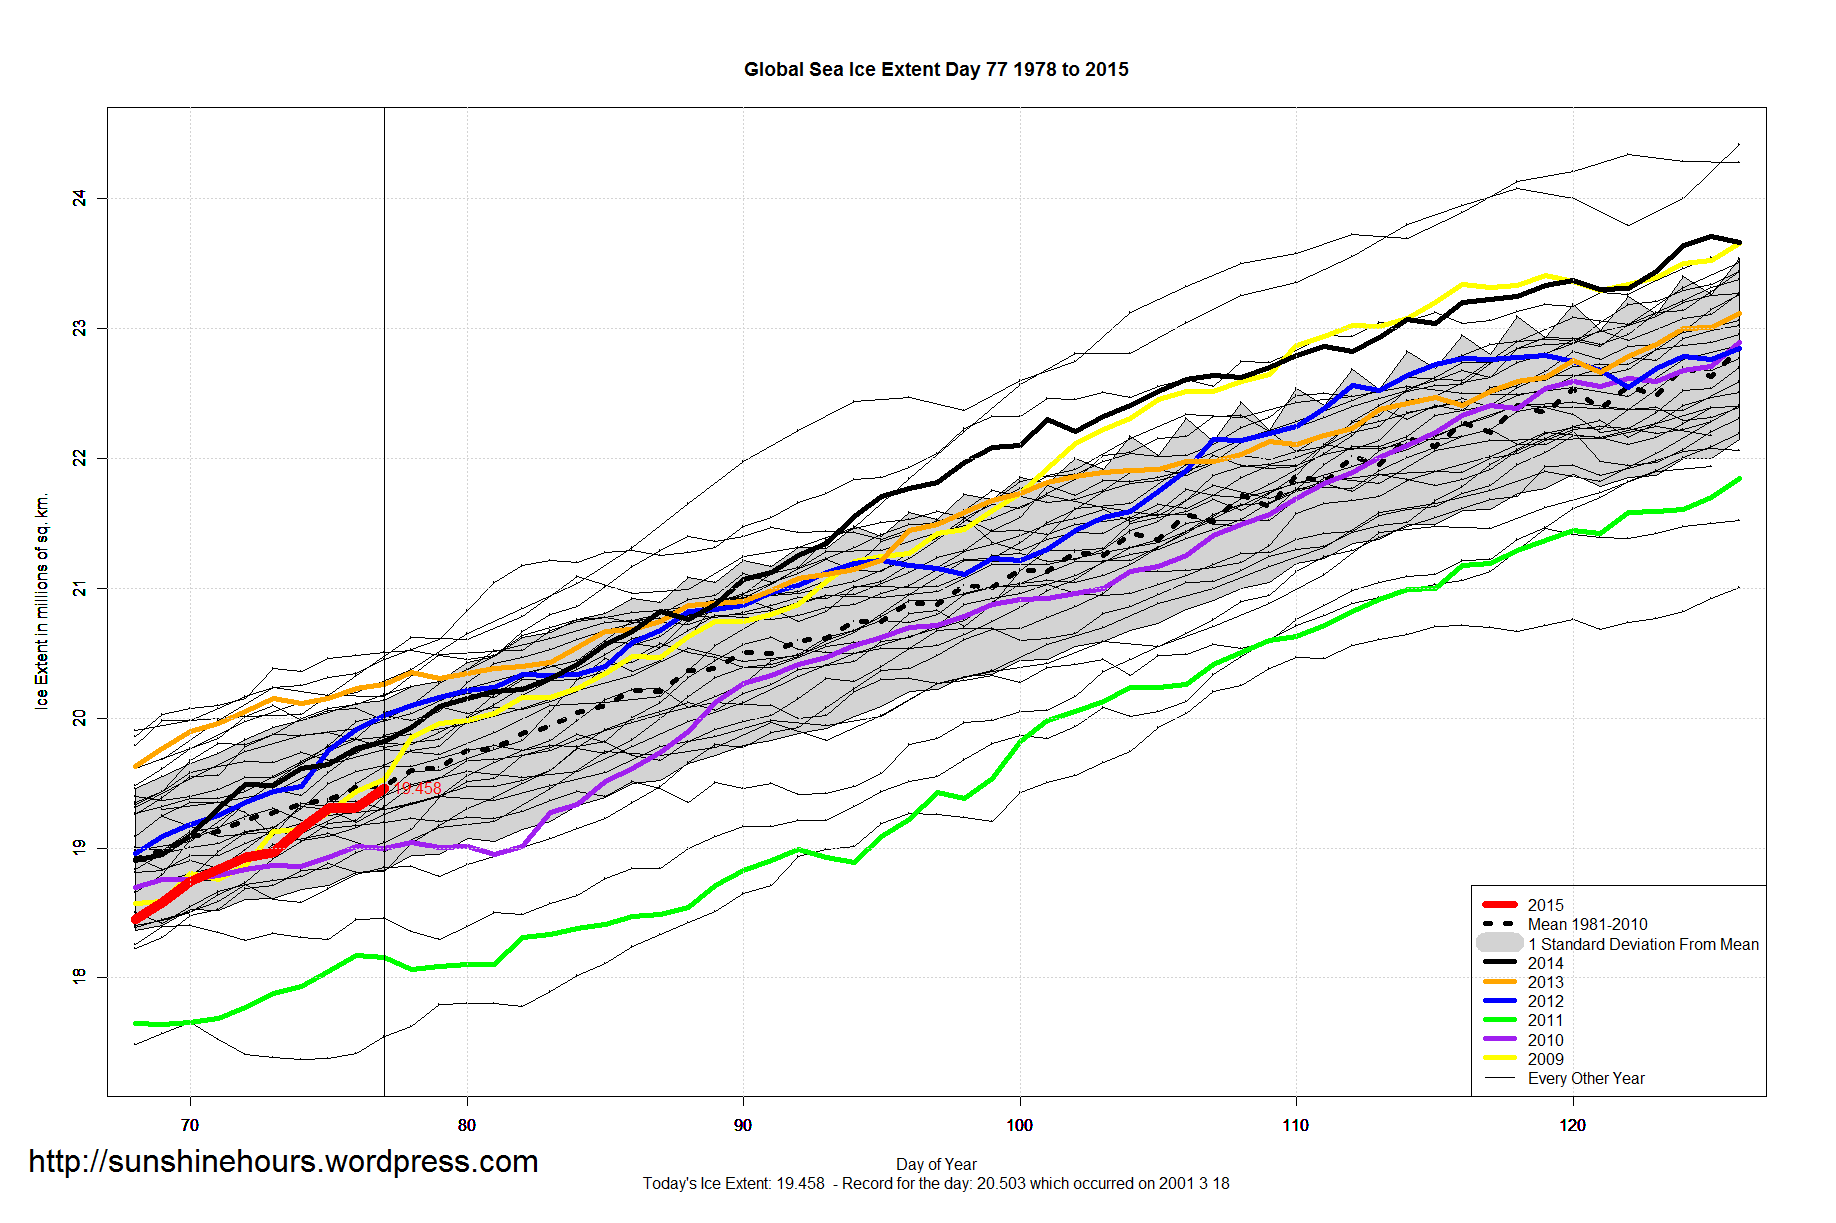
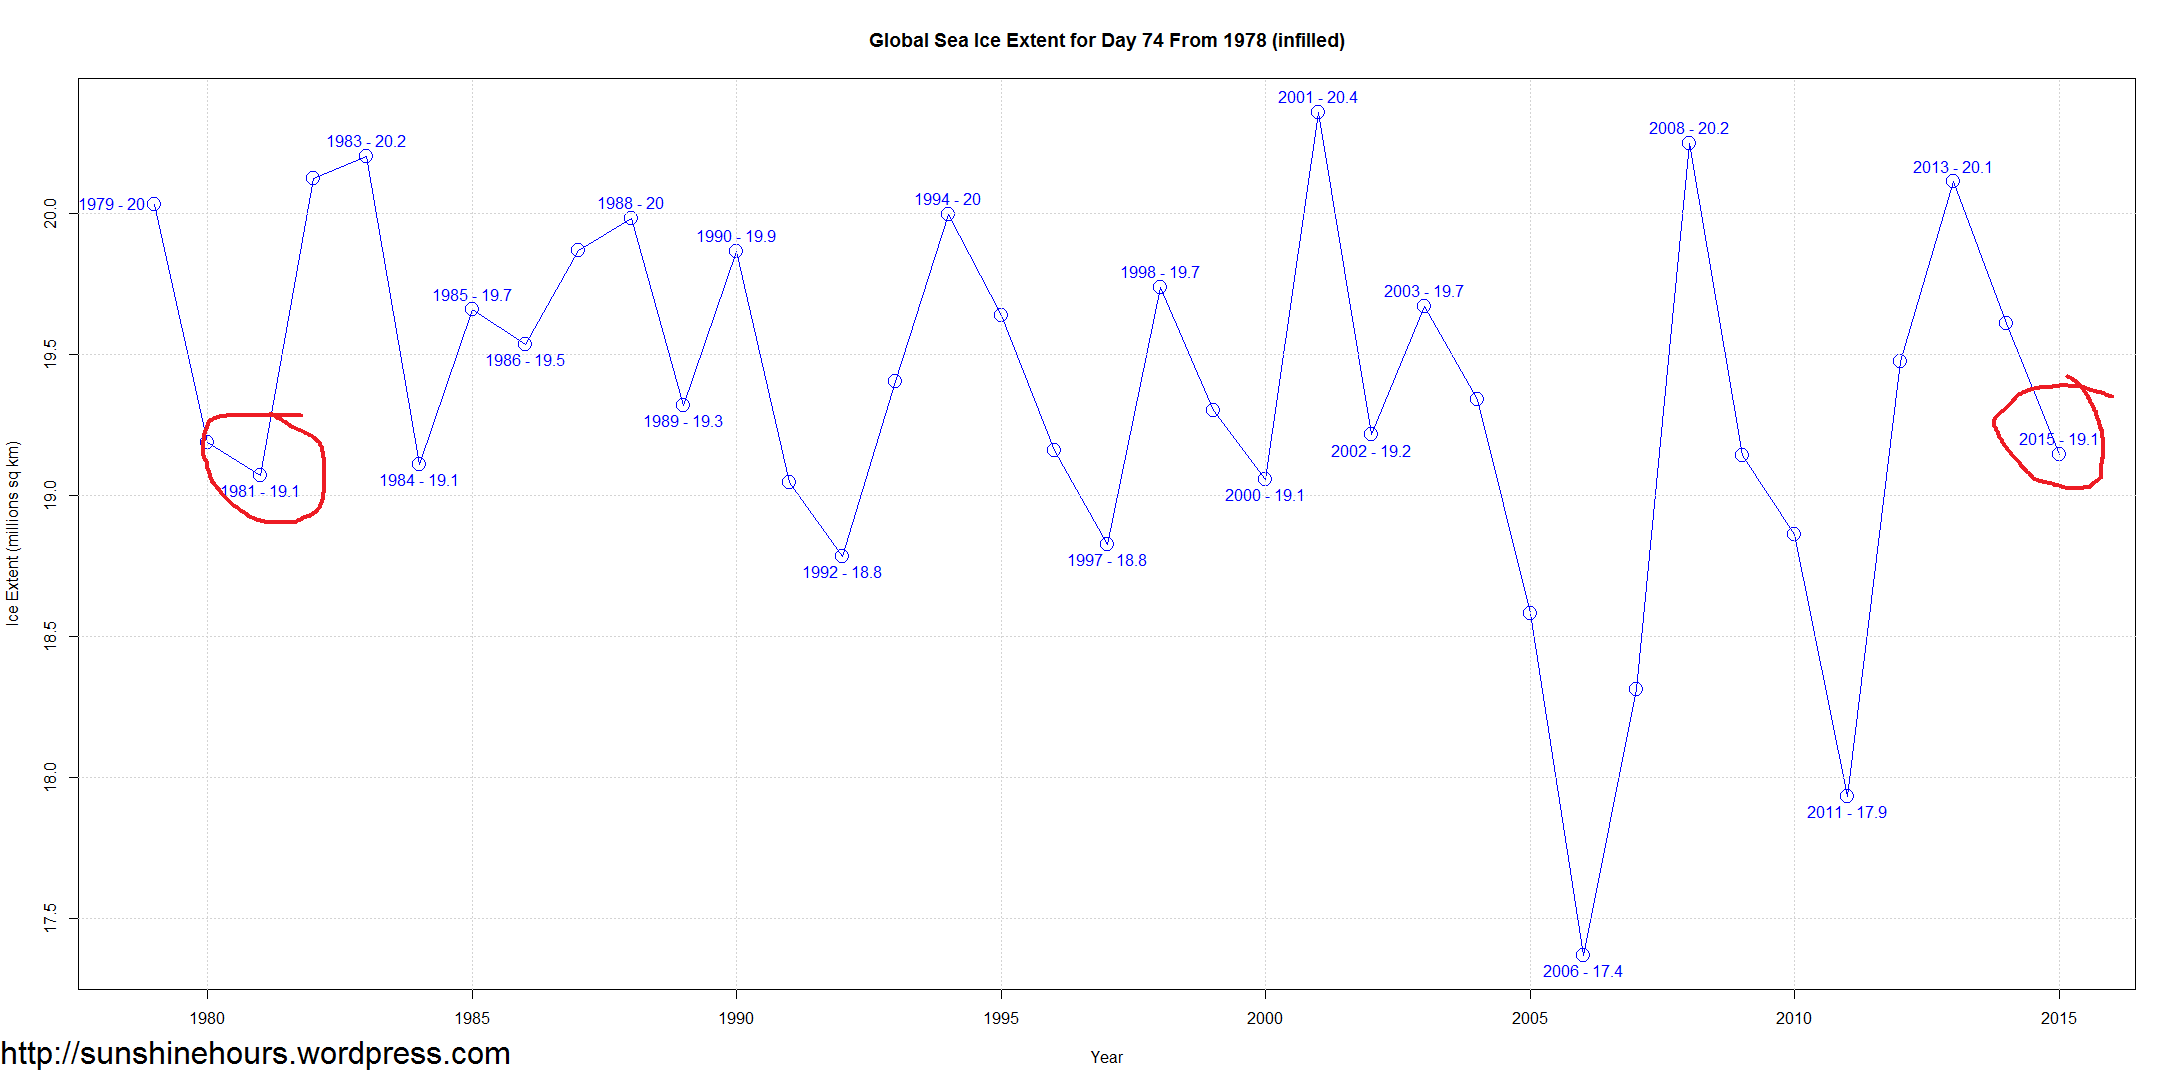
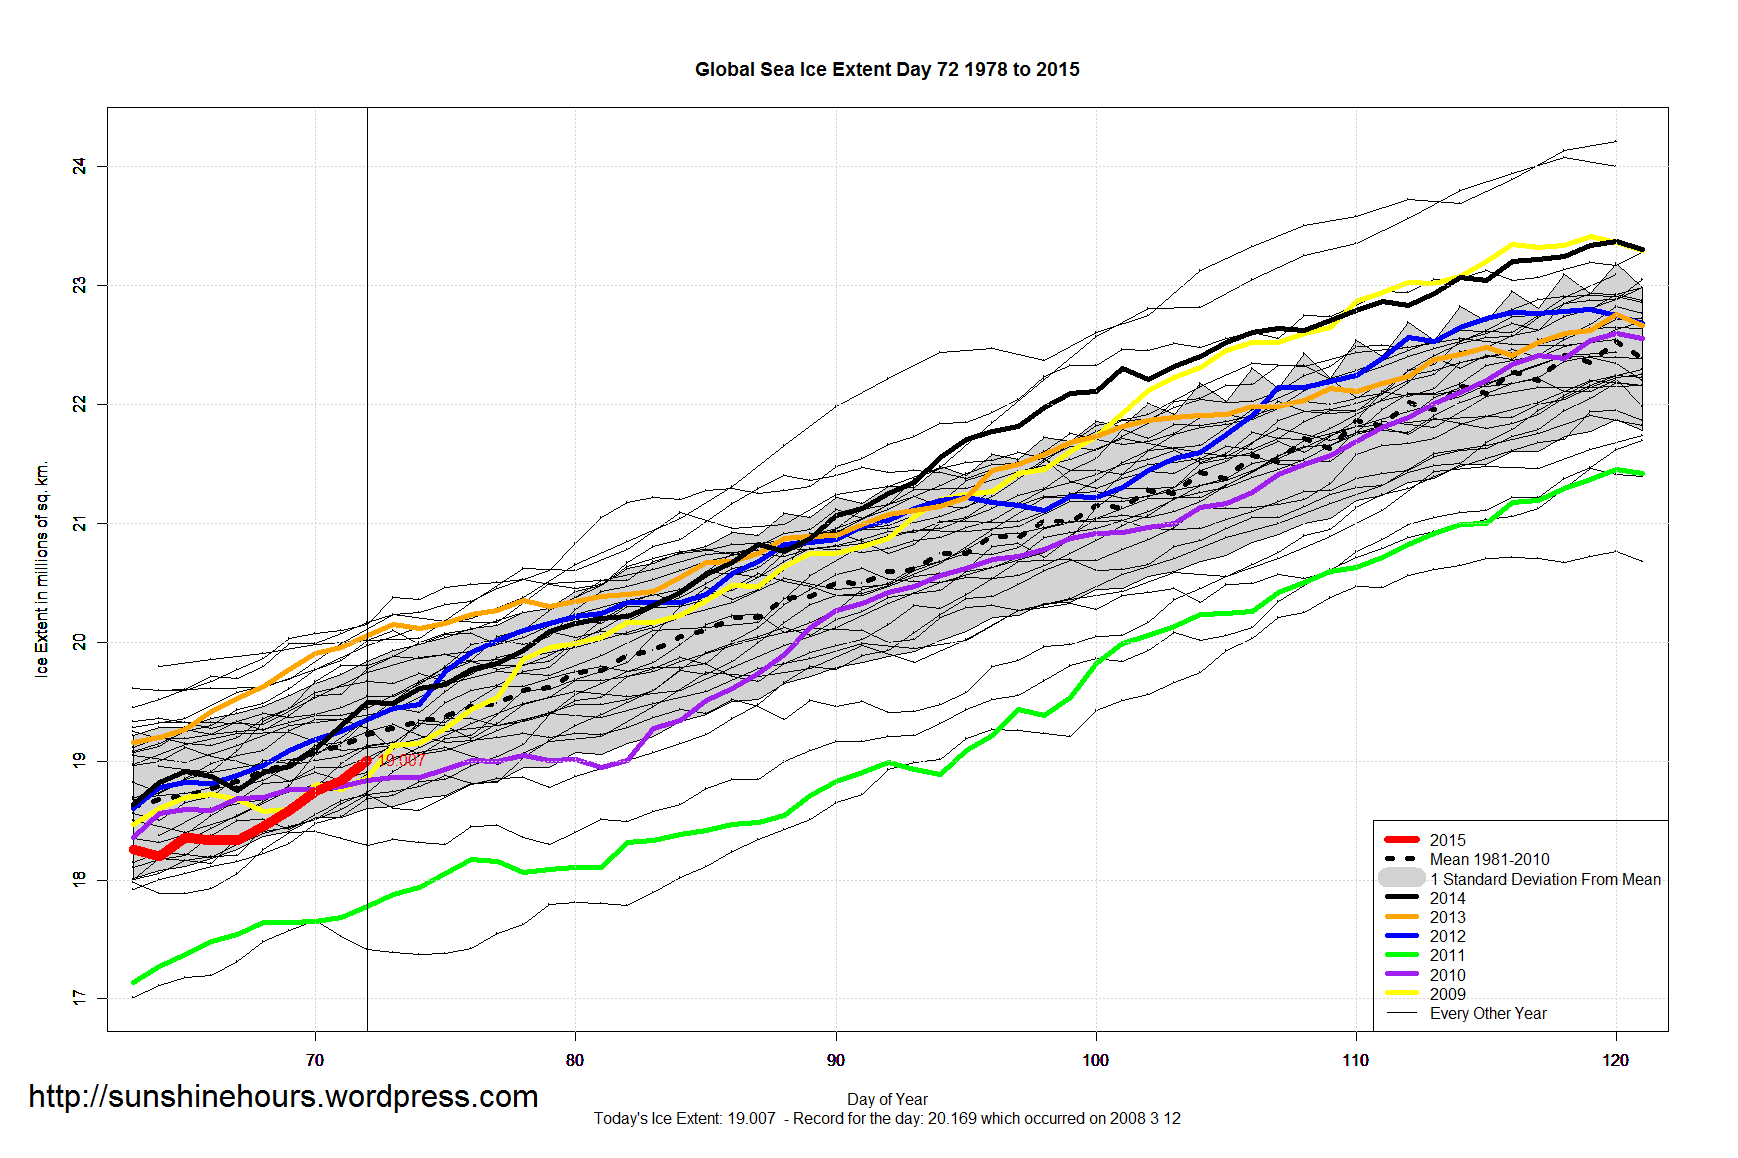
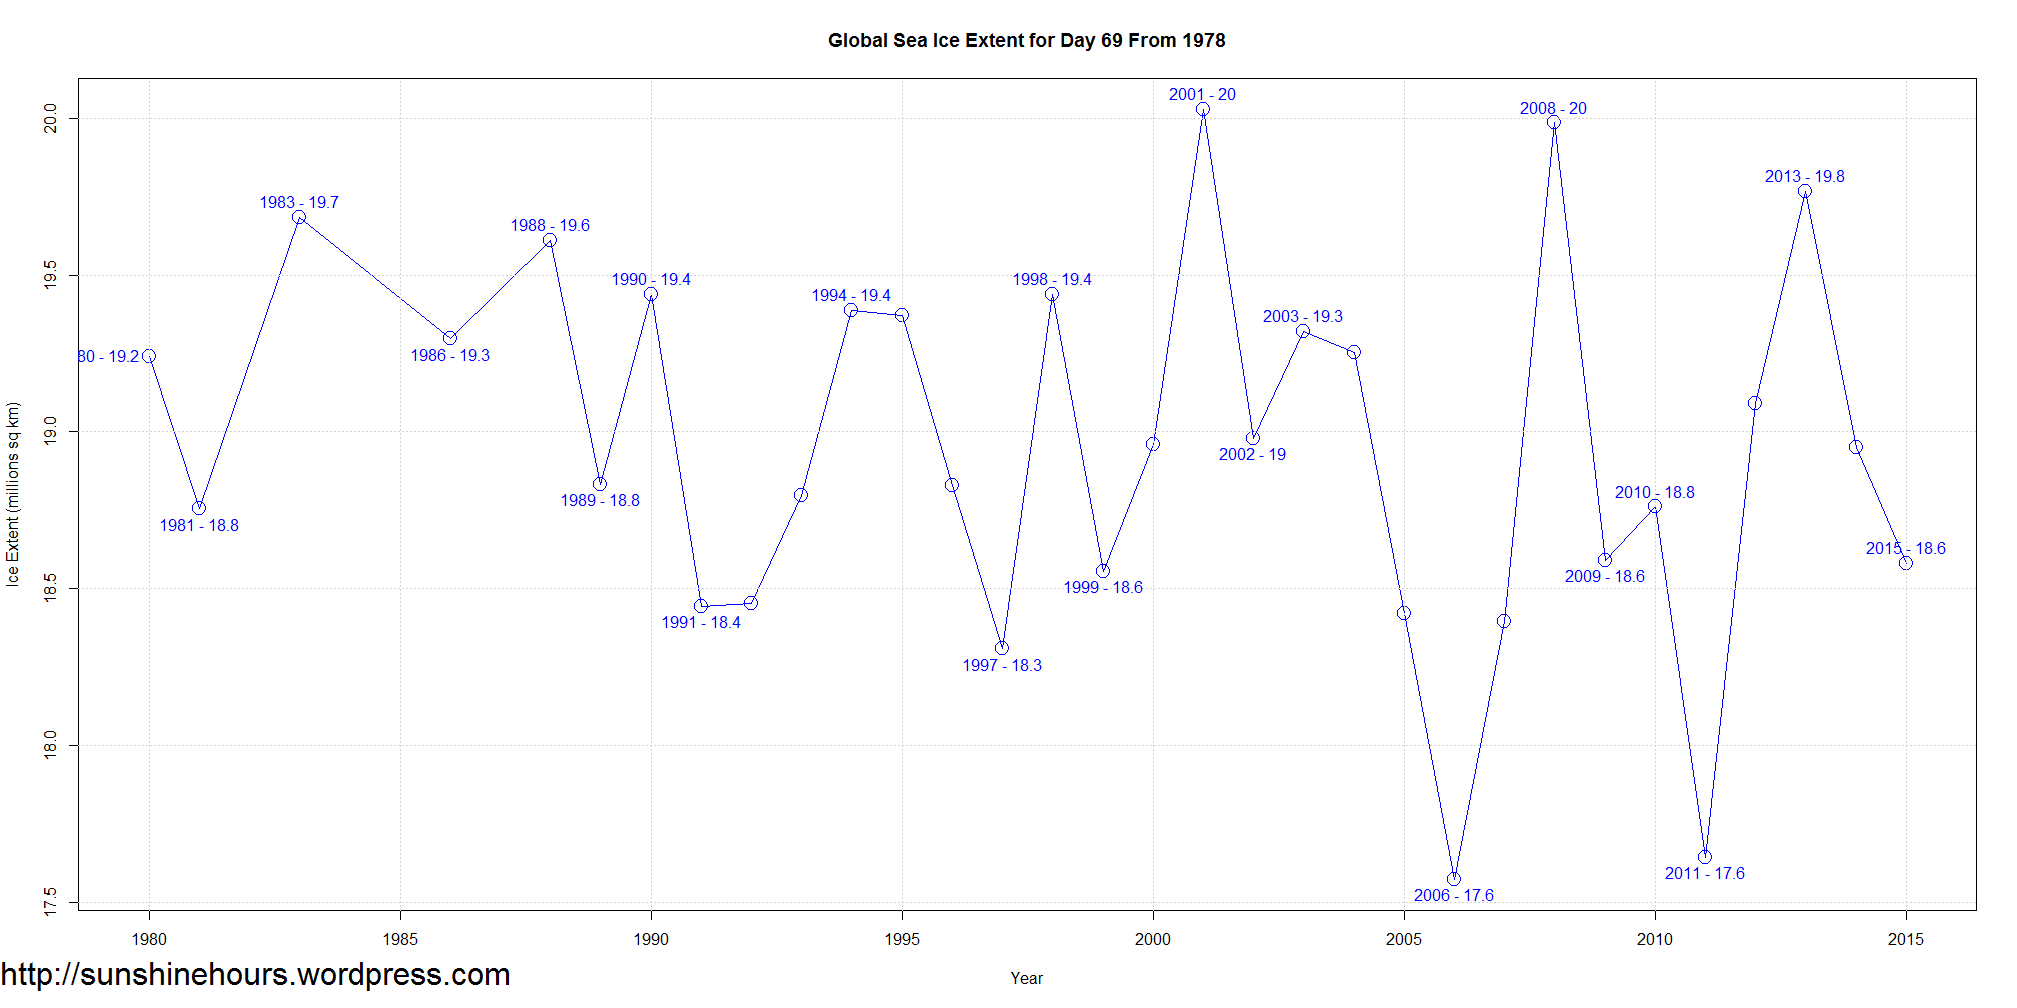
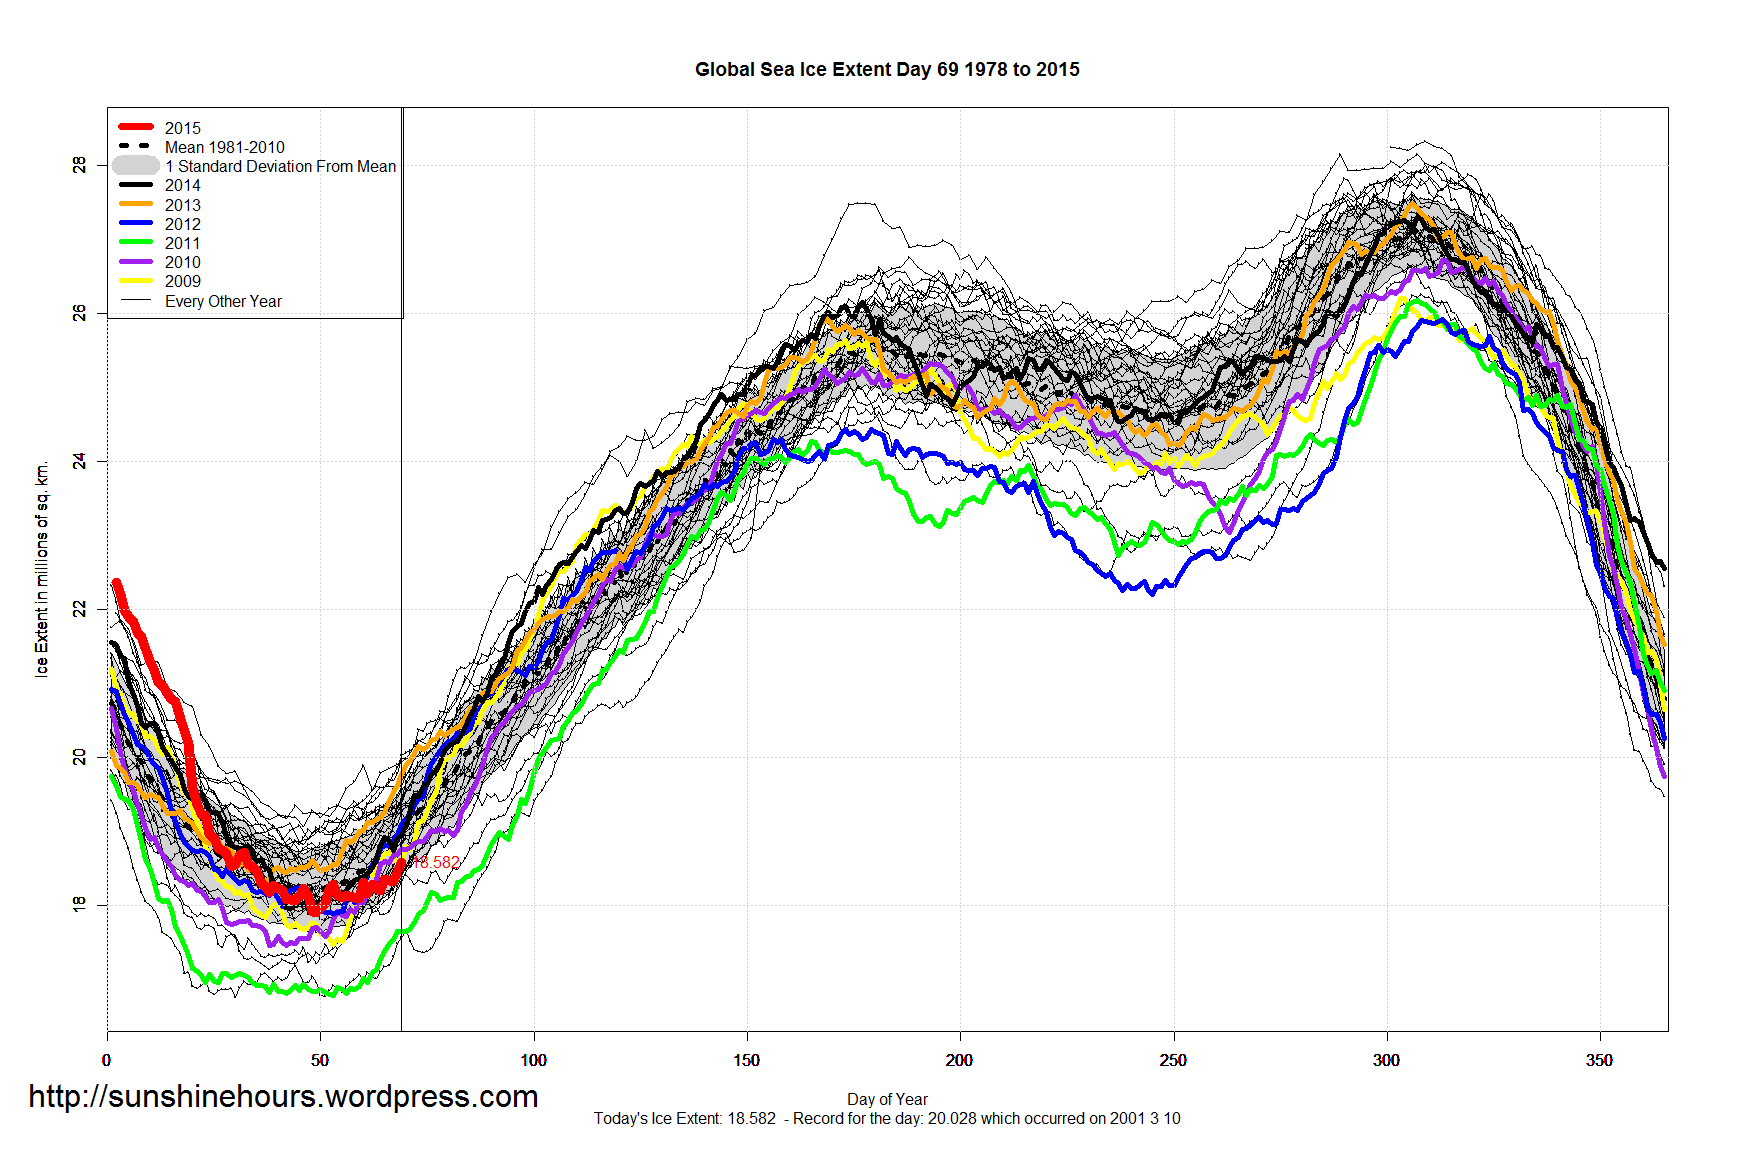
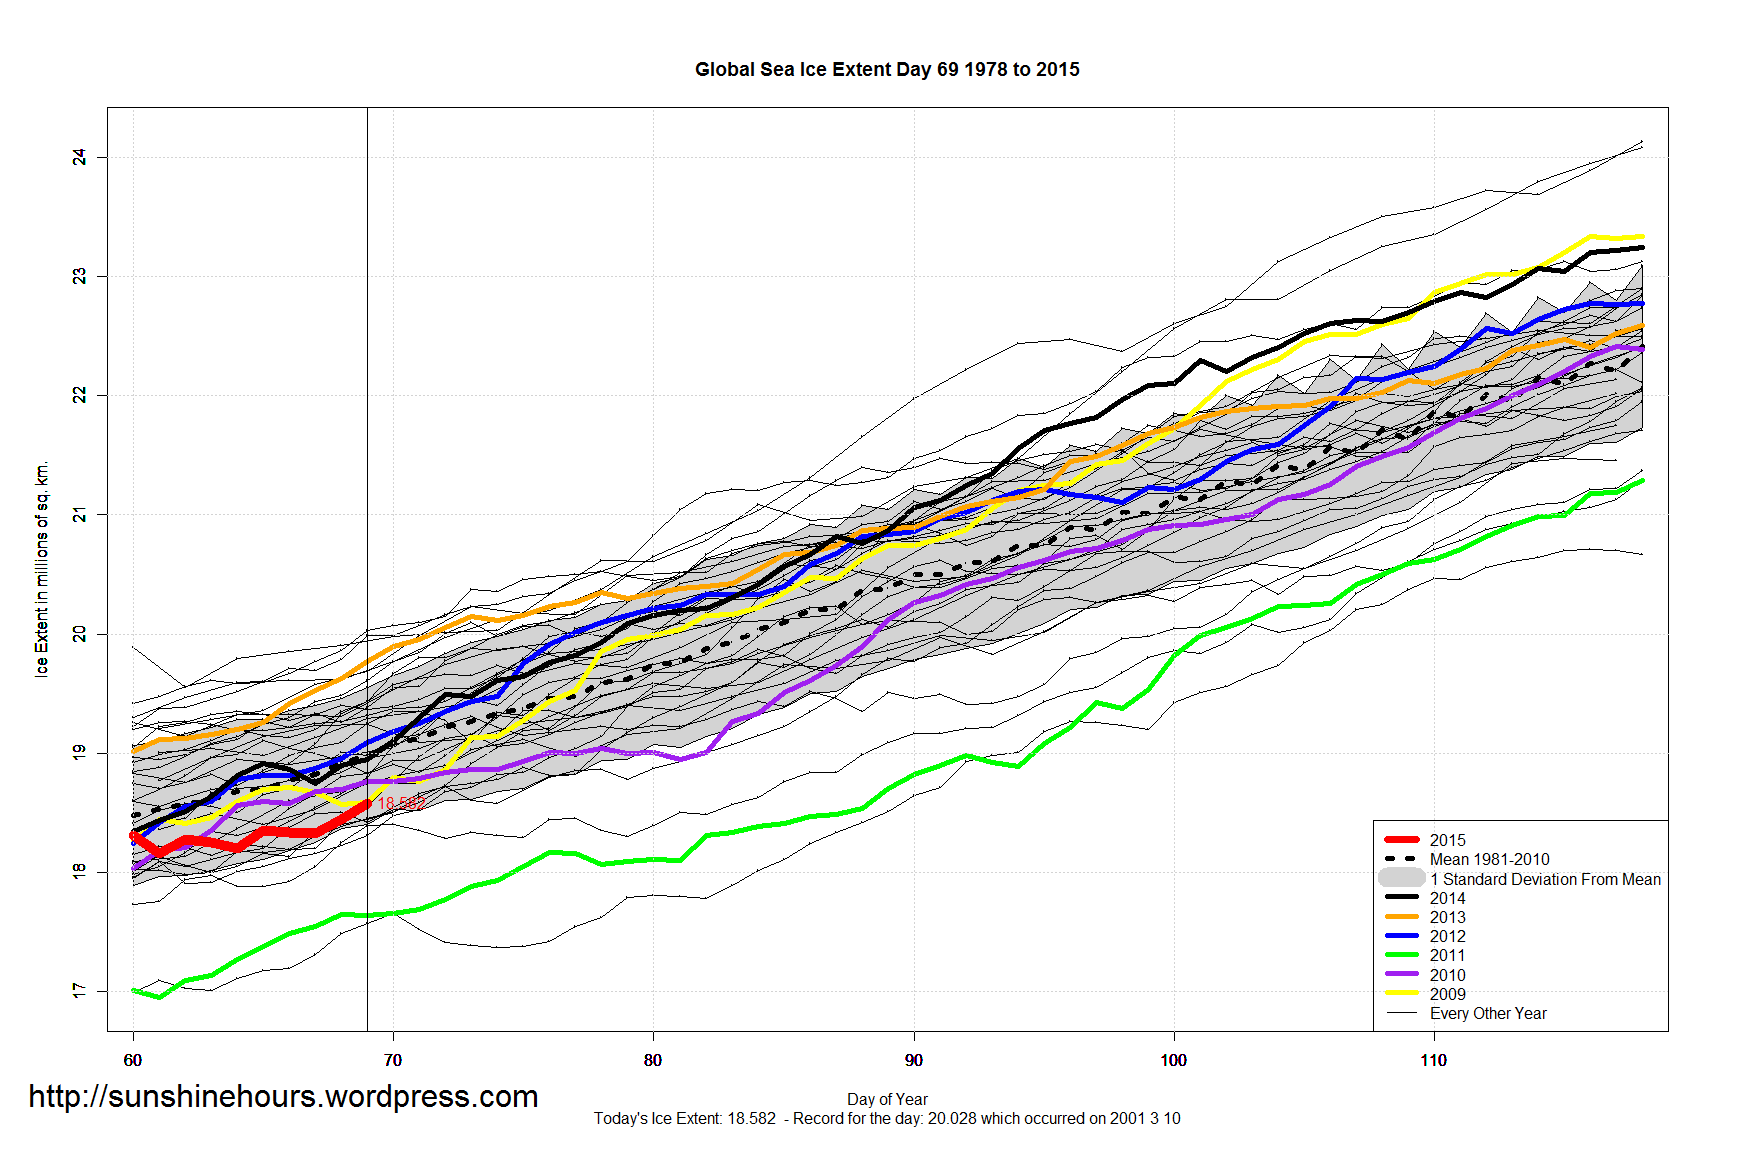
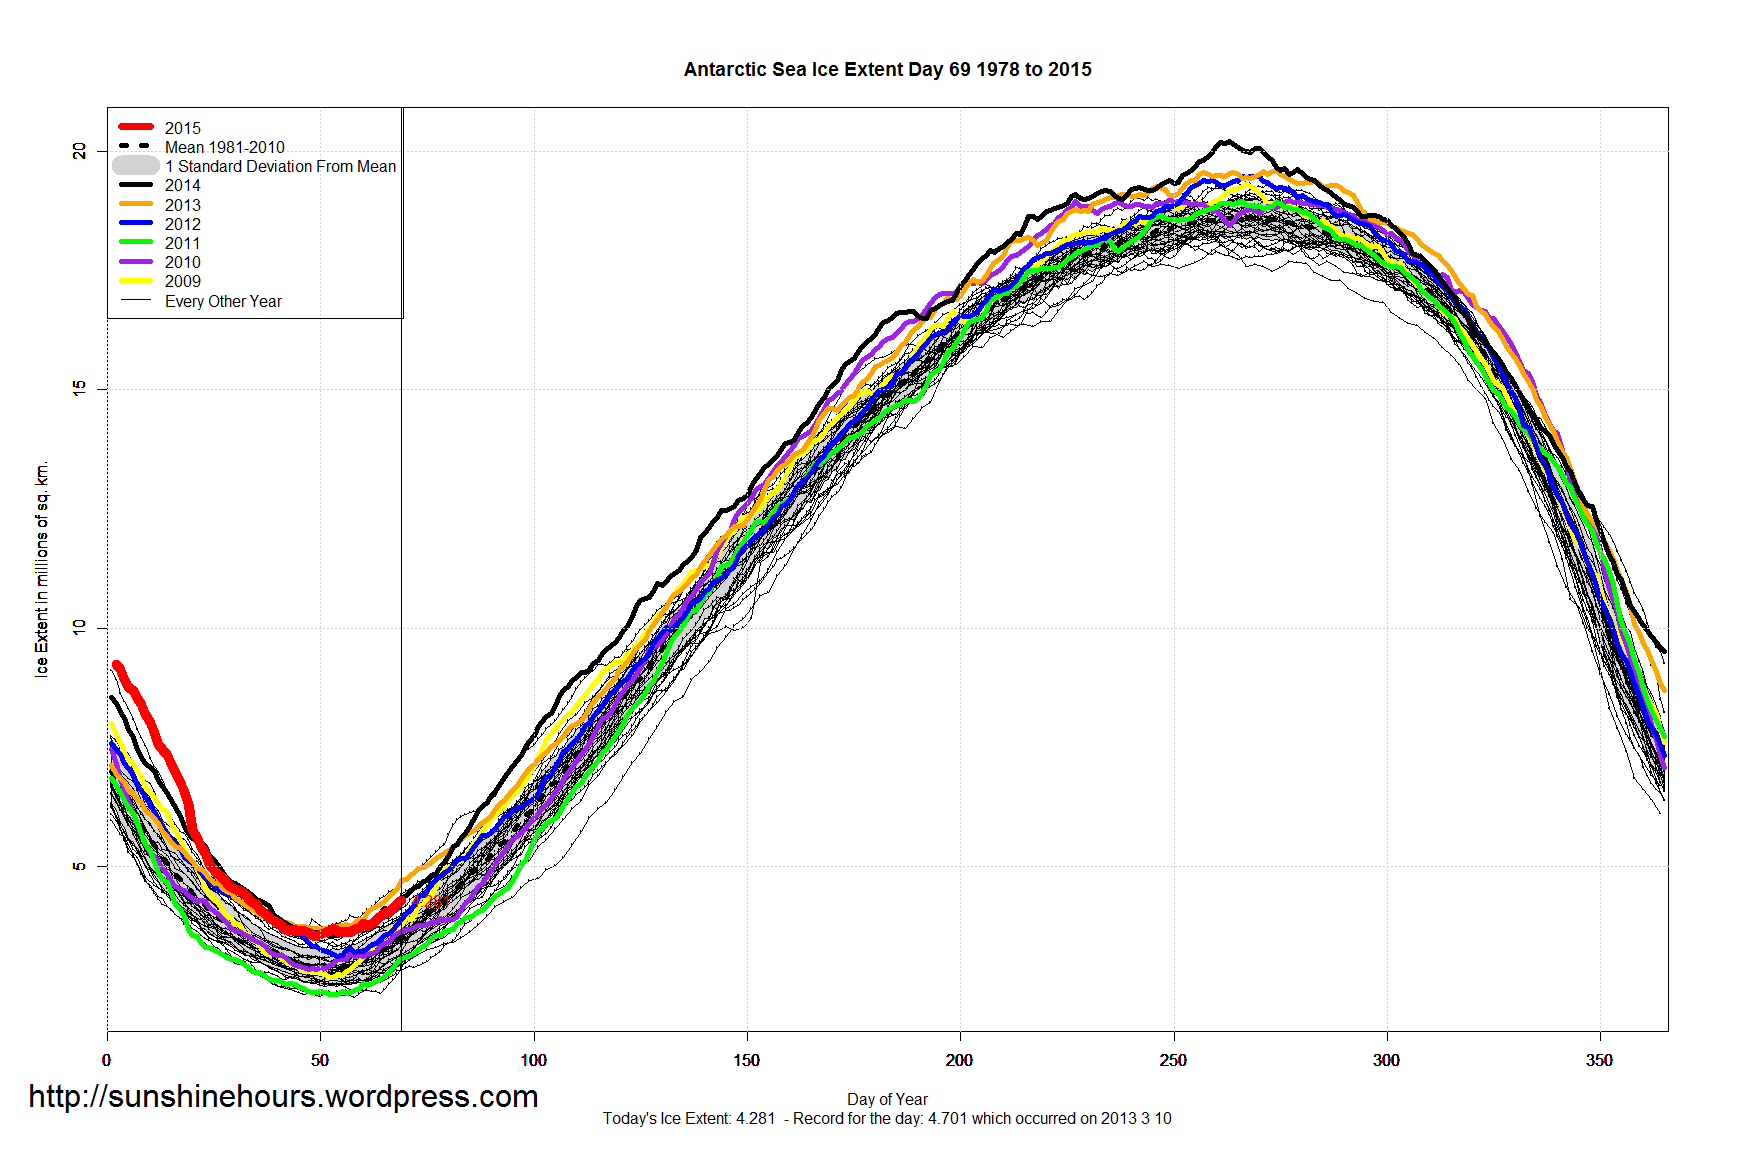
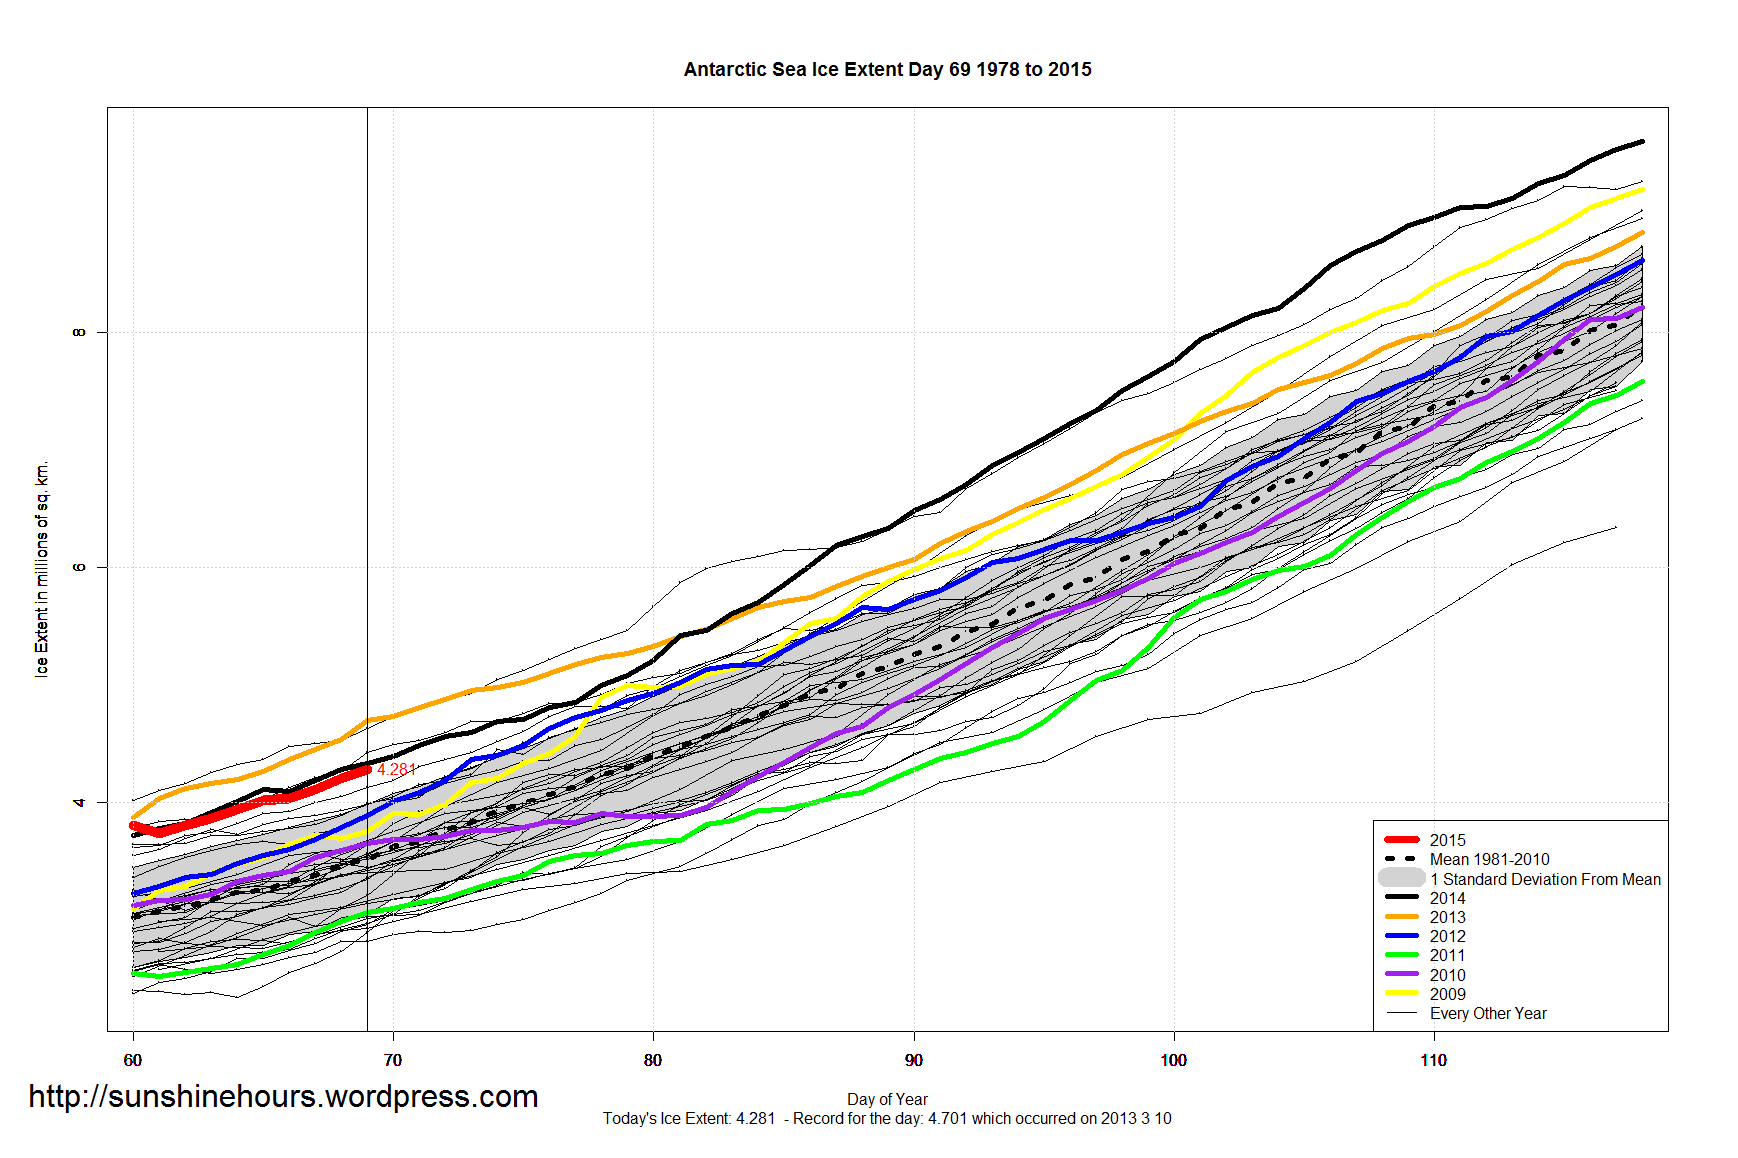
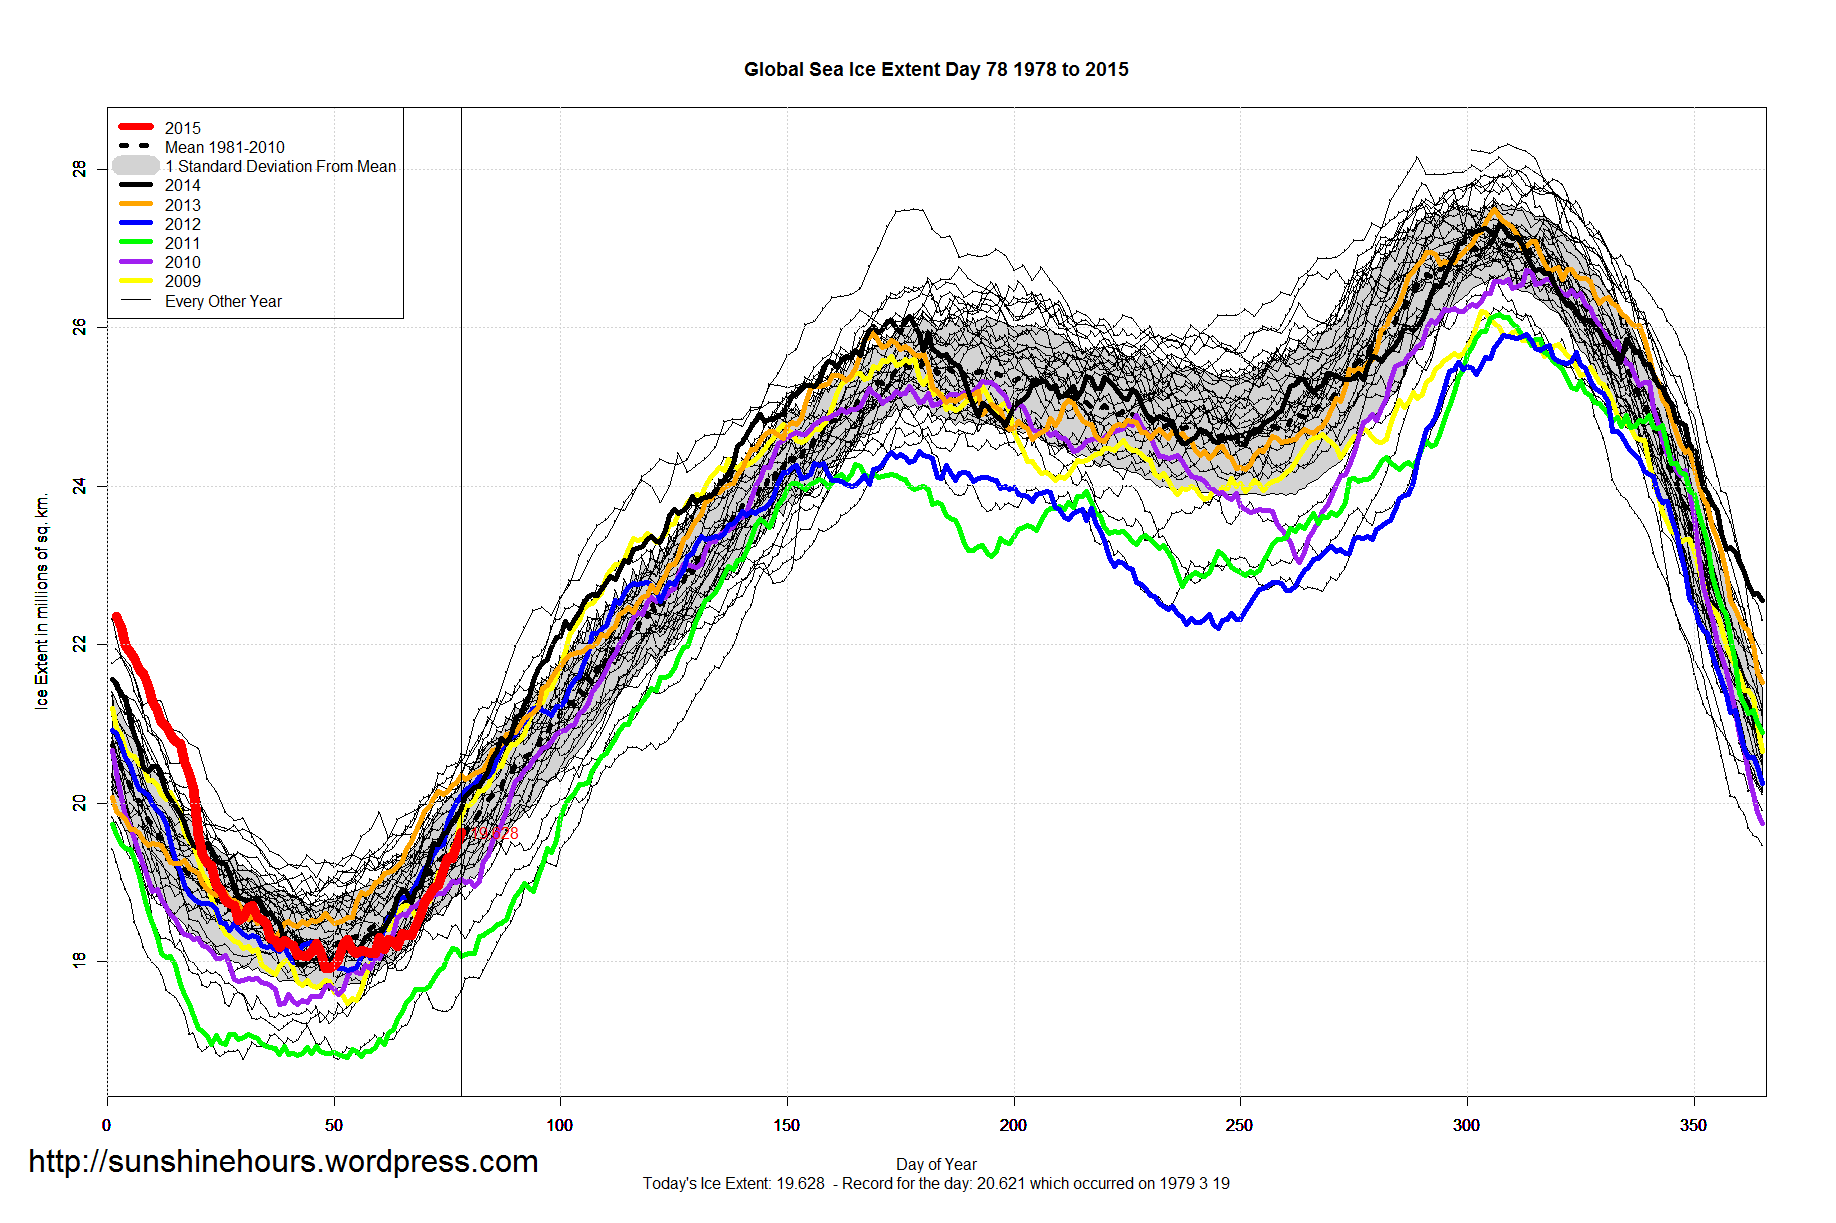
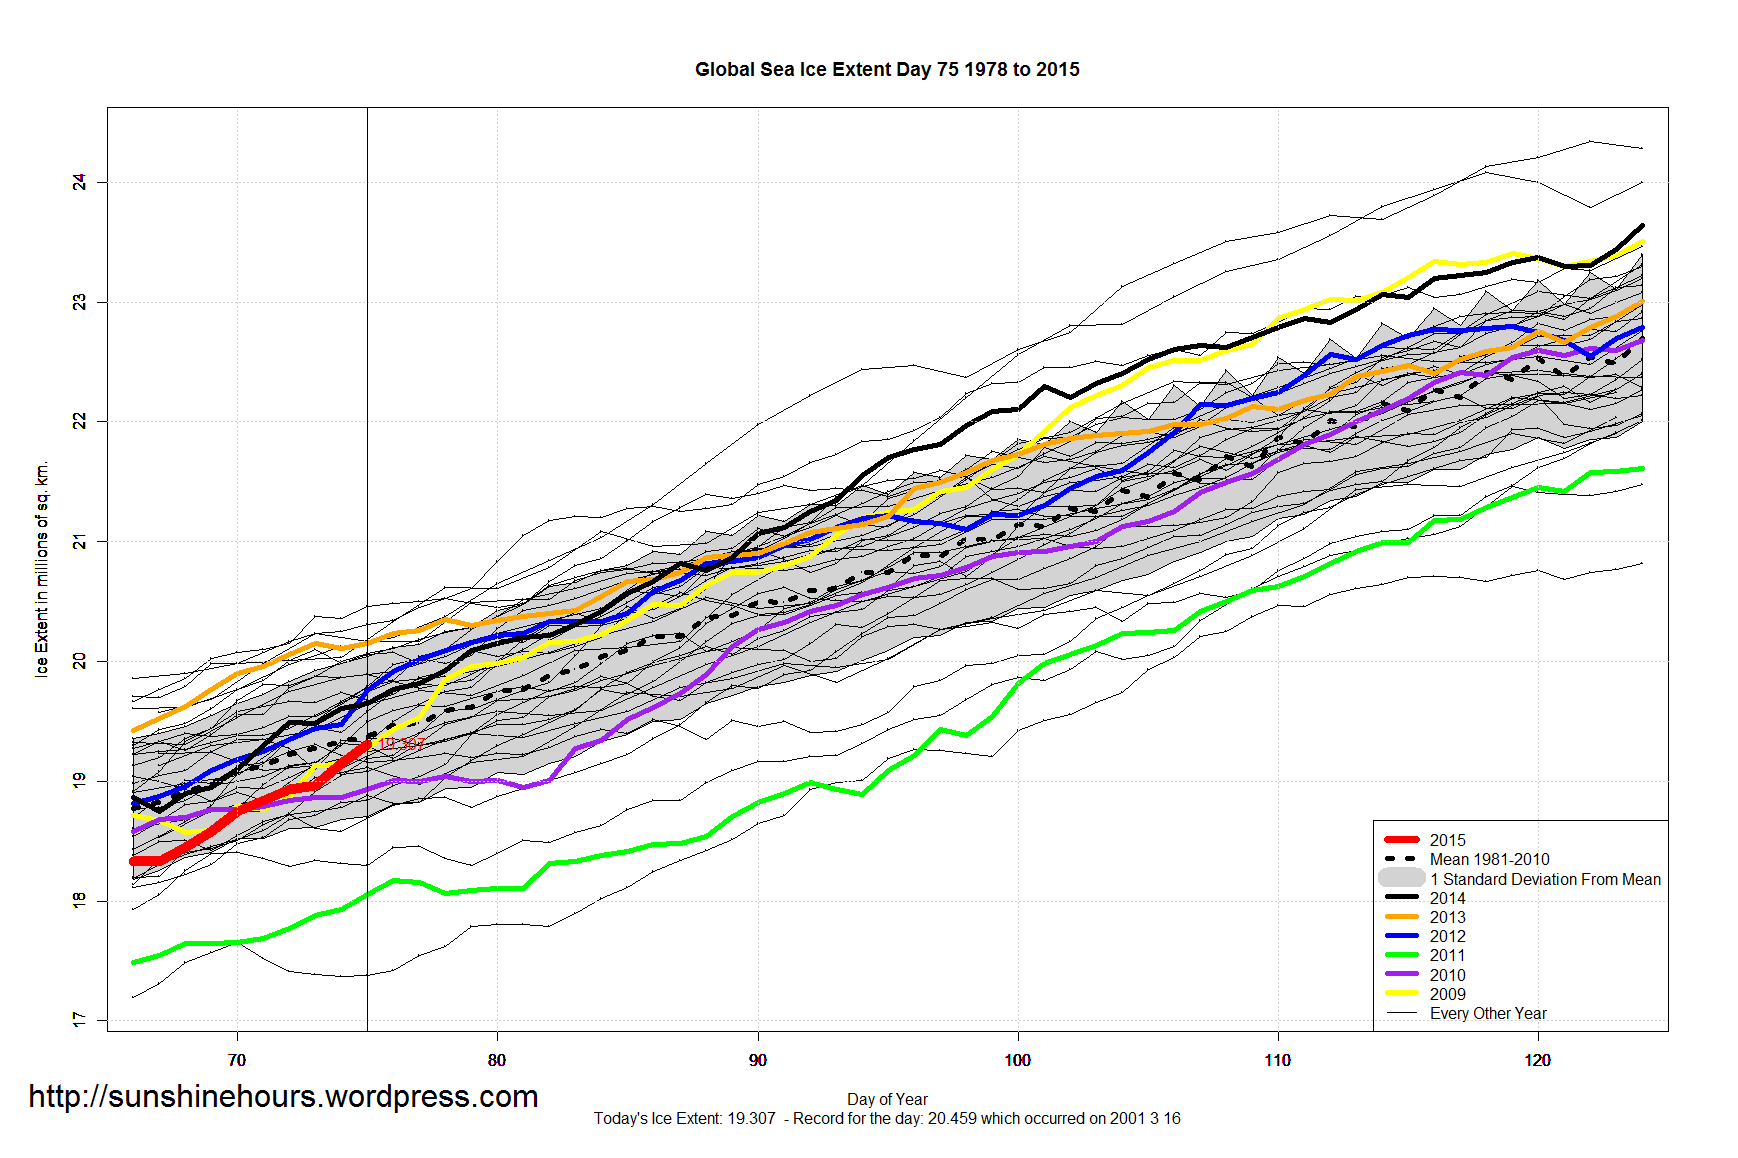
Global Sea Ice ‘Normal’ – 500,000 sq km higher than 1981 and 2,000,000 sq km above 2006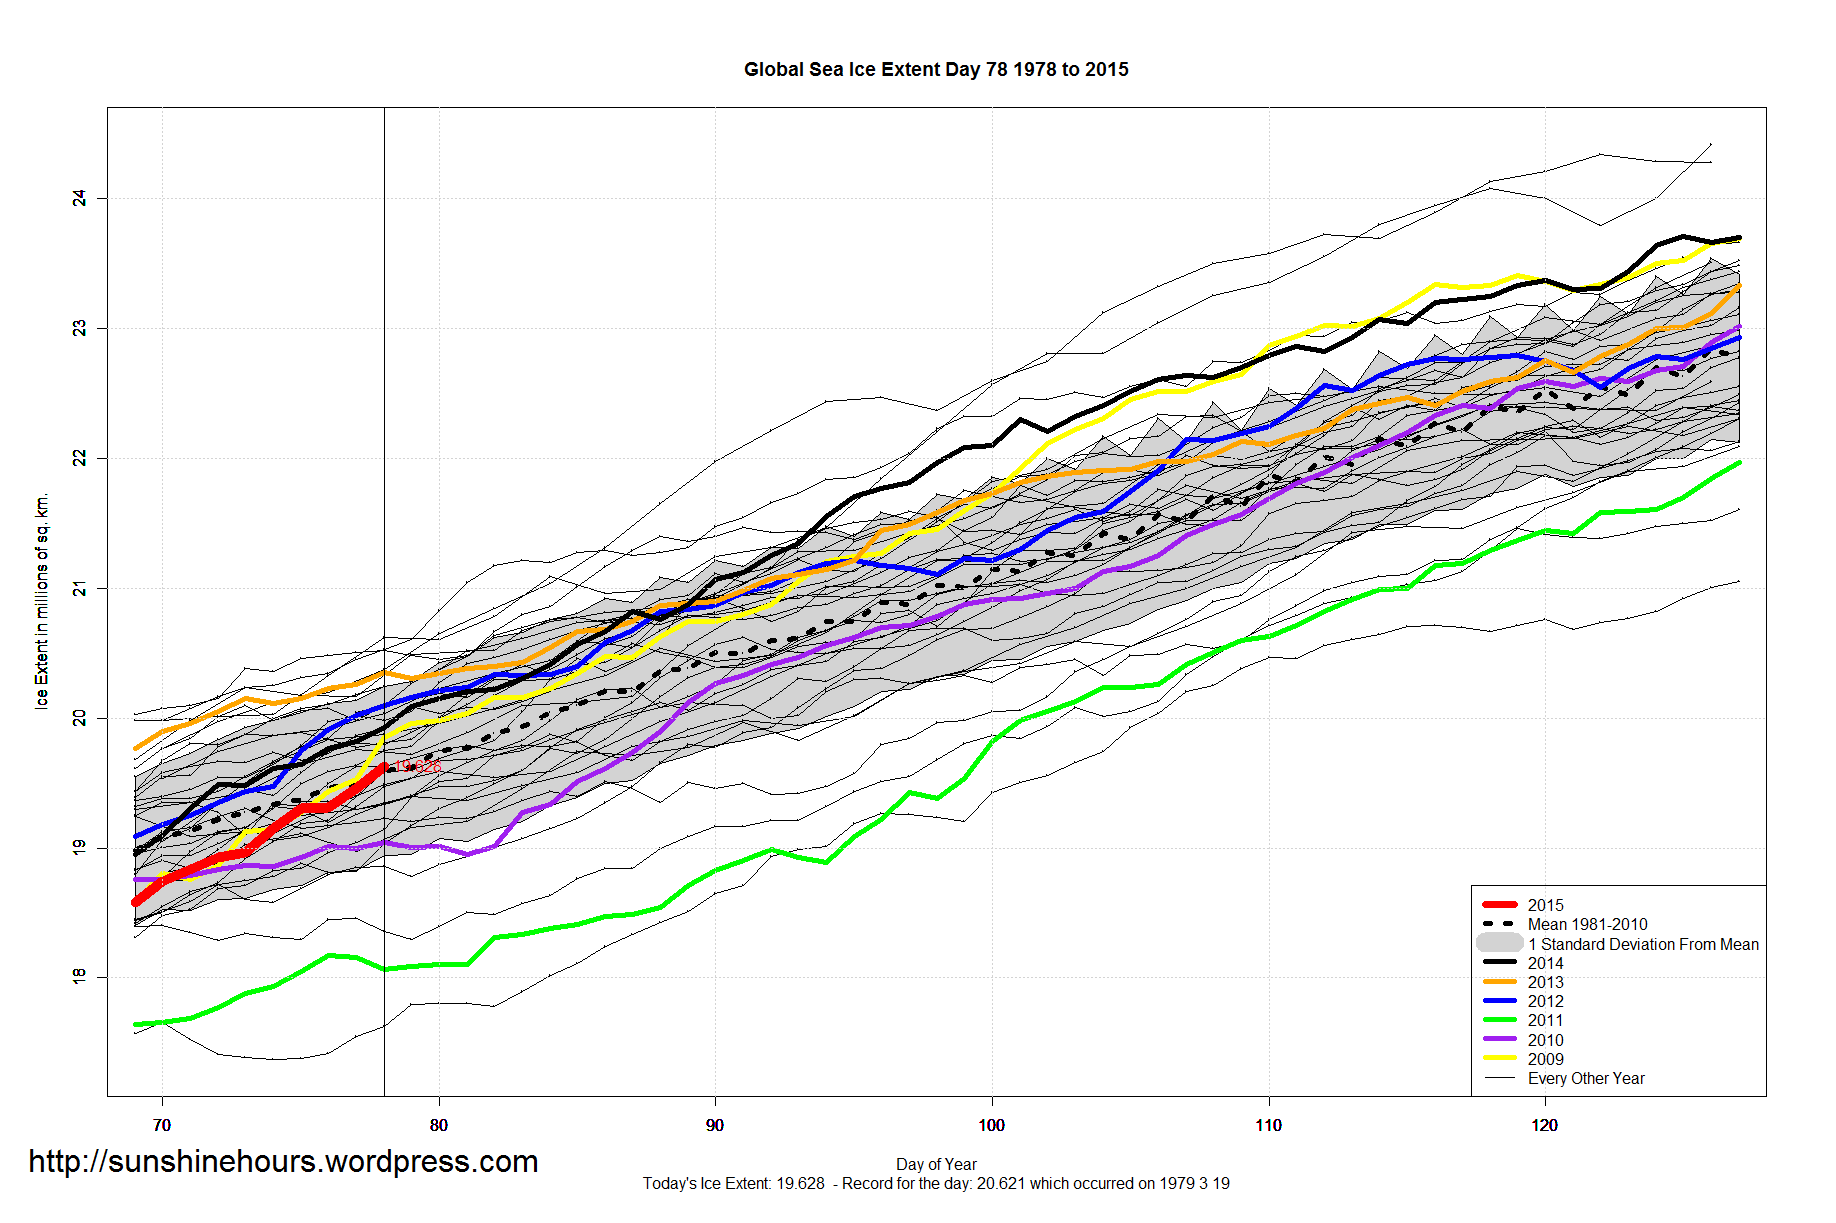

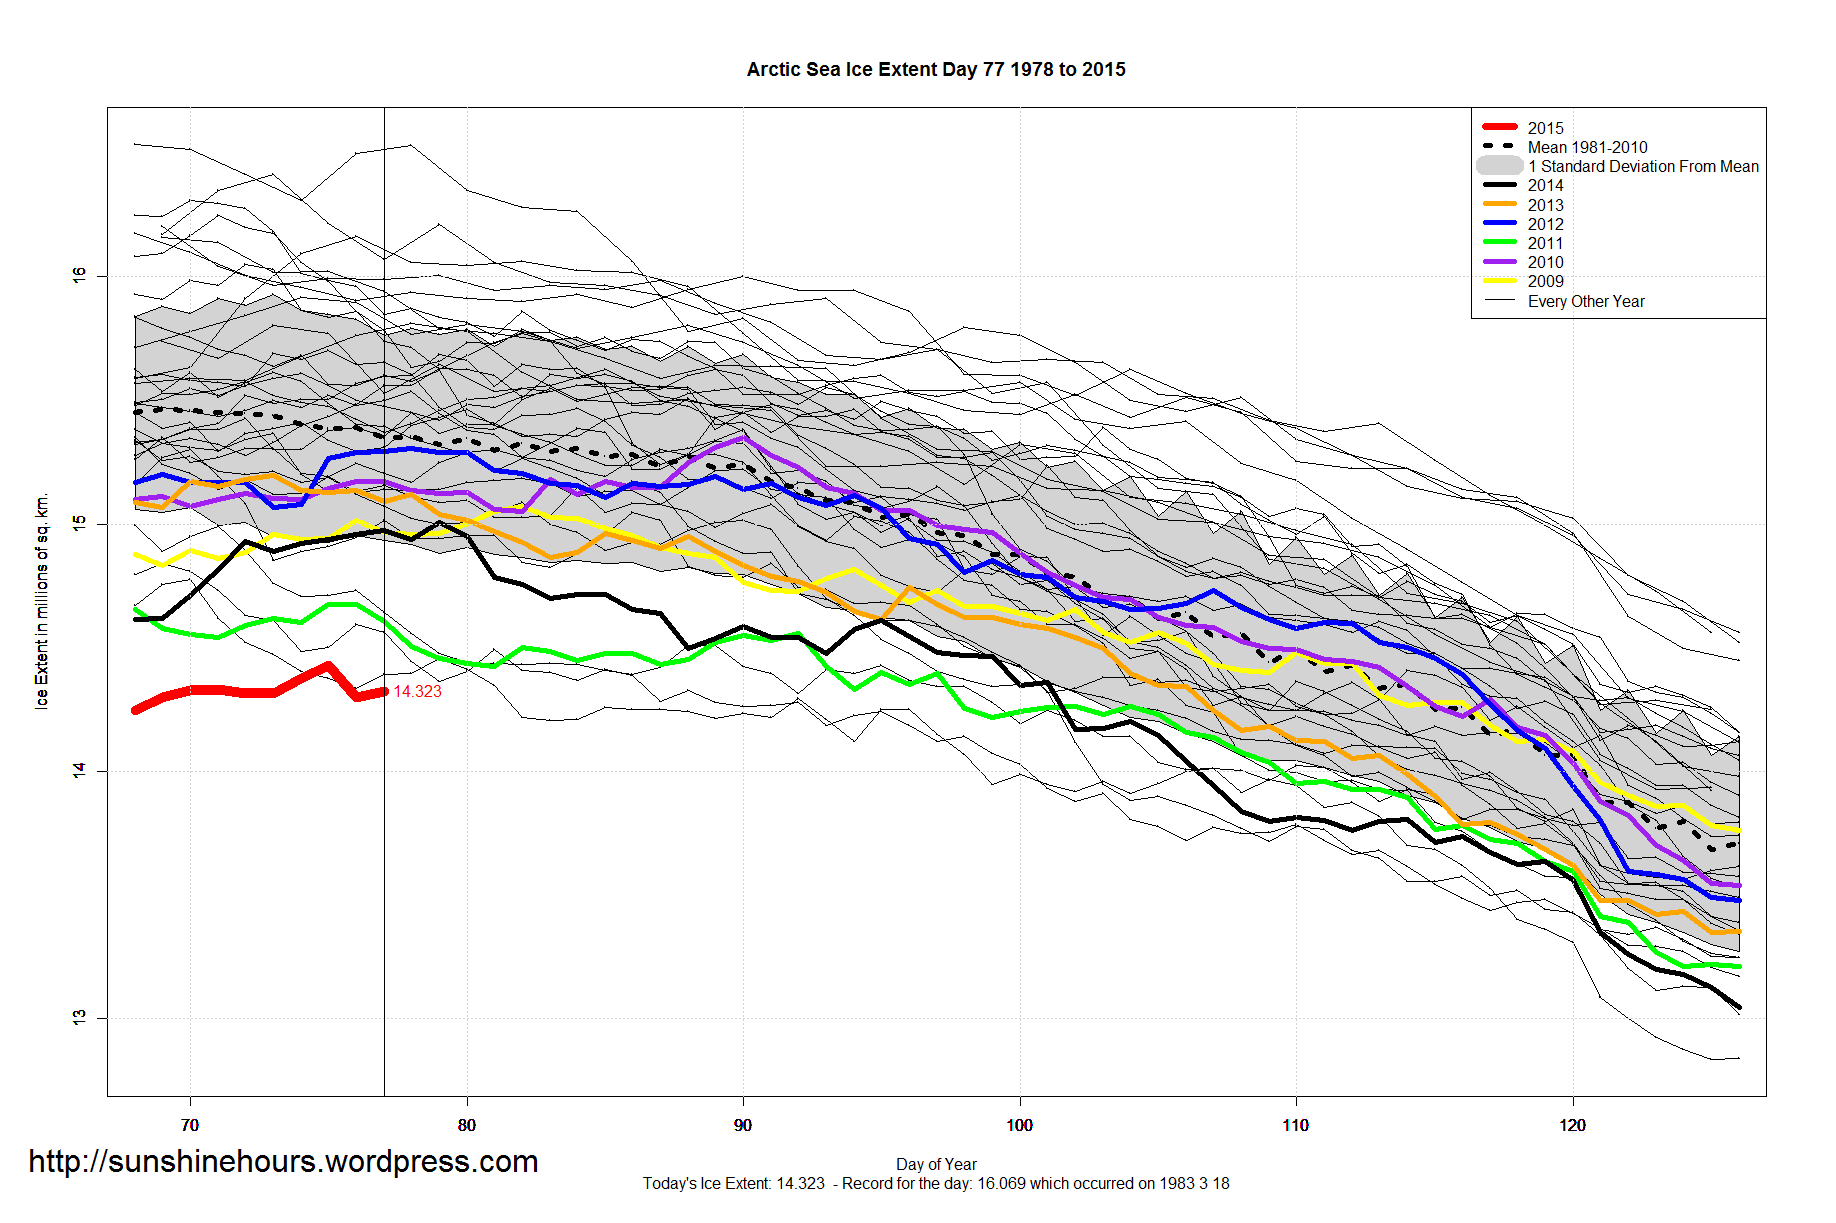
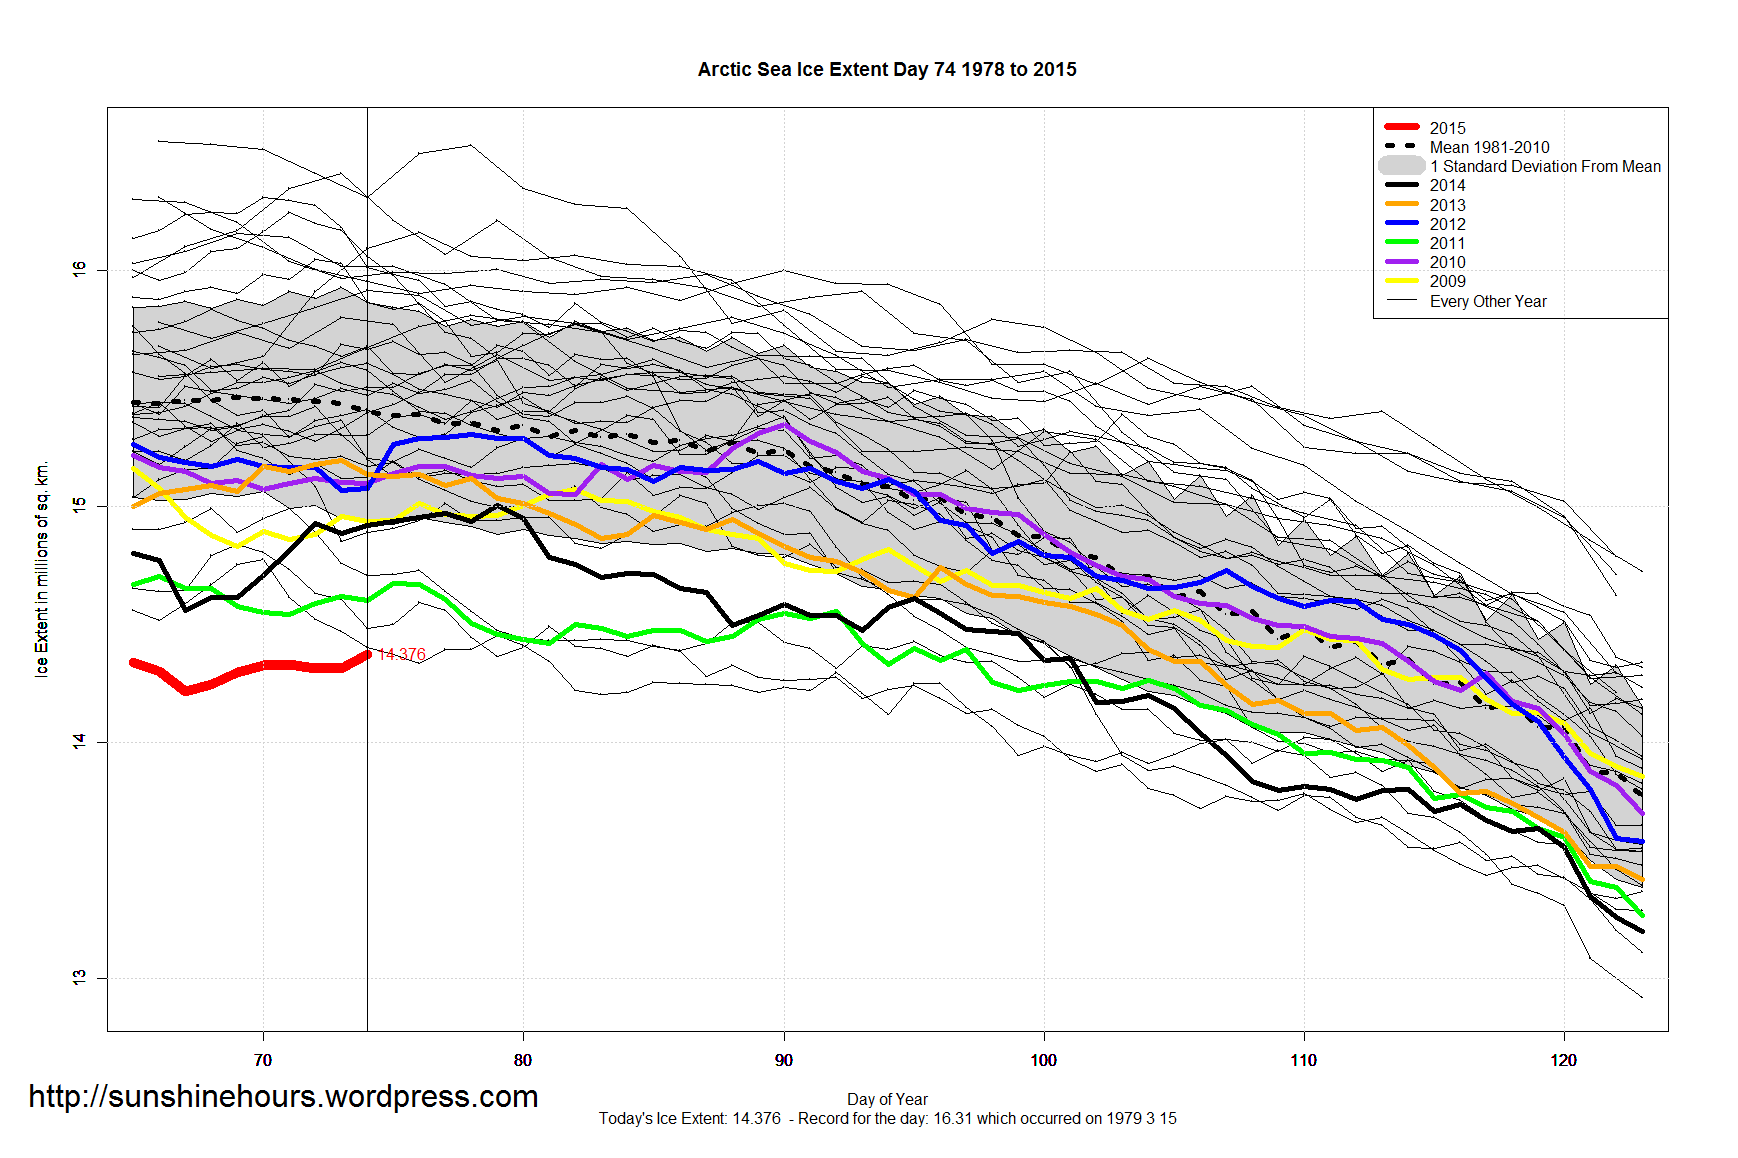
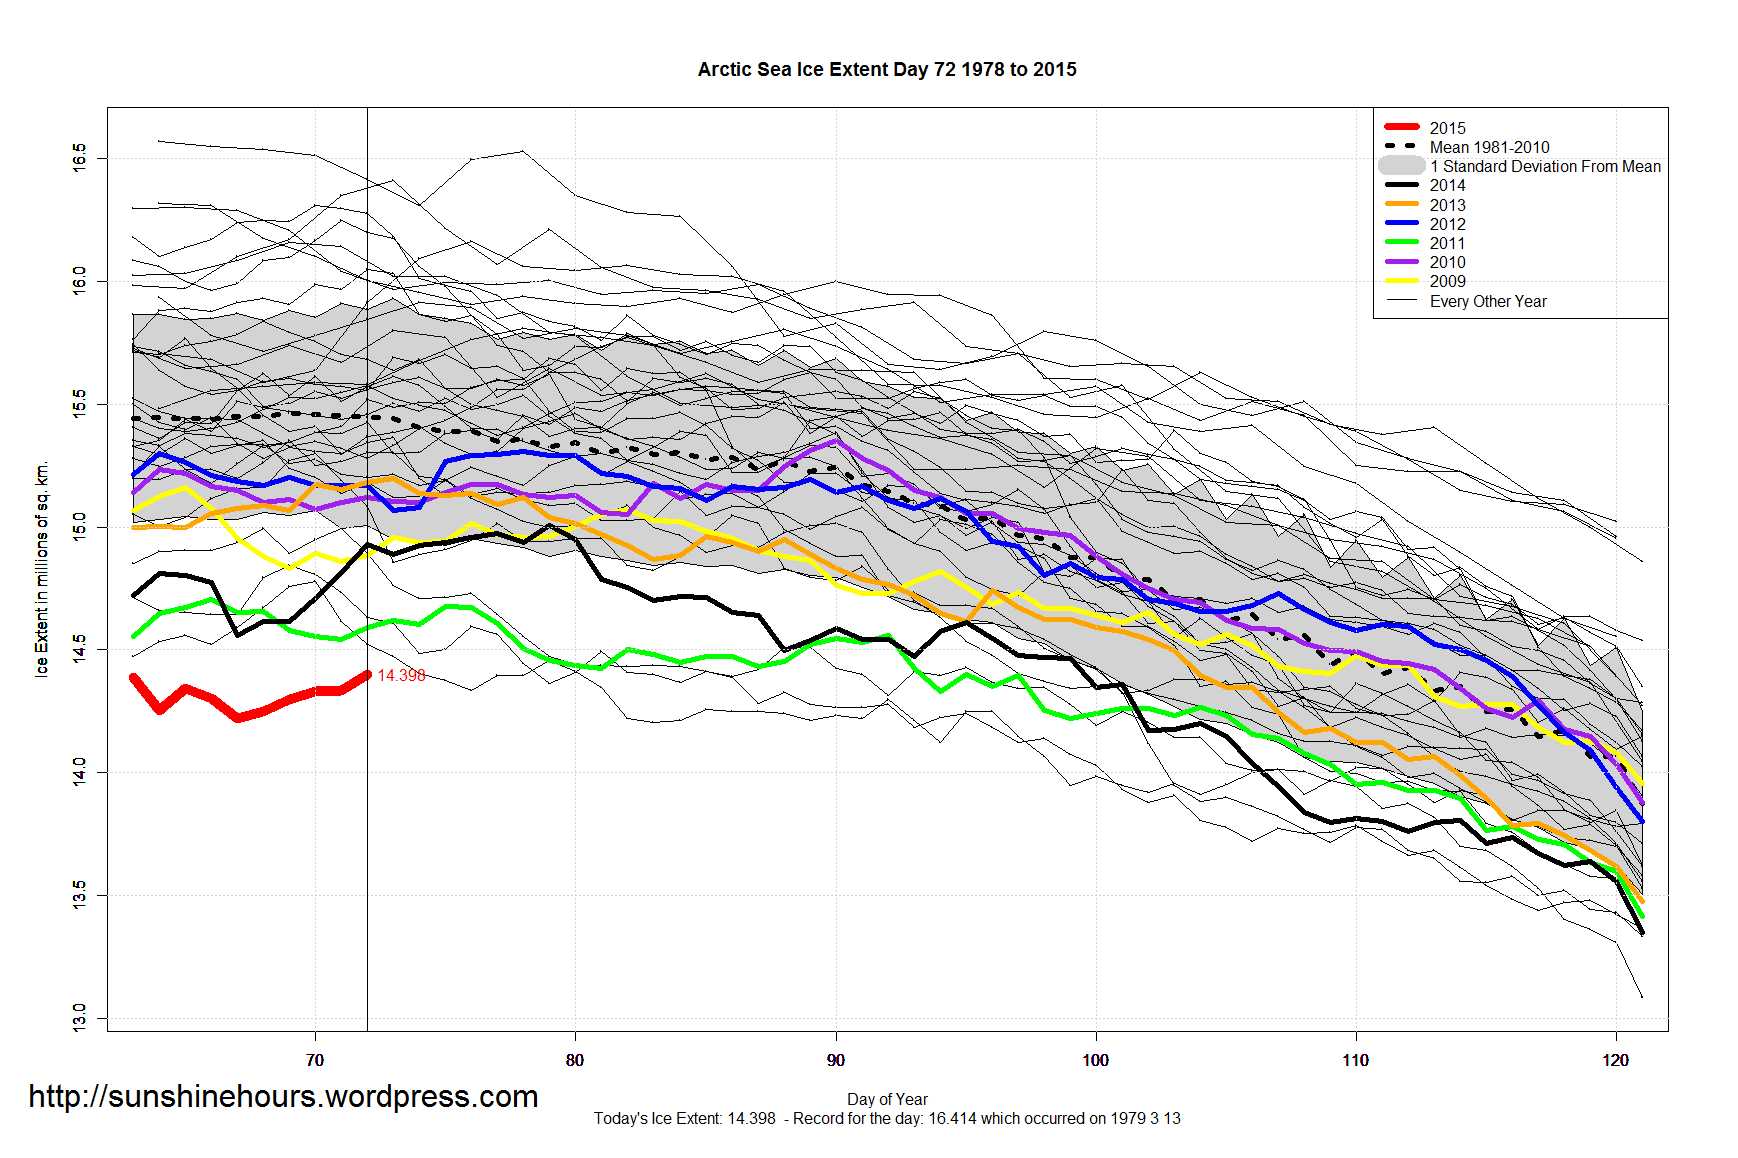
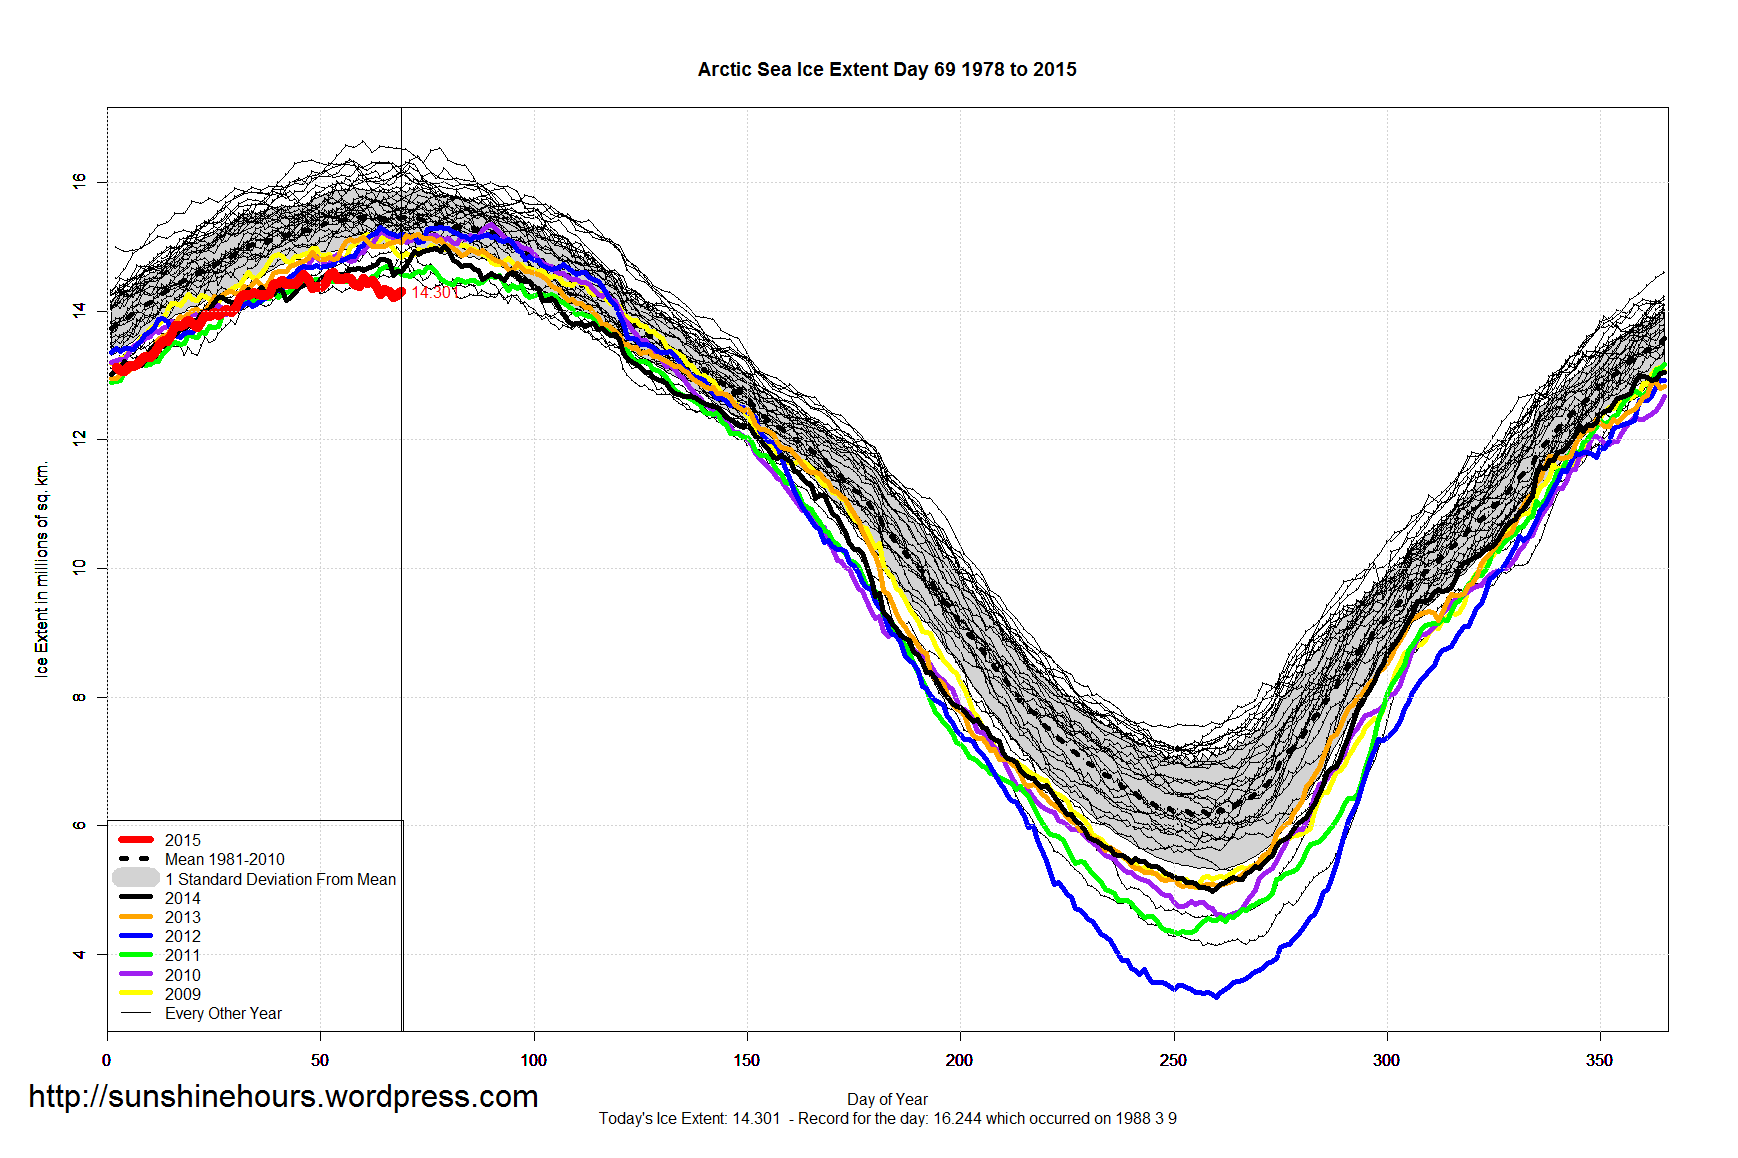
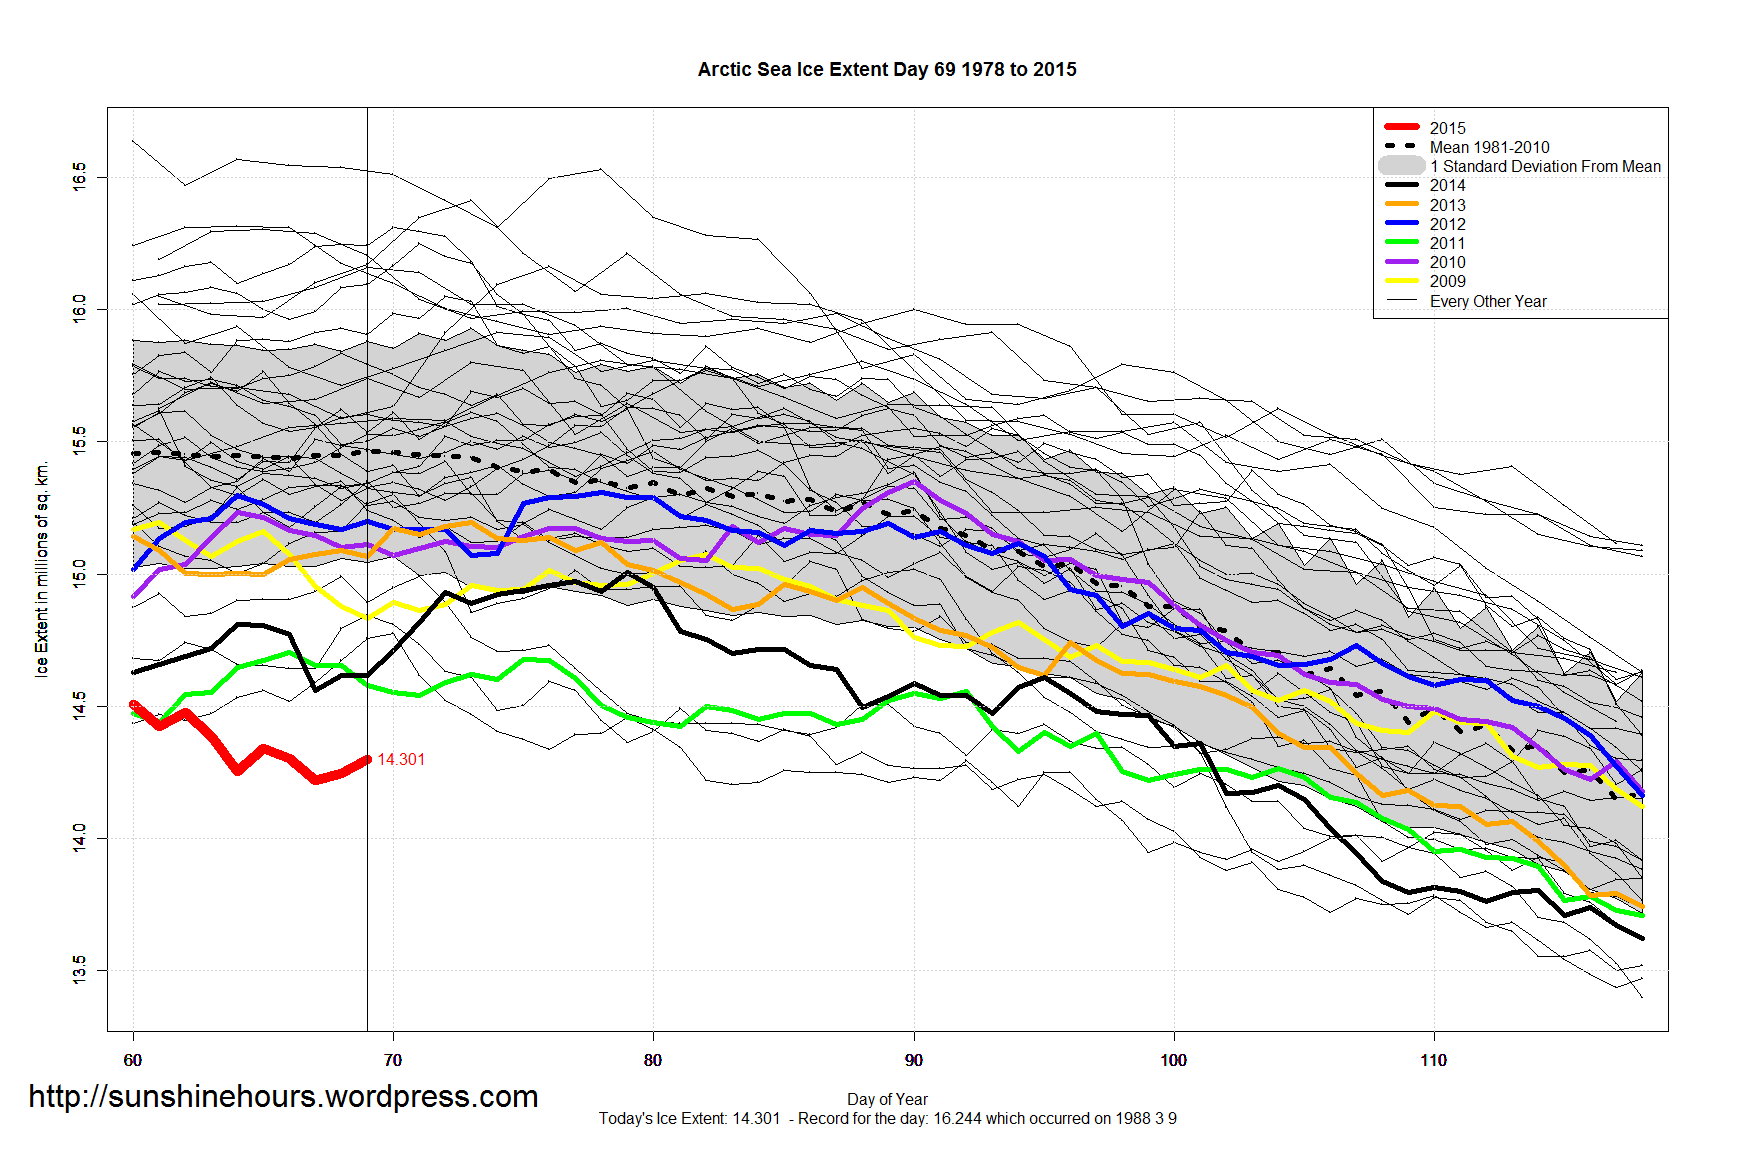
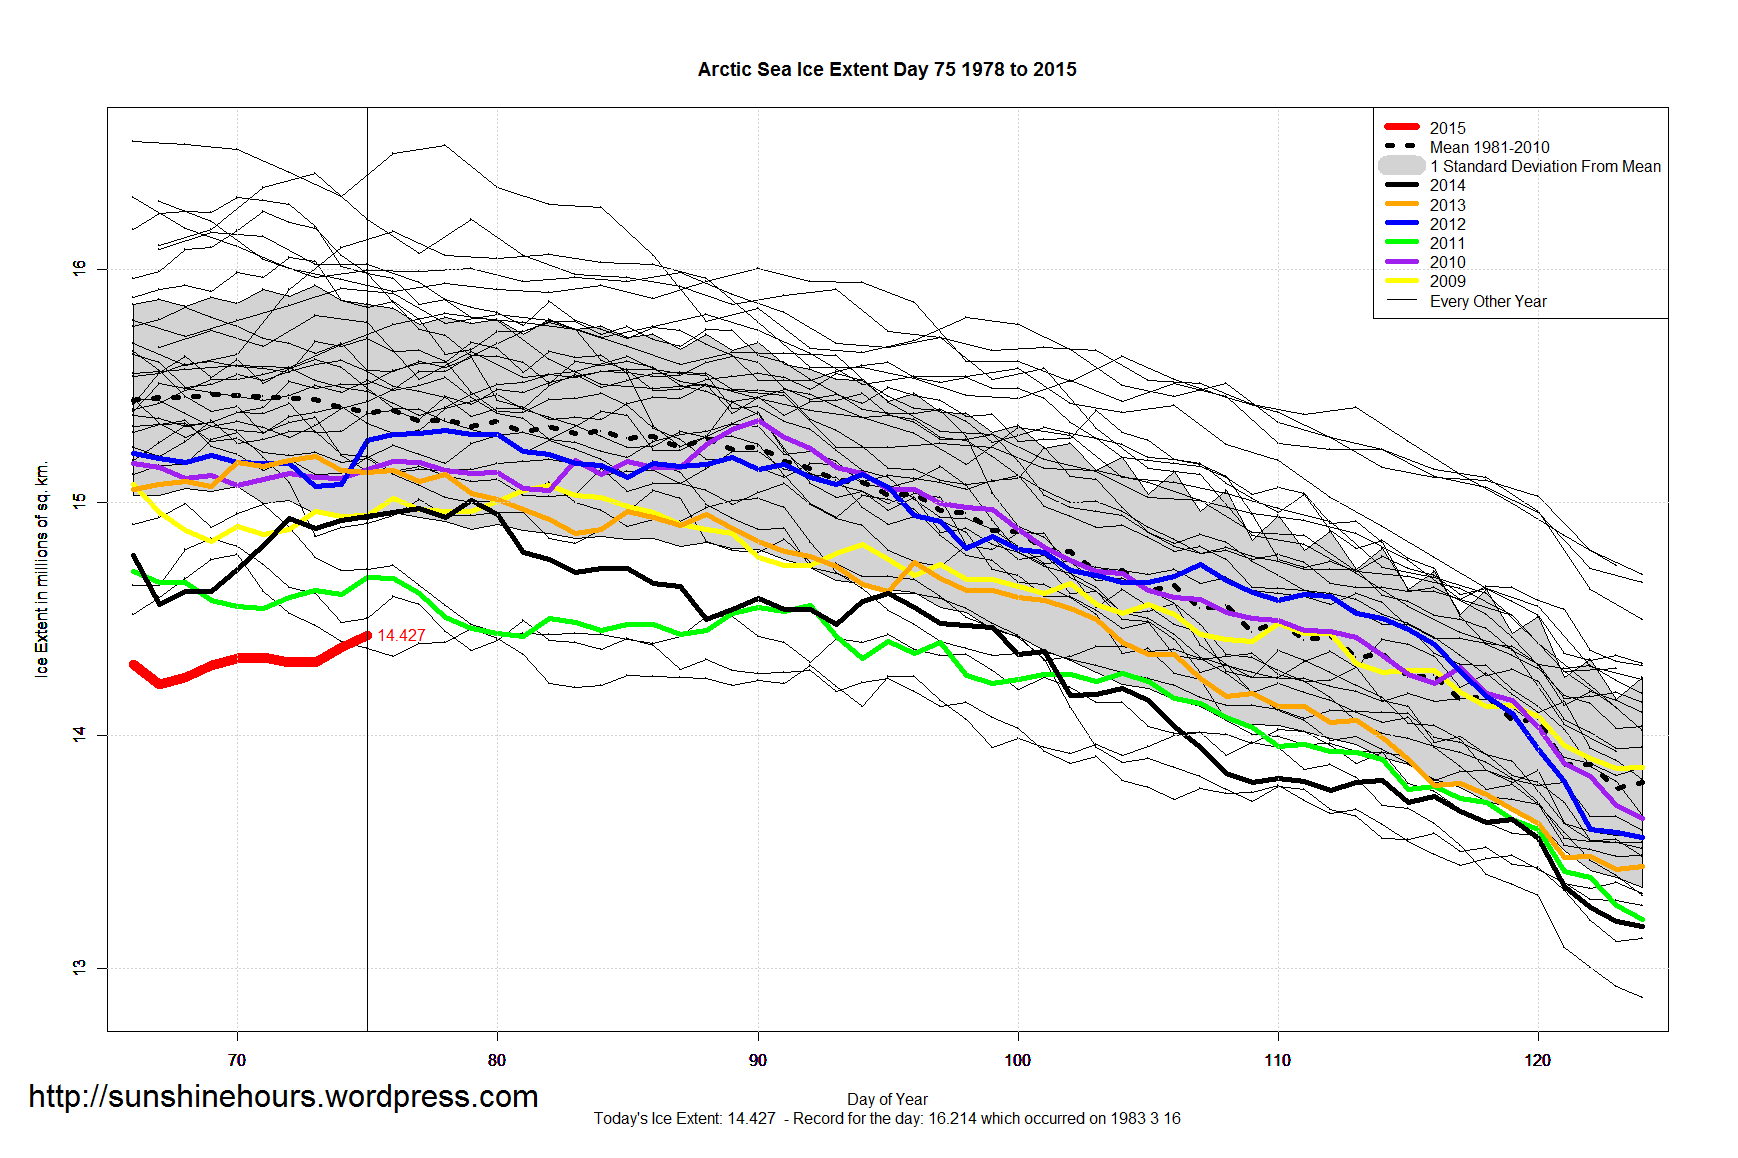
Back on March 10th (which was actually day 68) I called the Arctic Maximum at 14.595 million sq km. to have occurred on day 53.
From day 53 to day 68 extent had fallen over 300,000 sq km.
Since then Arctic Sea Ice Extent has risen 200,000 sq km to 14.427 million sq km.
Maybe I called it too soon. Maybe not. 1995 and 2010 had late maximums which occurred on day 90. It is only day 75.
To the anti-nuclear pro-Coal activists … THANKS!
“If all seven projects including the plant in Akita materialize, they will increase the nation’s coal-power generation by up to 7.26 gigawatts by around 2025.
That is equivalent to seven medium-size nuclear reactors.”
“All of Japan’s 48 reactors are offline over safety concerns following the Fukushima nuclear accident, though four of them are expected to come back online later this year.”
http://www.thegwpf.com/reality-check-japans-coal-boom-continues
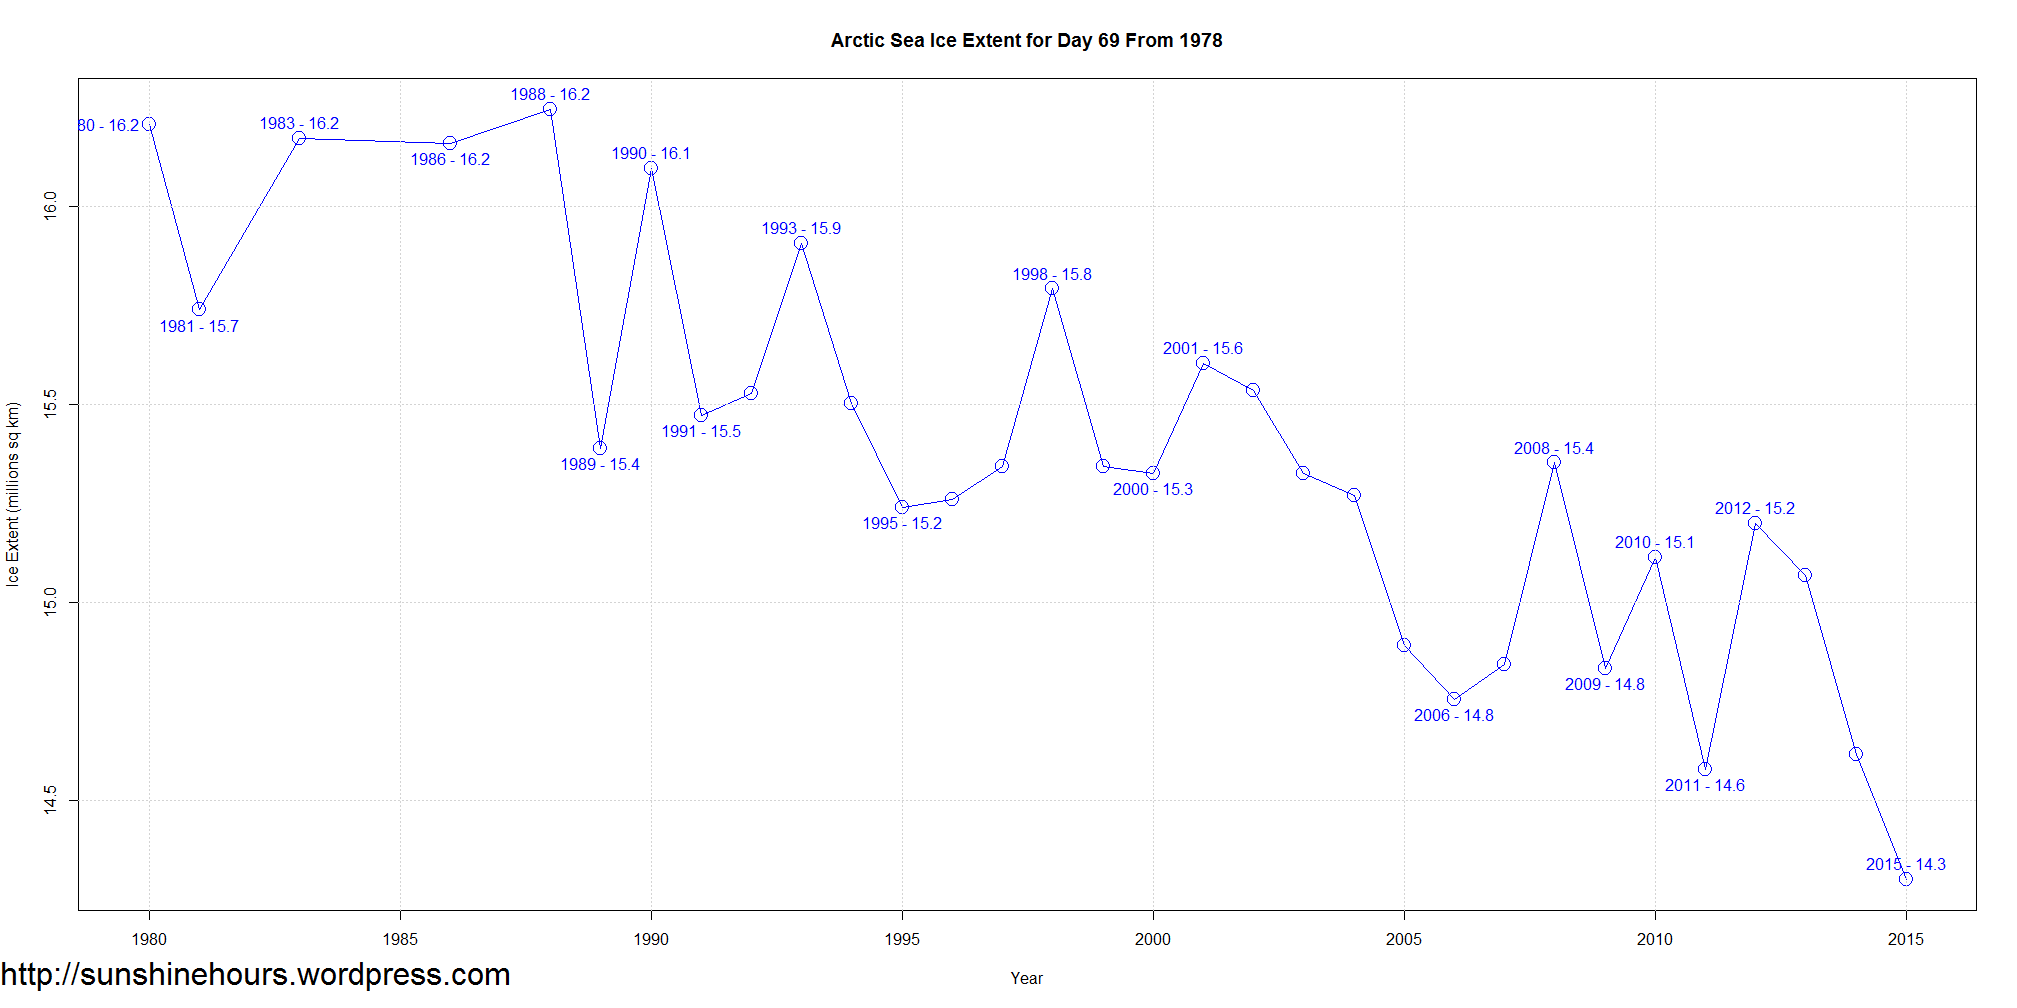
Unless something weird happens, the Arctic may have set its maximum way back on day 53.
It would be the lowest maximum in the satellite era.
It is not the earliest day of maximum.
1987, 1994 and 1996 set their maximums on day 52.
| Year | Min | Max | day of Max | day of Min | Avg Anomaly |
| 1979 | 6.895 | 16.635 | 60 | 264 | 0.69 |
| 1983 | 7.204 | 16.412 | 73 | 251 | 0.7 |
| 1982 | 7.16 | 16.325 | 58 | 256 | 0.81 |
| 1988 | 7.048 | 16.309 | 70 | 255 | 0.53 |
| 1980 | 7.533 | 16.302 | 65 | 249 | 0.7 |
| 1987 | 6.89 | 16.293 | 52 | 245 | 0.62 |
| 1990 | 6.011 | 16.249 | 71 | 264 | 0.06 |
| 1985 | 6.486 | 16.163 | 76 | 252 | 0.36 |
| 1986 | 7.122 | 16.158 | 69 | 249 | 0.57 |
| 1998 | 6.293 | 16.07 | 56 | 260 | 0.12 |
| 1993 | 6.161 | 16.048 | 72 | 256 | 0.29 |
| 1984 | 6.396 | 15.809 | 78 | 260 | 0.27 |
| 1981 | 6.902 | 15.801 | 73 | 253 | 0.5 |
| 1994 | 6.934 | 15.77 | 52 | 248 | 0.38 |
| 1989 | 6.888 | 15.766 | 65 | 265 | 0.33 |
| 2001 | 6.567 | 15.742 | 63 | 262 | -0.04 |
| 1997 | 6.602 | 15.684 | 79 | 246 | 0.03 |
| 1991 | 6.259 | 15.647 | 56 | 259 | 0.11 |
| 2003 | 5.969 | 15.629 | 79 | 260 | -0.24 |
| 1999 | 5.676 | 15.627 | 89 | 255 | 0.06 |
| 2002 | 5.625 | 15.624 | 68 | 261 | -0.27 |
| 1992 | 7.159 | 15.576 | 72 | 251 | 0.47 |
| 2000 | 5.943 | 15.498 | 63 | 255 | -0.13 |
| 1996 | 7.147 | 15.484 | 52 | 254 | 0.2 |
| 1995 | 5.99 | 15.384 | 90 | 250 | -0.22 |
| 2008 | 4.548 | 15.354 | 58 | 262 | -0.66 |
| 2010 | 4.59 | 15.351 | 90 | 262 | -0.92 |
| 2012 | 3.34 | 15.307 | 78 | 260 | -1.23 |
| 2004 | 5.77 | 15.3 | 70 | 262 | -0.4 |
| 2013 | 5.04 | 15.196 | 73 | 256 | -0.74 |
| 2009 | 5.047 | 15.195 | 61 | 255 | -0.7 |
| 2014 | 4.988 | 15.007 | 79 | 259 | -0.84 |
| 2005 | 5.314 | 14.993 | 68 | 263 | -0.73 |
| 2007 | 4.147 | 14.842 | 69 | 257 | -1.16 |
| 2006 | 5.746 | 14.777 | 70 | 257 | -0.86 |
| 2011 | 4.333 | 14.704 | 66 | 251 | -1.15 |
| 2015 | TBA | 14.595 | 53 | TBA | TBA |