


Wildfires USA – 80% Less Than The 1930s
Bjorn Lomborg has been trying to quell the hysteria about forest fires in the USA.


As Lomborg writes on Facebook:
Some people have pointed out that the National Interagency Fire Center writes that “Prior to 1983, sources of these figures are not known, or cannot be confirmed, and were not derived from the current situation reporting process. As a result the figures prior to 1983 should not be compared to later data.”
This is convenient, since the NIFC for the longest time didn’t even want to acknowledge that there were data before 1960 (https://web.archive.org/web/20171206160413/https://www.nifc.gov/fireInfo/fireInfo_stats_totalFires.html). I’ve consistently pointed out that we had early data and where the data starting in 1926 comes from; it is the Wildfire Statistics from USDA, summarized in the official Historical Statistics of the United States – Colonial Times to 1970, p537: http://bit.ly/2hGp7XF.
So, we all know, very well, where this data is from.
Interestingly, what the NIFC forgets to tell us is that the earlier data was based on reporting from *much* less land – about 200m ha of 700m ha burnable land (http://www.publish.csiro.au/WF/WF14190). So, if anything, it is reasonable to argue that the early estimates should multiplied by 3.5 (divided by 2/7th), which indeed is what this article did (https://esajournals.onlinelibrary.wiley.com/doi/abs/10.1890/07-1183.1): “Littel et al. (2009) recognised the reporting bias and, as part of their analyses of fire–climate relationships in the western US, multiplied the USFS-reported WFAB estimates ‘by the ratio of the total area protected in 2003 to the area protected in a given year’.”
There are other, legitimate concerns, such as the inclusion of intentional burning in the early years, which may have added millions of acres to the numbers in the early part of the century (4-10% too much). But still, this does not in any way jeopardize the general trend of the data. This is of course why this data has been used by many academic publications, including Houghton, R. A. (03.2000). “Changes in terrestrial carbon storage in the United States. 2: The role of fire and fire management”. Global ecology and biogeography (1466-822X), 9 (2), p. 145.
If anything, the graph that I’m showing is likely *underestimating* the amount of burning in the early part of last century.
One way to see this is comparing the graph to the US estimate from forest fires in the global carbon budget from “Fire history and the global carbon budget” (https://onlinelibrary.wiley.com/doi/10.1111/j.1365-2486.2005.00920.x). They estimate the burnt area in Eastern and Western US (here added together) in decades from 1900-2000. It is very clear that not only is the graph broadly right, but early fire, from where we have no or very spotty data, is likely to have been even greater, compared to the present.
The likely 2018 burnt area will be about 9% of the burnt area each year in the decade 1900-1910.
Arctic Sea Ice Volume 5-Jan-2019


Sea Ice Extent (Global Antarctic and Arctic) – Day 5 – 2019


Climate warming experiment finds unexpected results
It’s always a surprise when they actually do experiments on the main tenets of the church of climate change.
Tropical forests store about a third of Earth’s carbon and about two-thirds of its above-ground biomass. Most climate change models predict that as the world warms, all of that biomass will decompose more quickly, which would send a lot more carbon dioxide into the atmosphere. But new research presented at the American Geophysical Union’s 2018 Fall Meeting contradicts that theory
Stephanie Roe, an ecology Ph.D. student at the University of Virginia, measured the rate of decomposition in artificially warmed plots of forest in Puerto Rico. She found biomass in the warmed plots broke down more slowly than samples from a control site that wasn’t warmed.
Her results indicate that as the climate warms, forest litter could pile up on the ground, instead of breaking down into the soil. Less decomposition means less carbon dioxide released back into the atmosphere. But it also means less carbon taken up by the soil, where it’s needed to fuel microbial processes that help plants grow.
The money quote:
But instead of seeing faster rates of decomposition, Roe observed the warming produced a drying effect in the plots, which slowed decomposition. “What we found is actually it went the other way because moisture was impacted so much,” Roe said. Moisture in the litter from the treatment sites was reduced by an average of 38 percent.
Read more at: https://phys.org/news/2019-01-climate-unexpected-results.html#jCp
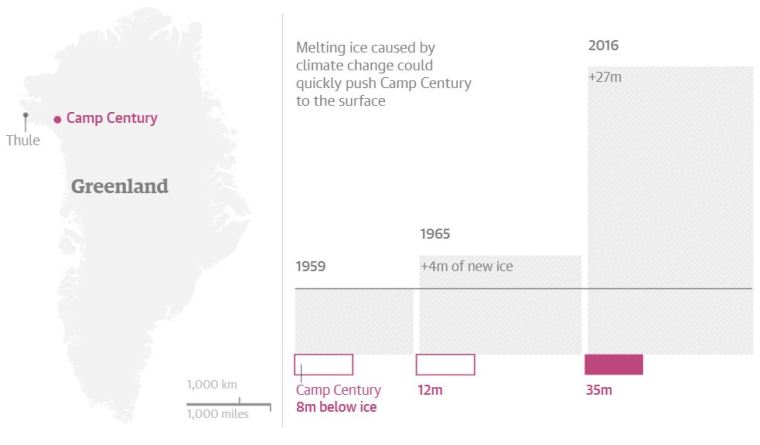
Camp Century Greenland: 8m Under The Ice in 1959 and 35m Under The Ice in 2016
Interesting article about Camp Century.
Howerever the funny part is where the Guardian tries to claim that “climate change” is going too melt the ice and expose radioactive materials when in fact the ice cover has gone from 8m in 1959 to 27m in 2016.
I don’t see any melting!
The US army engineering corps excavated Camp Century in 1959 around 200km (124 miles) from the coast of Greenland, which was then a county of Denmark.
Powered, remarkably, by the world’s first mobile nuclear generator and known as “the city under the ice”, the camp’s three-kilometre network of tunnels, eight metres beneath the ice, housed laboratories, a shop, a hospital, a cinema, a chapel and accommodation for as many as 200 soldiers.
Read the rest
New Zealand Meteor
UPDATE: It was Russian space junk
There was meteor flying over New Zealand Saturday night (NZ time).
This footage taken during a cricket match is great.
And here is some Youtube footage:
Arctic Sea Ice Volume 4-Jan-2019


Sea Ice Extent (Global Antarctic and Arctic) – Day 4 – 2019


Little Ice Age Still Cooling Pacific
Lag: a period of time between one event or phenomenon and another
Little Ice Age Still Cooling Pacific
As much of the ocean responds to the rising temperatures of today’s world, the deep, dark waters at the bottom of the Pacific Ocean appear to be doing the exact opposite.
A Harvard study has found that parts of the deep Pacific may be getting cooler as the result of a climate phenomenon that occurred hundreds of years ago.
Around the 17th century, Earth experienced a prolonged cooling period dubbed the Little Ice Age that brought chillier-than-average temperatures to much of the Northern Hemisphere.
Though it’s been centuries since this all played out, researchers say the deep Pacific appears to lag behind the waters closer to the surface, and is still responding to the Little Ice Age.
In the deep Pacific Ocean, however, temperatures are dropping. This effect could be seen at a depth of around 2 kilometers (1.2 miles).

Read the rest
