USHCN 2.5 – Estimated Data Is Warming Data

Over at Steven Goddard’s blog he is trying to point out how much USHCN data is “Estimated”.

From the readme.txt file: " 'E' indicates the data value is an estimate from surrounding values; no original value is available;"

So I had a copy of the data from last month because of a previous post.

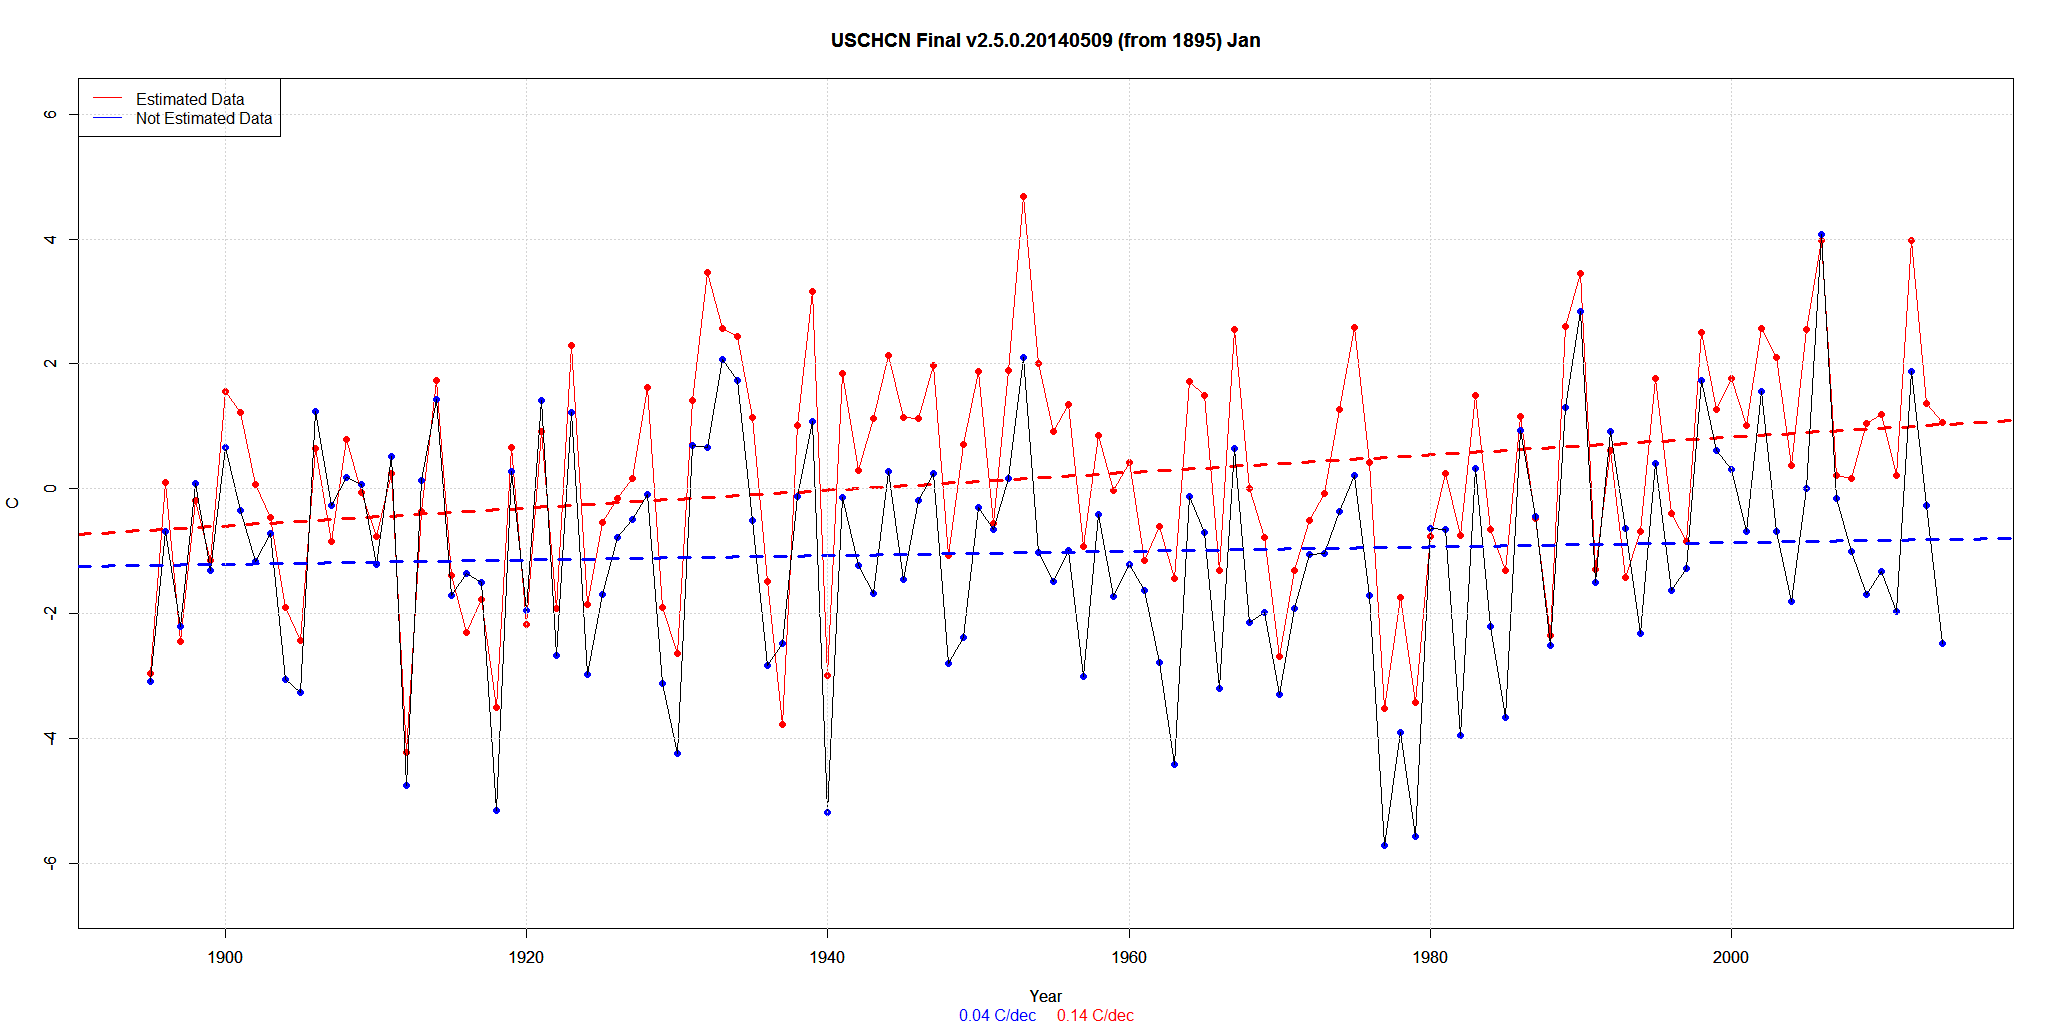
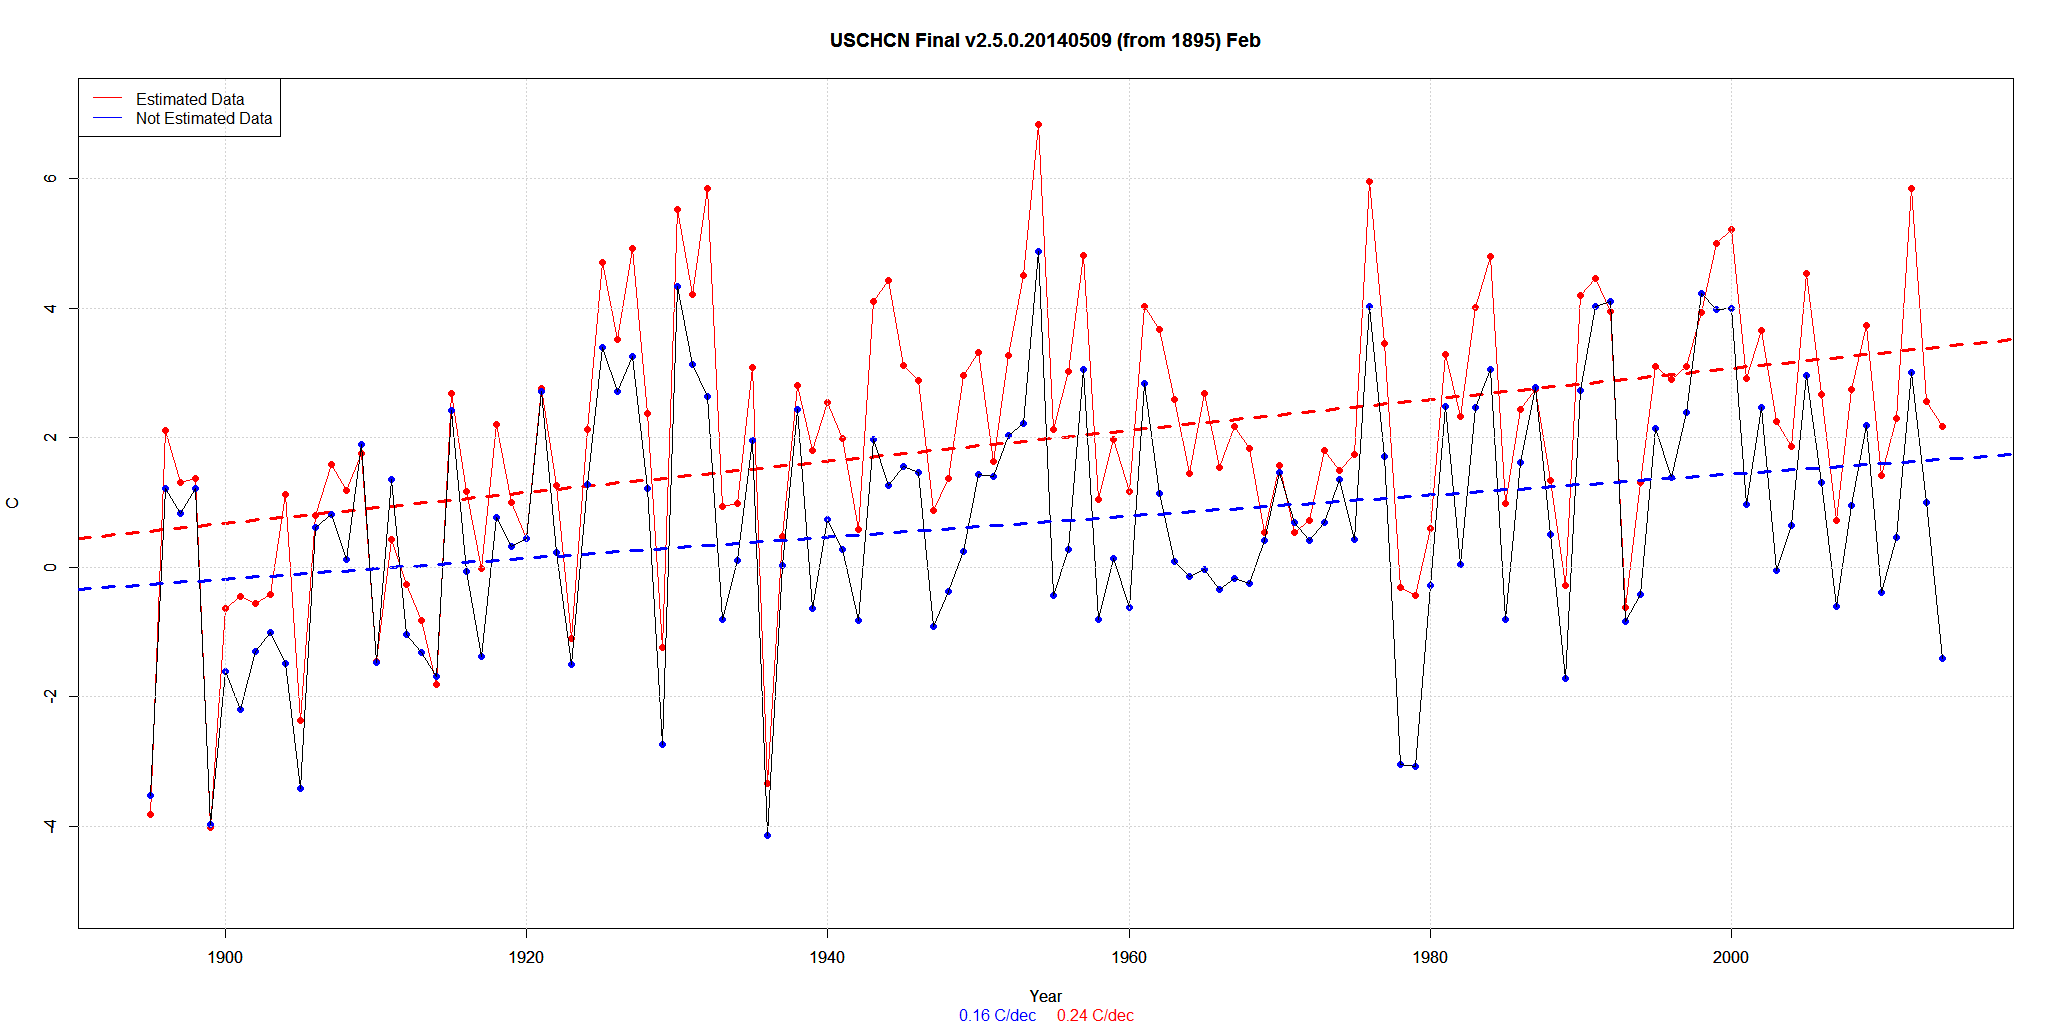
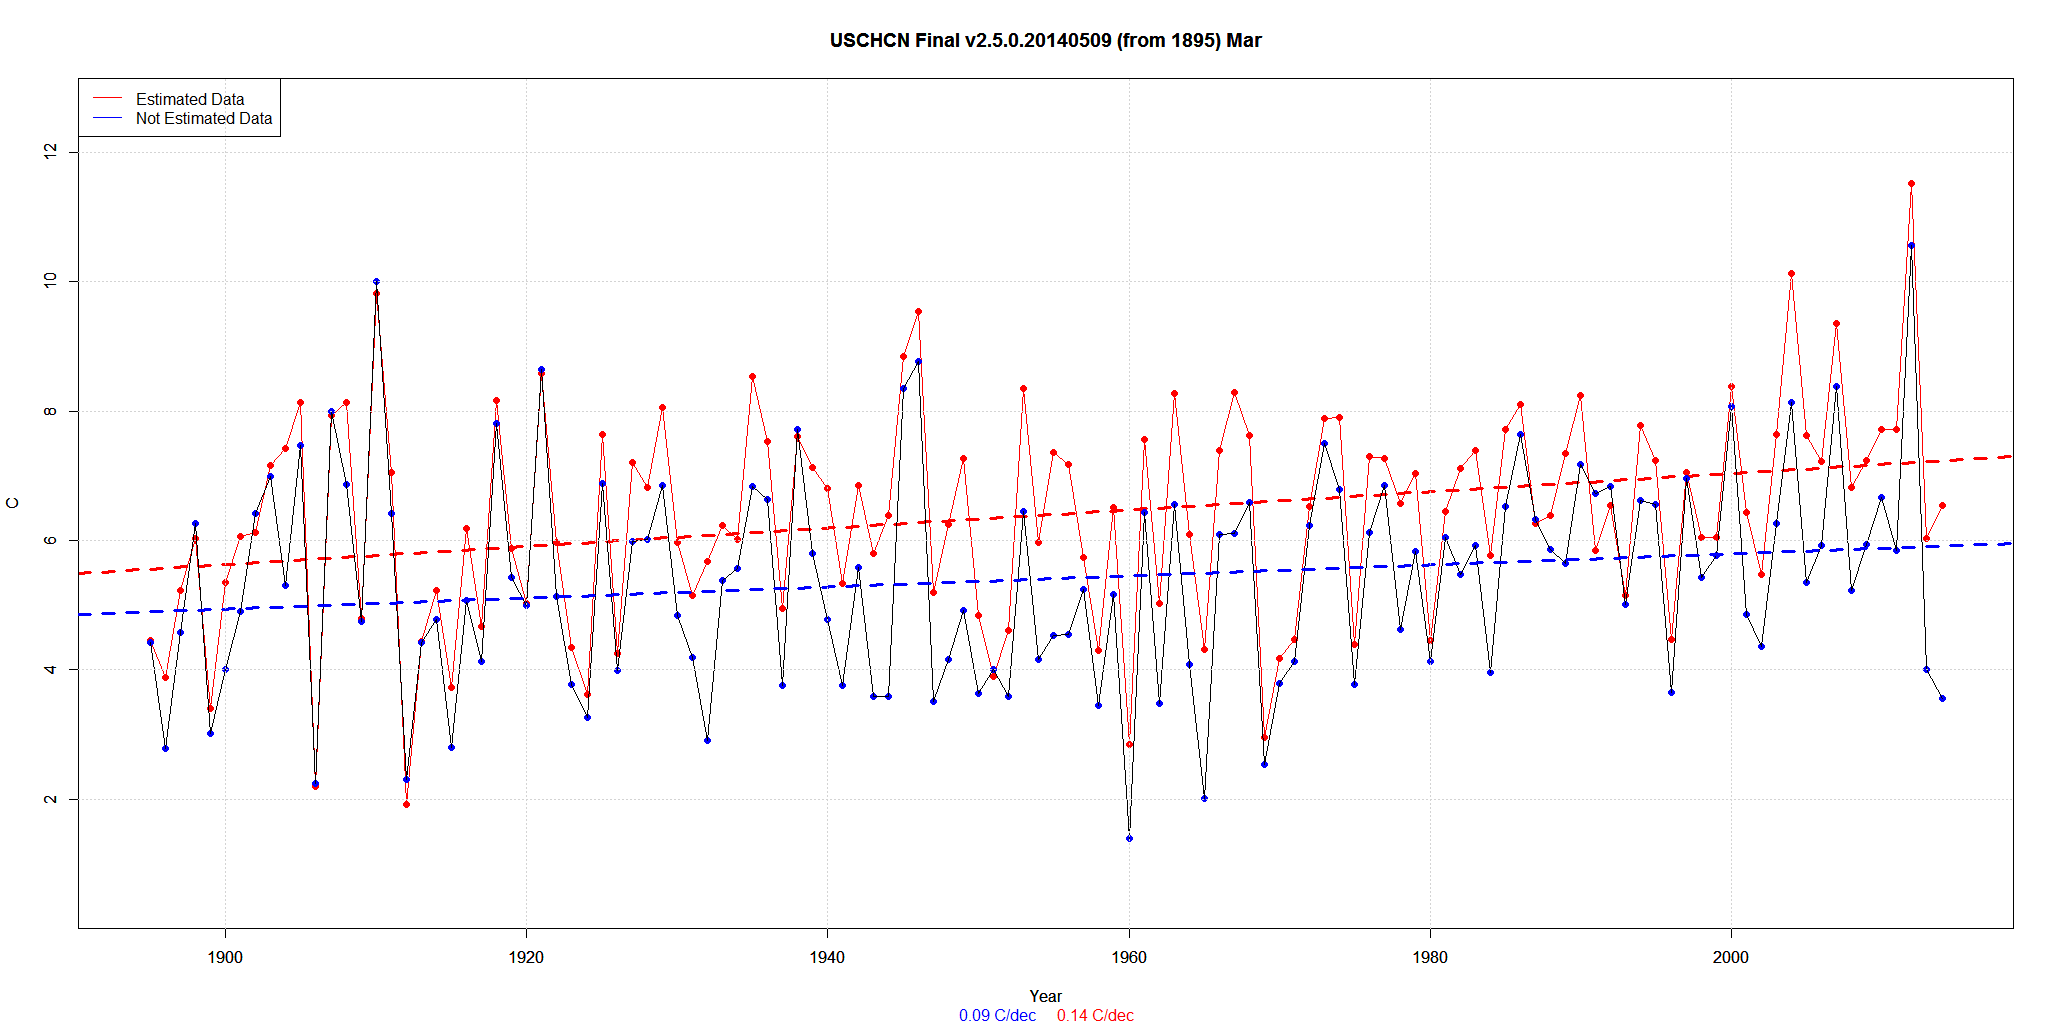
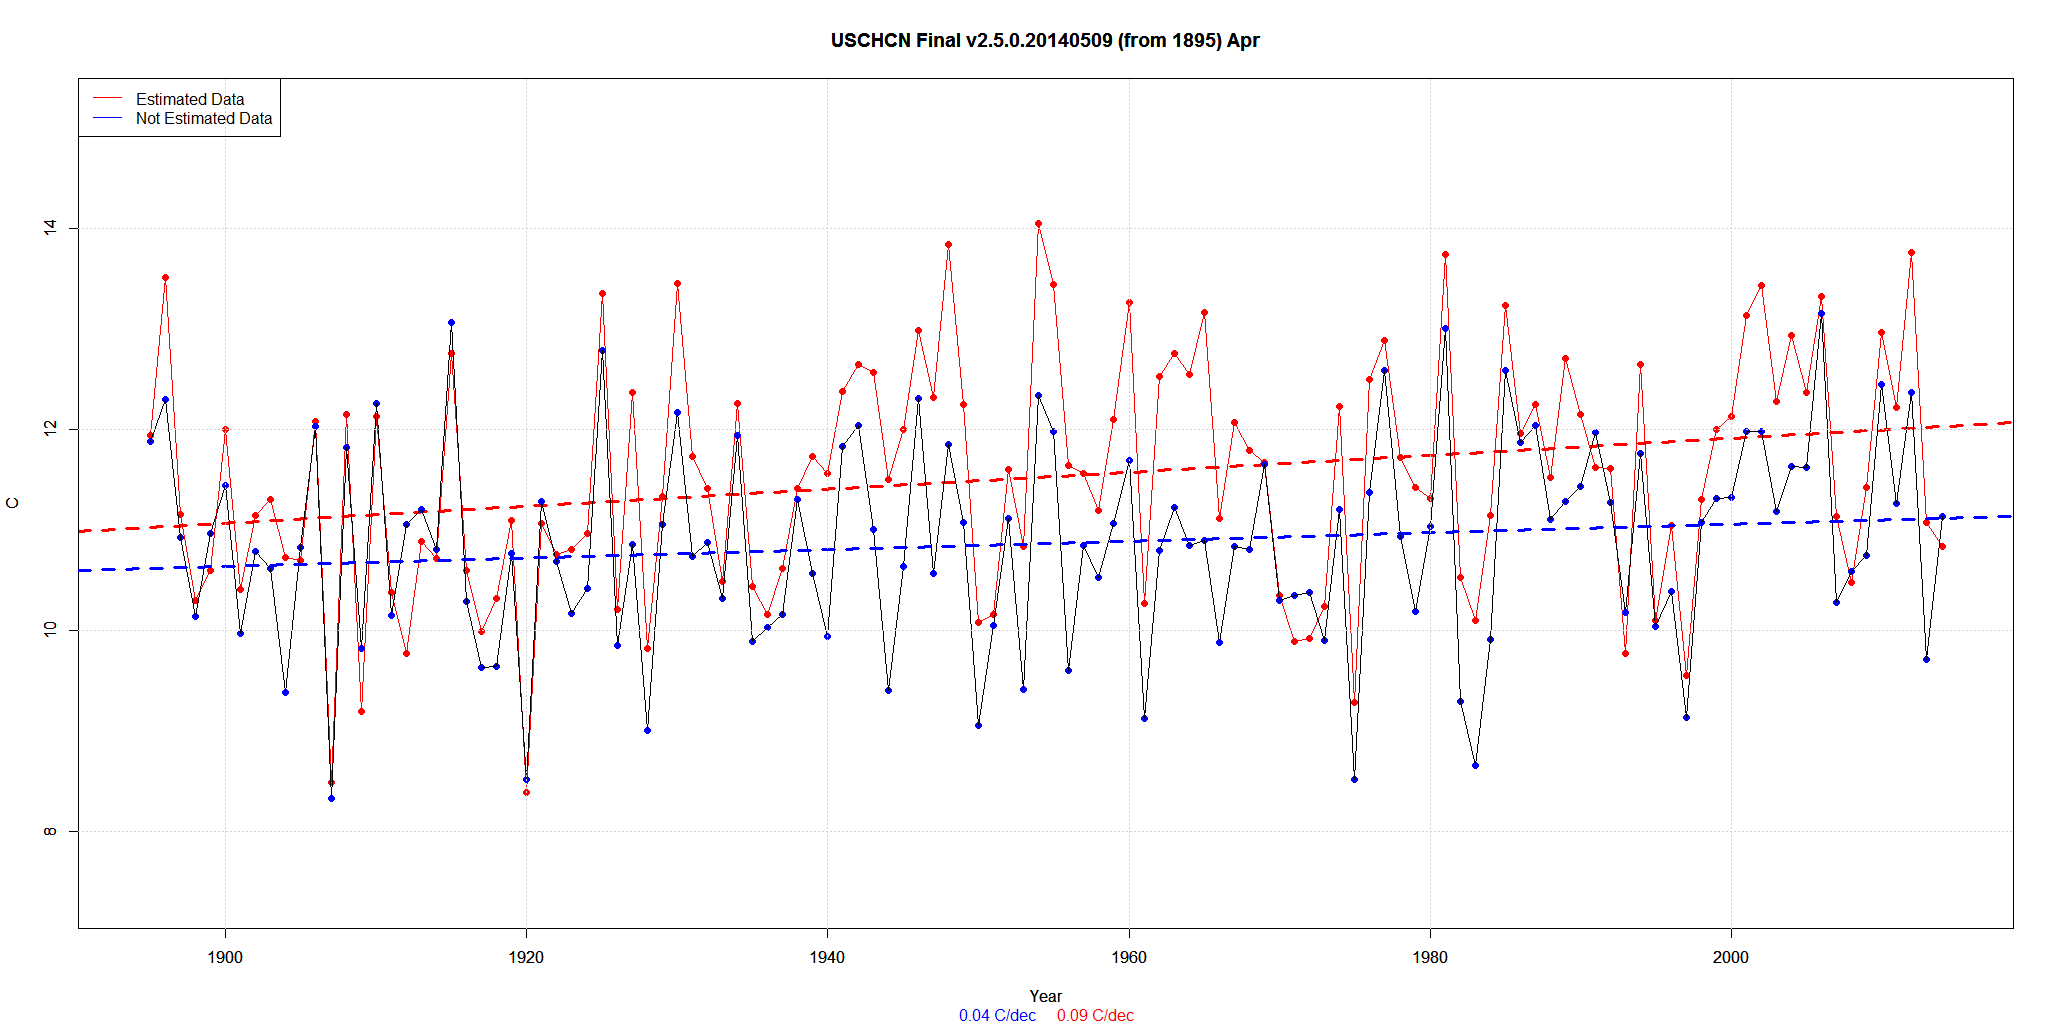
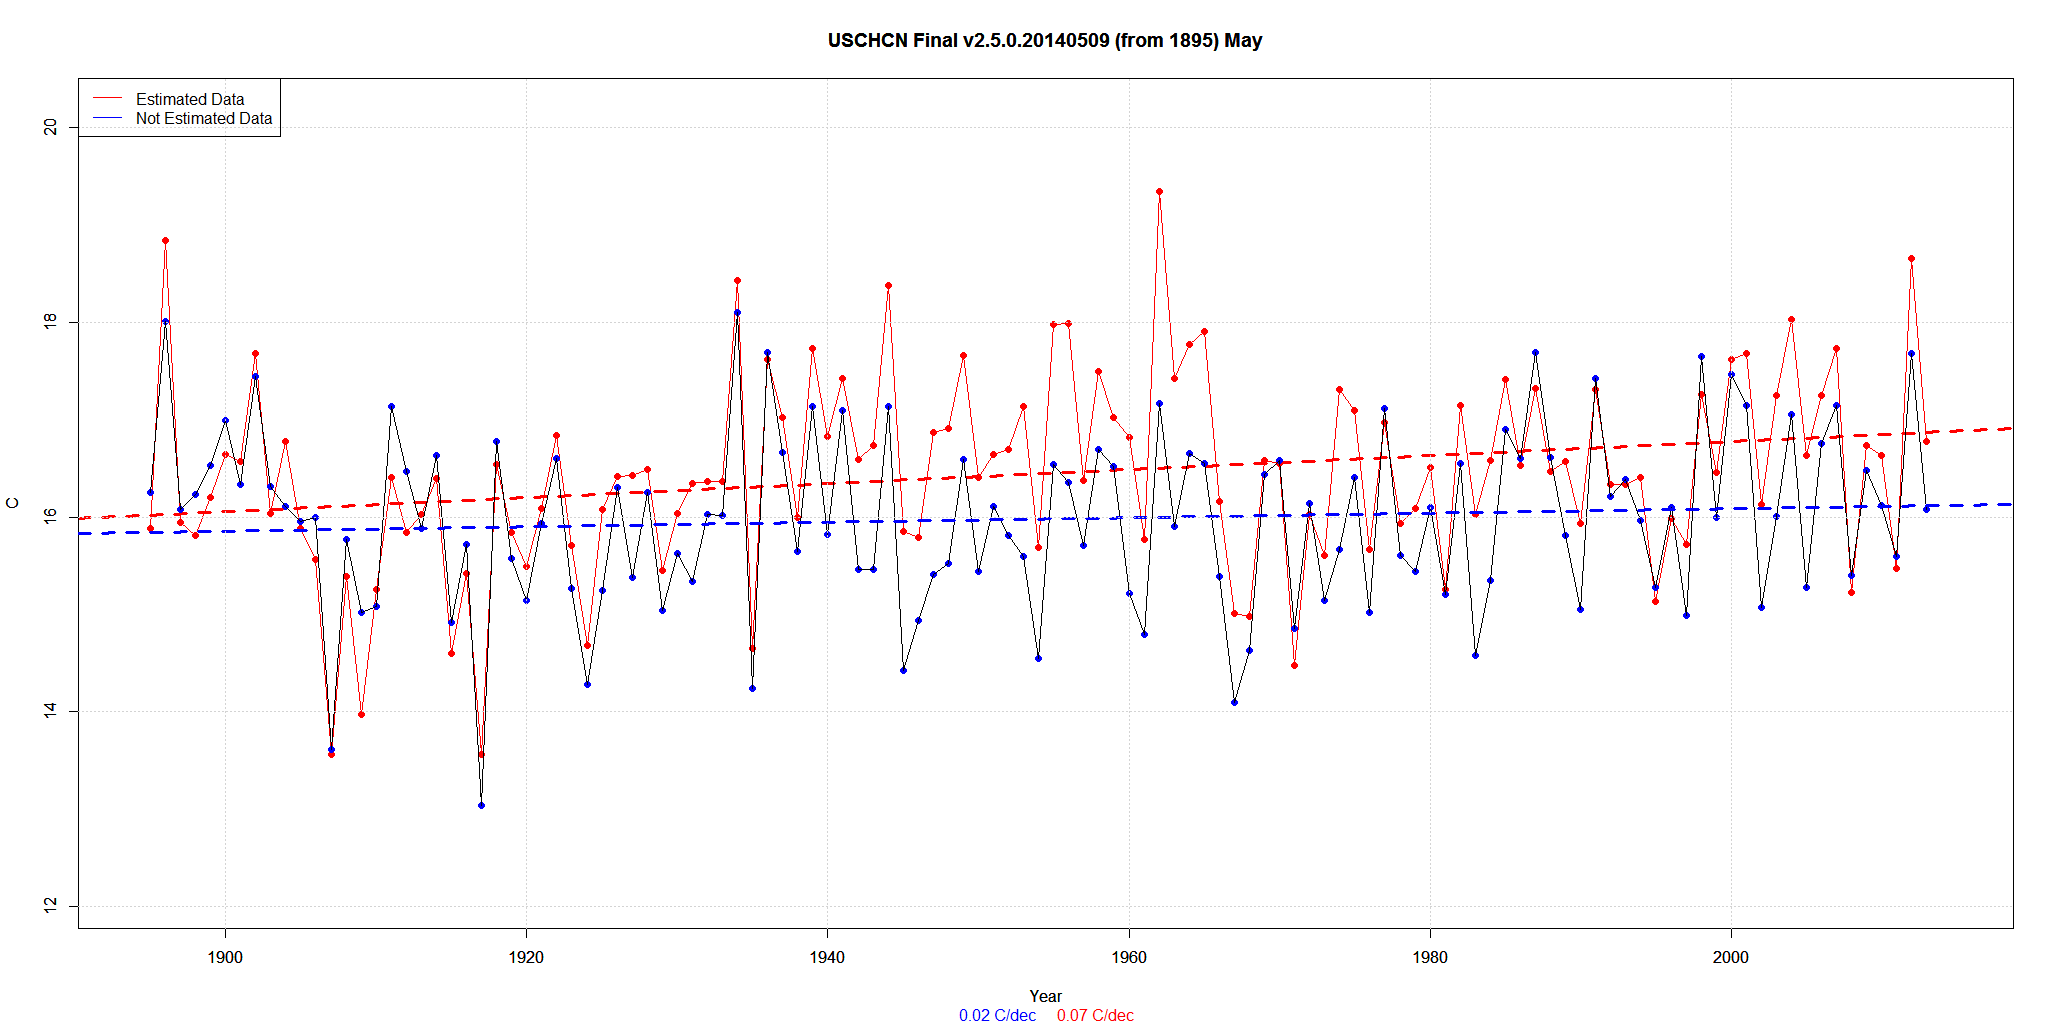
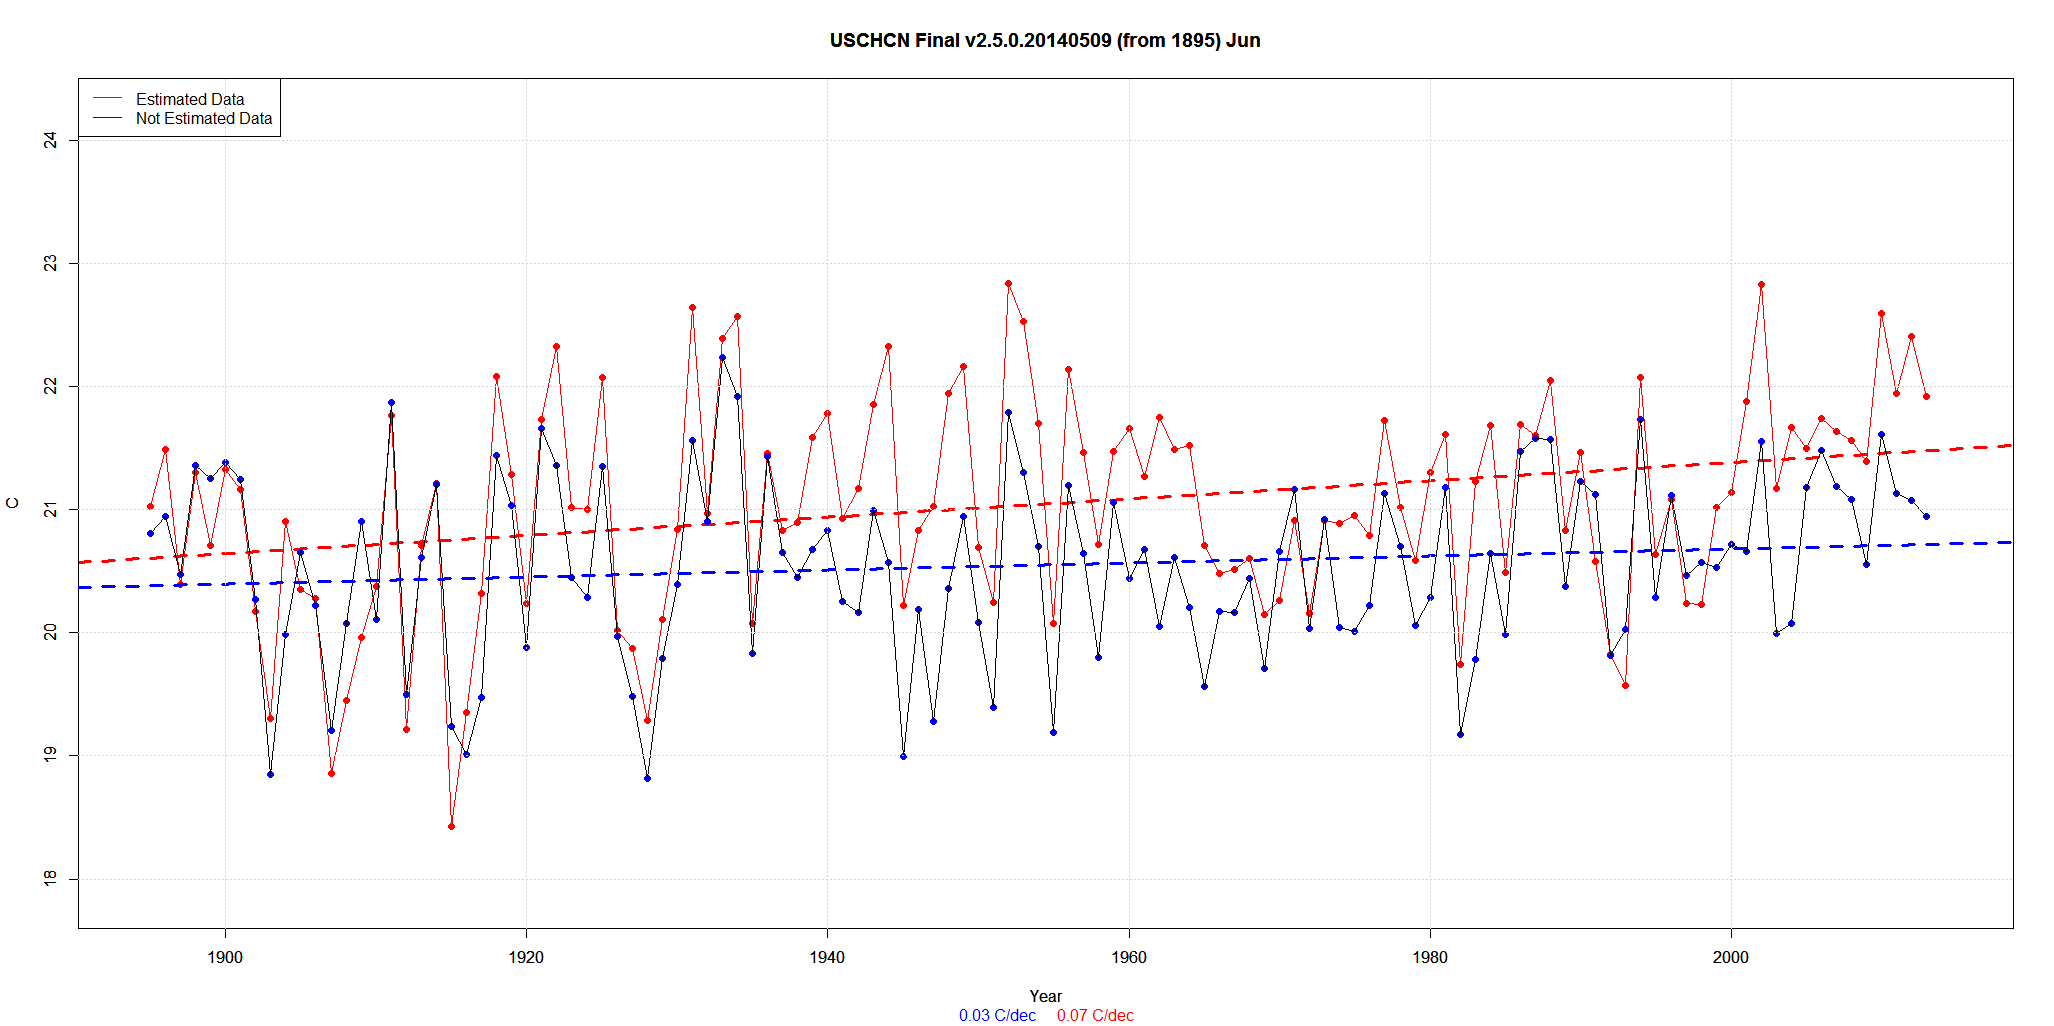
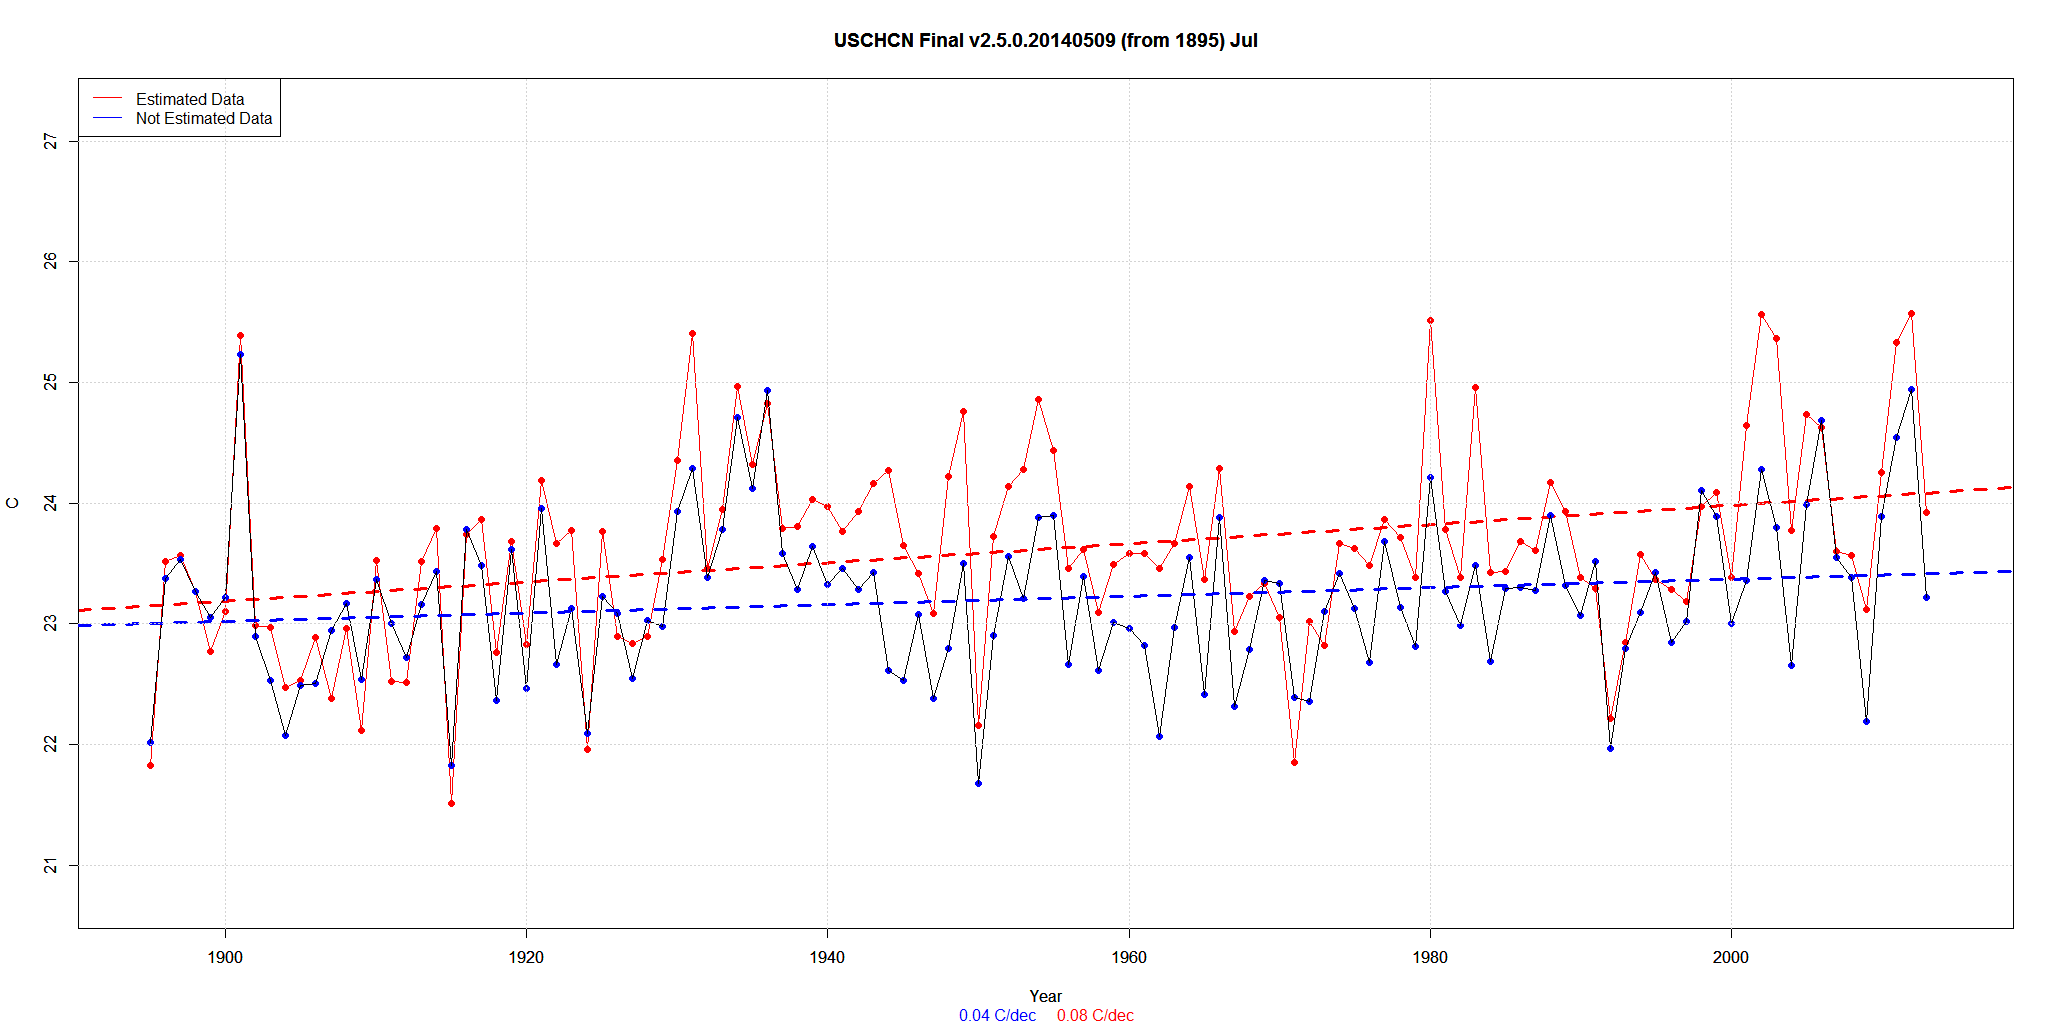
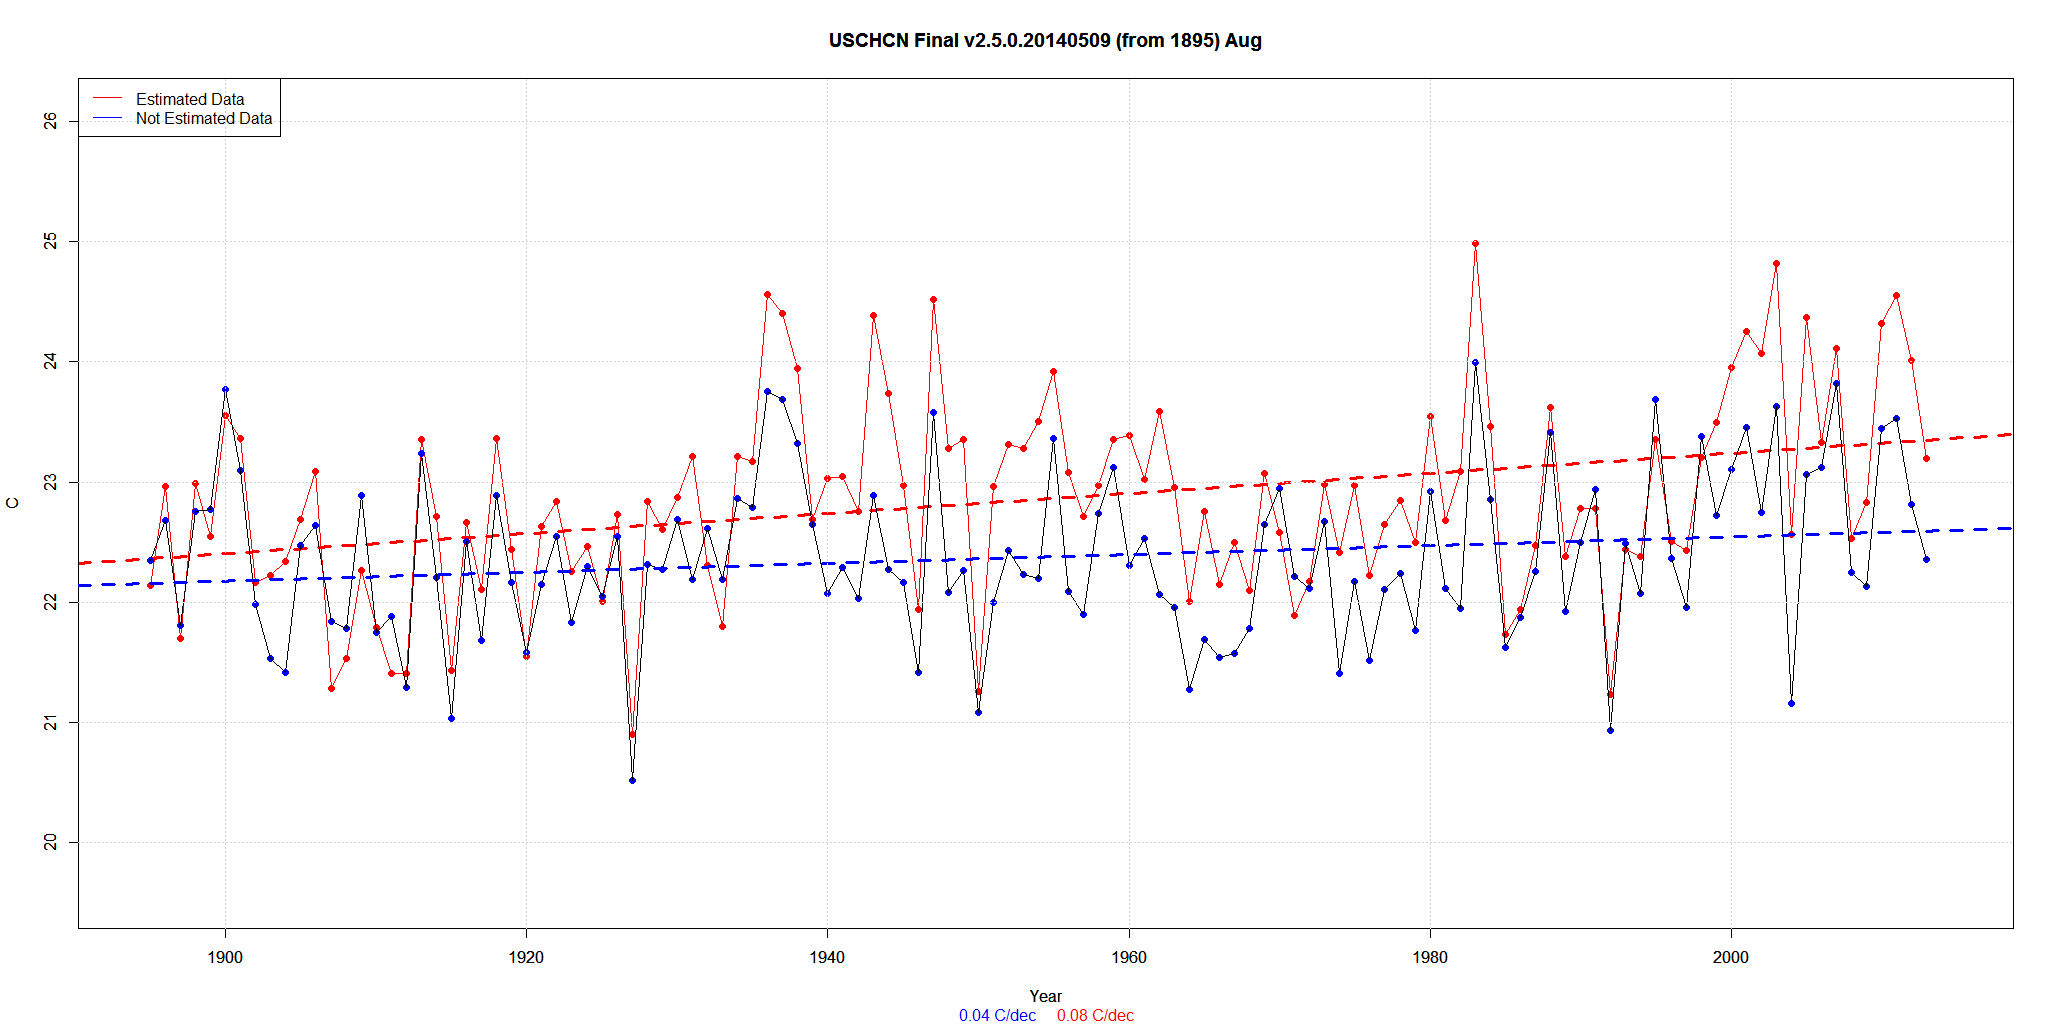
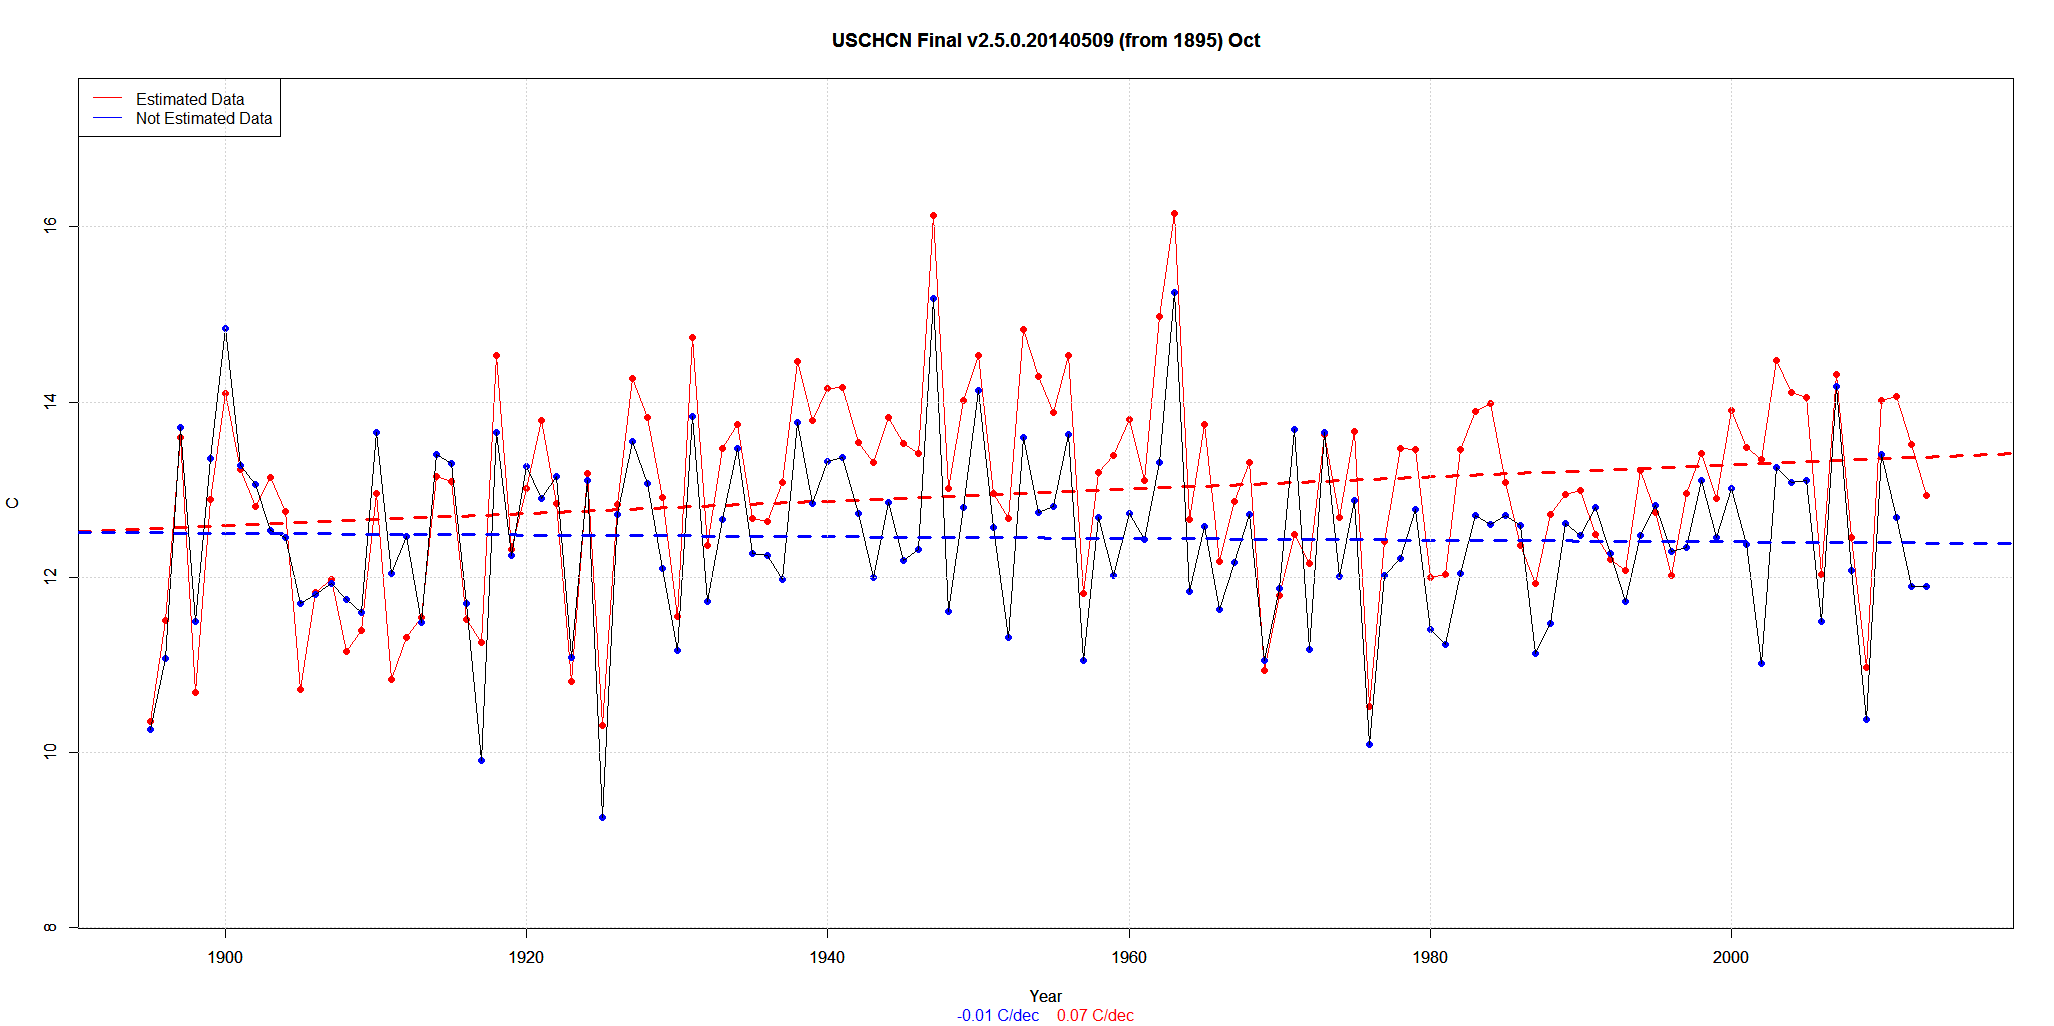
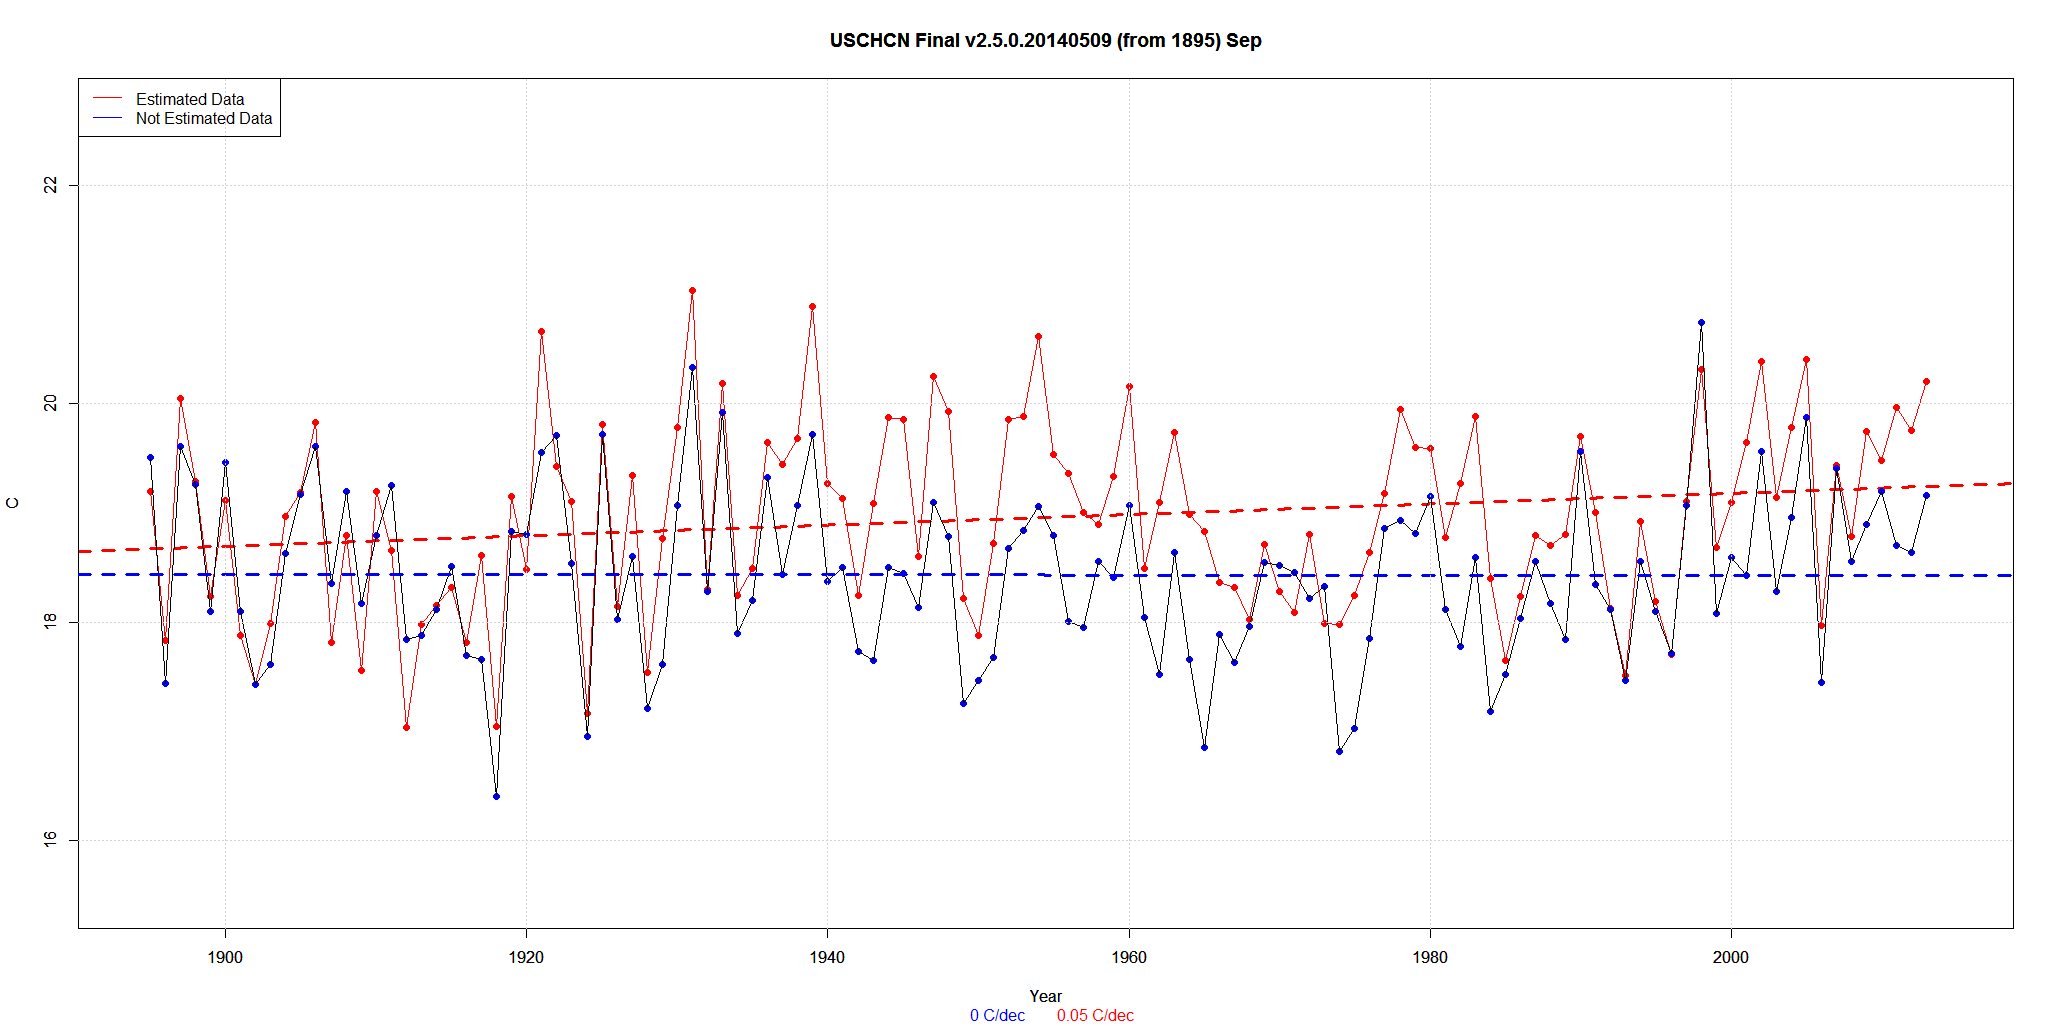
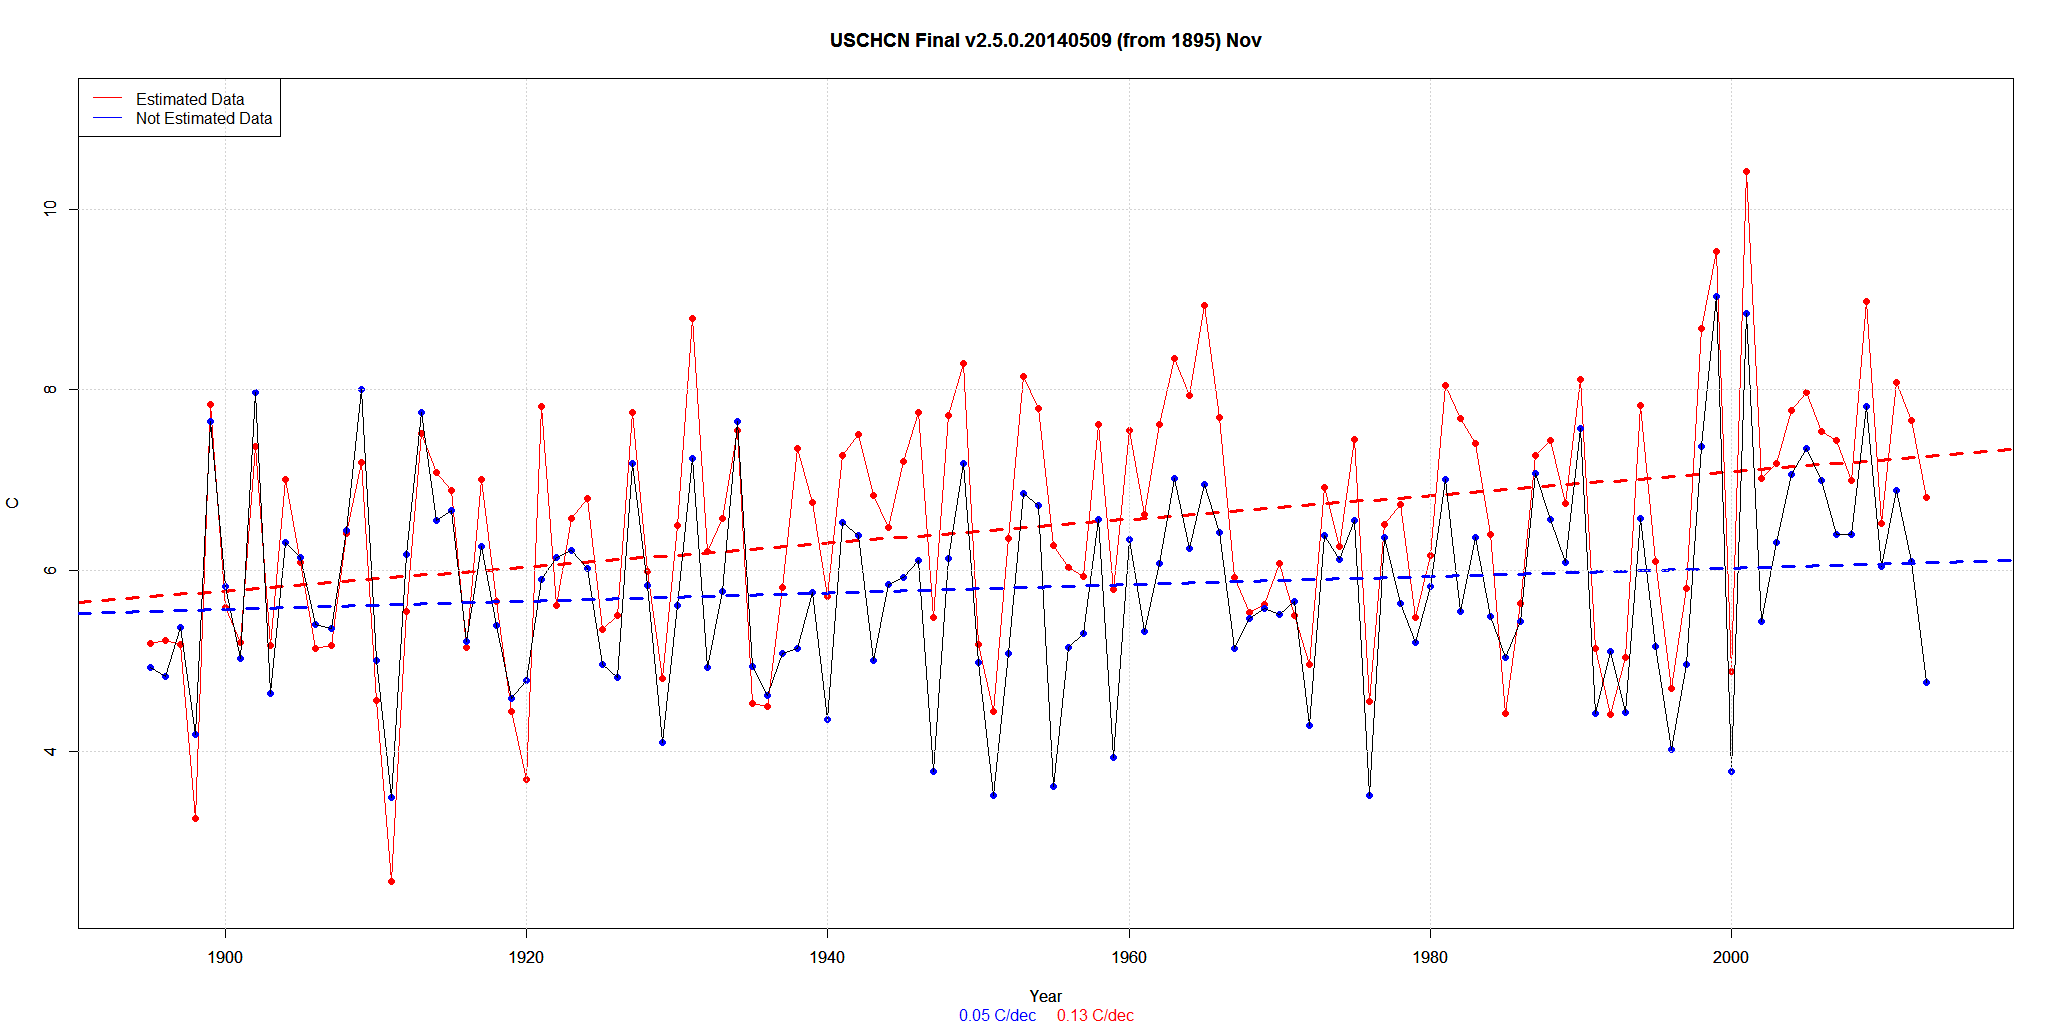
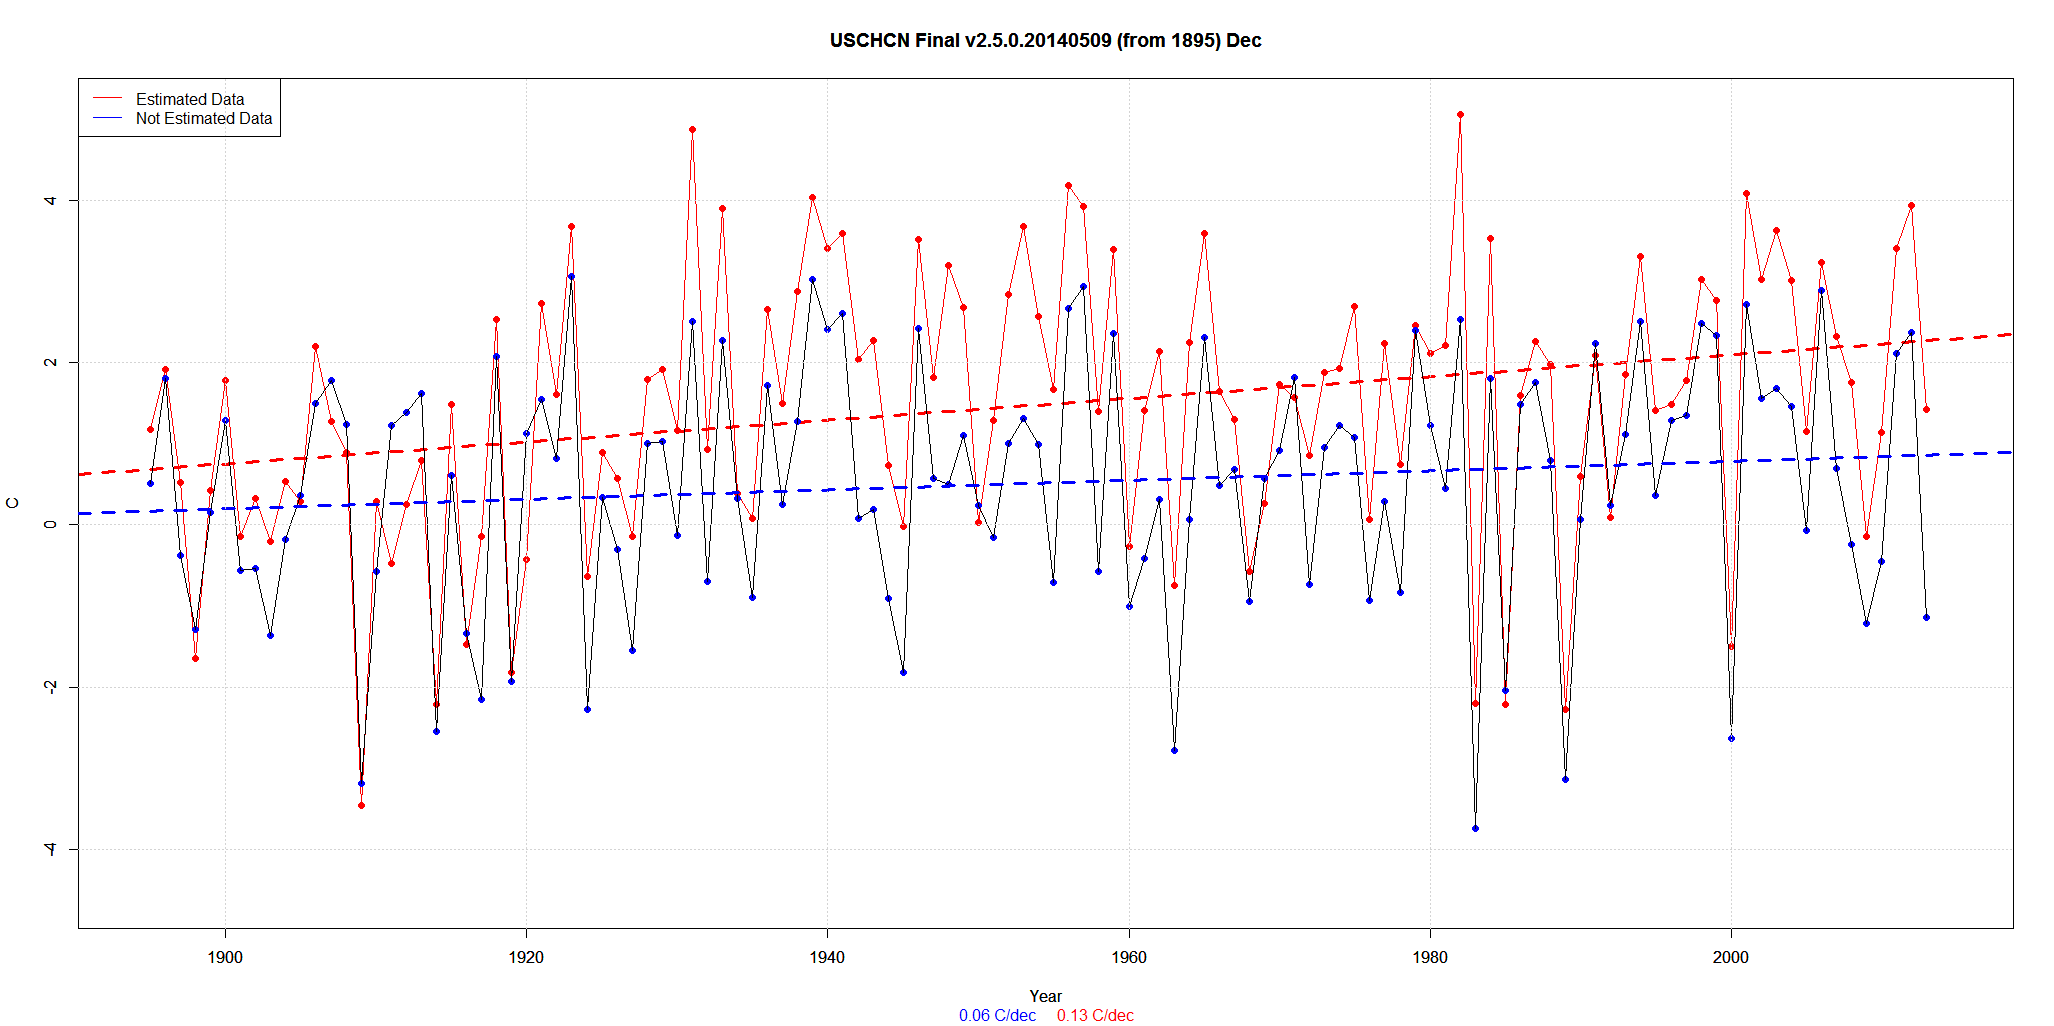
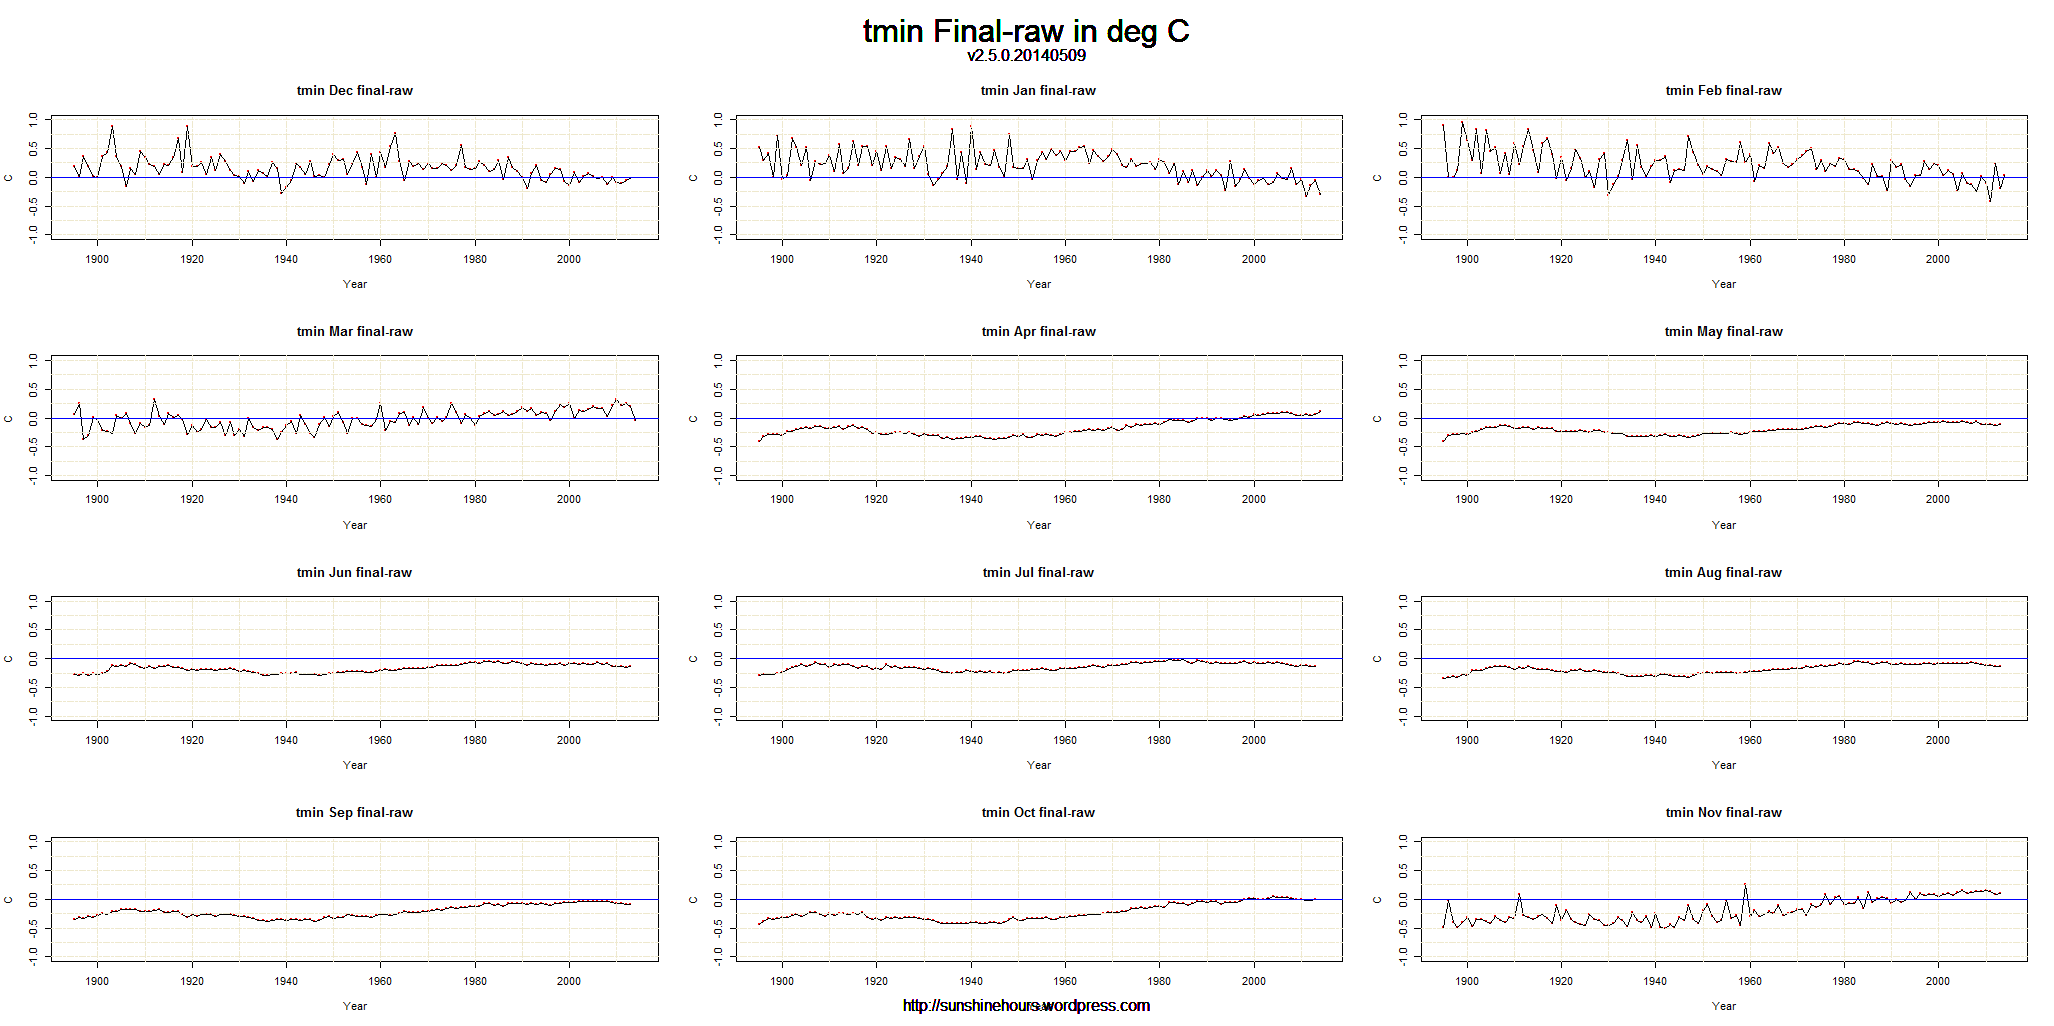
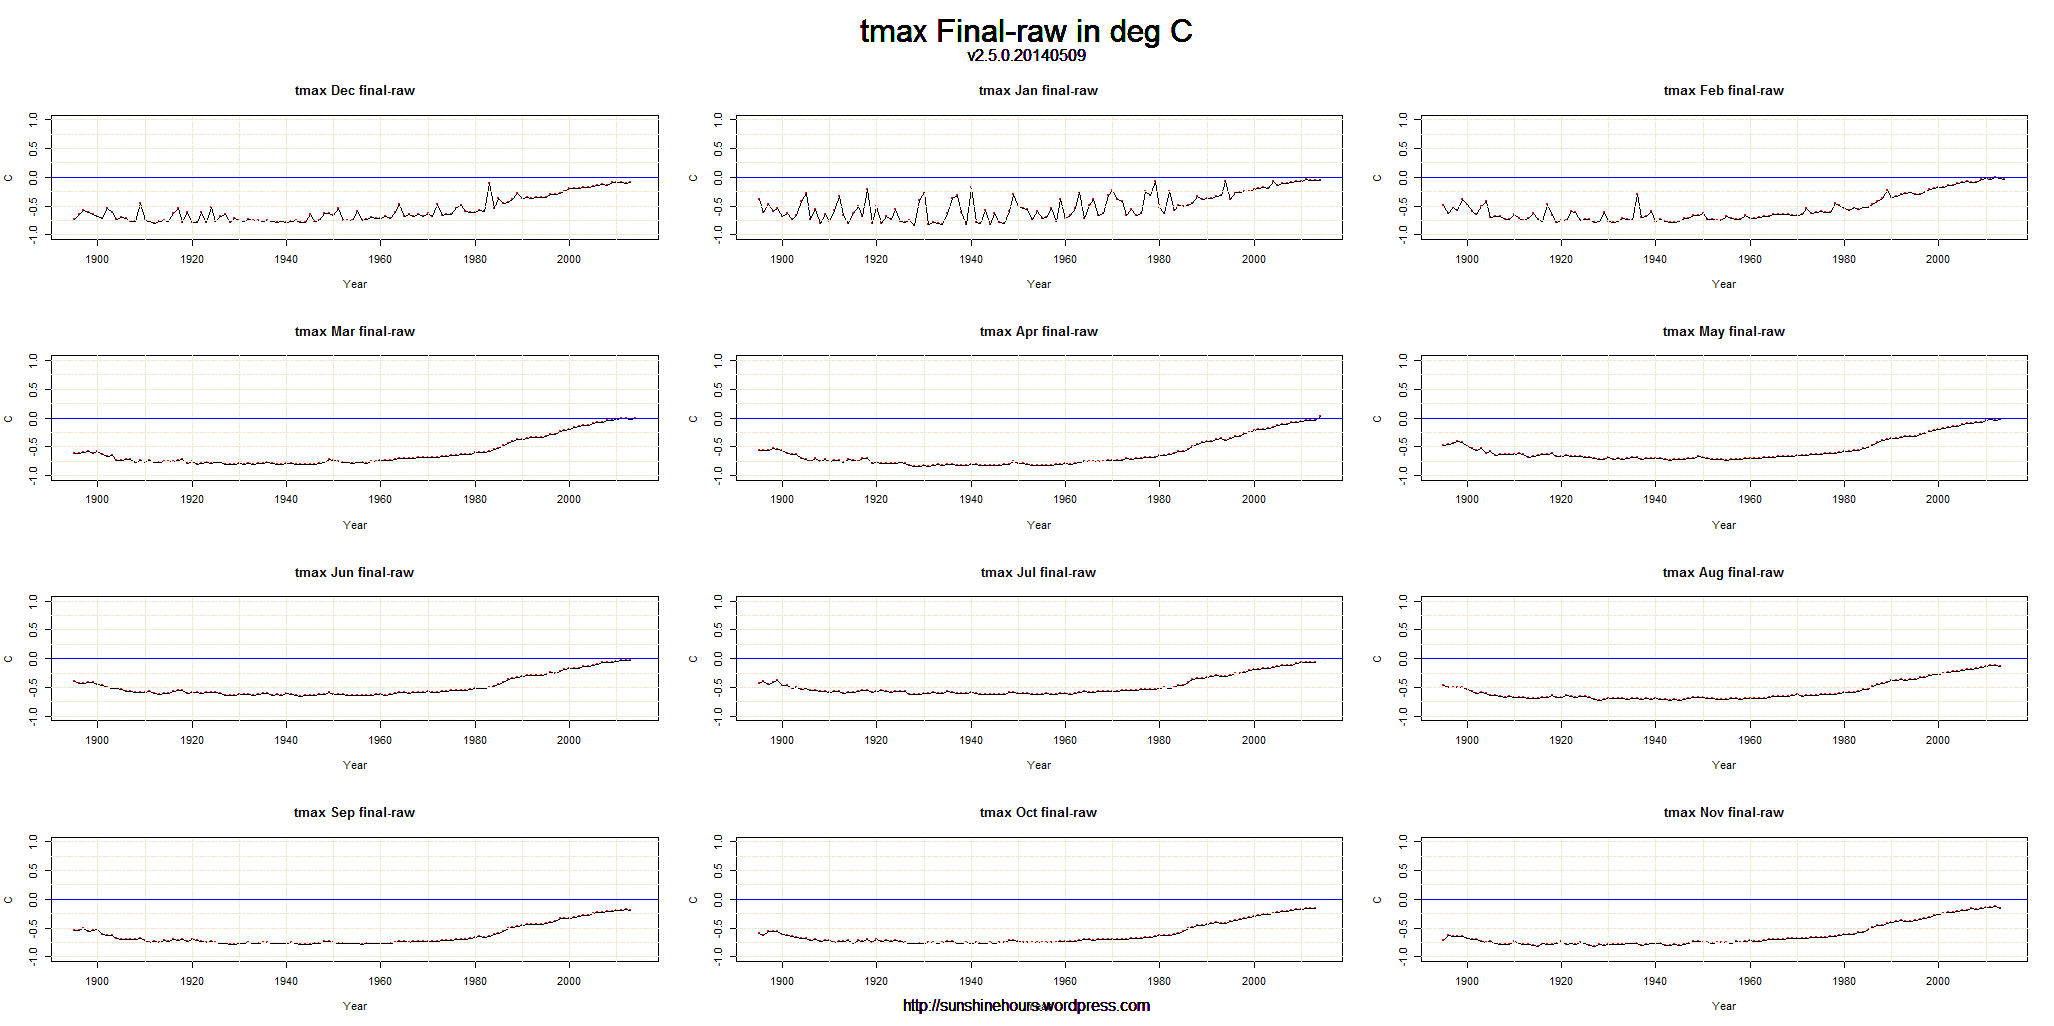
So I thought … take the Final data and graph each month comparing data with an E flag to all the data without an E flag.

Surprise. Estimated data is Warming Data. And that is ignoring all the manipulation in going from Raw to Final data.

USCHCN Final v2.5.0.20140509 (from 1895) Jan

USCHCN Final v2.5.0.20140509 (from 1895) Feb

USCHCN Final v2.5.0.20140509 (from 1895) Mar

USCHCN Final v2.5.0.20140509 (from 1895) Apr

USCHCN Final v2.5.0.20140509 (from 1895) May

USCHCN Final v2.5.0.20140509 (from 1895) Jun

USCHCN Final v2.5.0.20140509 (from 1895) Jul

USCHCN Final v2.5.0.20140509 (from 1895) Aug

USCHCN Final v2.5.0.20140509 (from 1895) Oct

USCHCN Final v2.5.0.20140509 (from 1895) Sep

USCHCN Final v2.5.0.20140509 (from 1895) Nov

USCHCN Final v2.5.0.20140509 (from 1895) Dec

USHCN 2.5 Adjustments (Final – Raw)

Over at Nick Stokes blog they are trying to tear down a graph used by WUWT and Steven Goddard. They have made a valid point that the last few skyrocketing points may be because of late data.

But I thought I would take a look at monthly adjustments to tavg, tmin and tmax. Each of these 3 graph sets show the Final Temperature  minus the  Raw Temperature.

1) As you can see the USHN adjustments cool the past (especially the warm 20s/30s/40s).

2) I don’t know why they adjust tmax so much.

3) I really, really want to know why Dec/Jan/Feb (and to a lesser degree Nov and Mar) are so heavily manipulated. The adjustments can change by .5C from year to year. Bizarre.

Click for bigger.


v2.5.0.20140509_tavg_final-raw_ushcn v2.5.0.20140509_tmin_final-raw_ushcn v2.5.0.20140509_tmax_final-raw_ushcn