A quick update for sea ice extent:
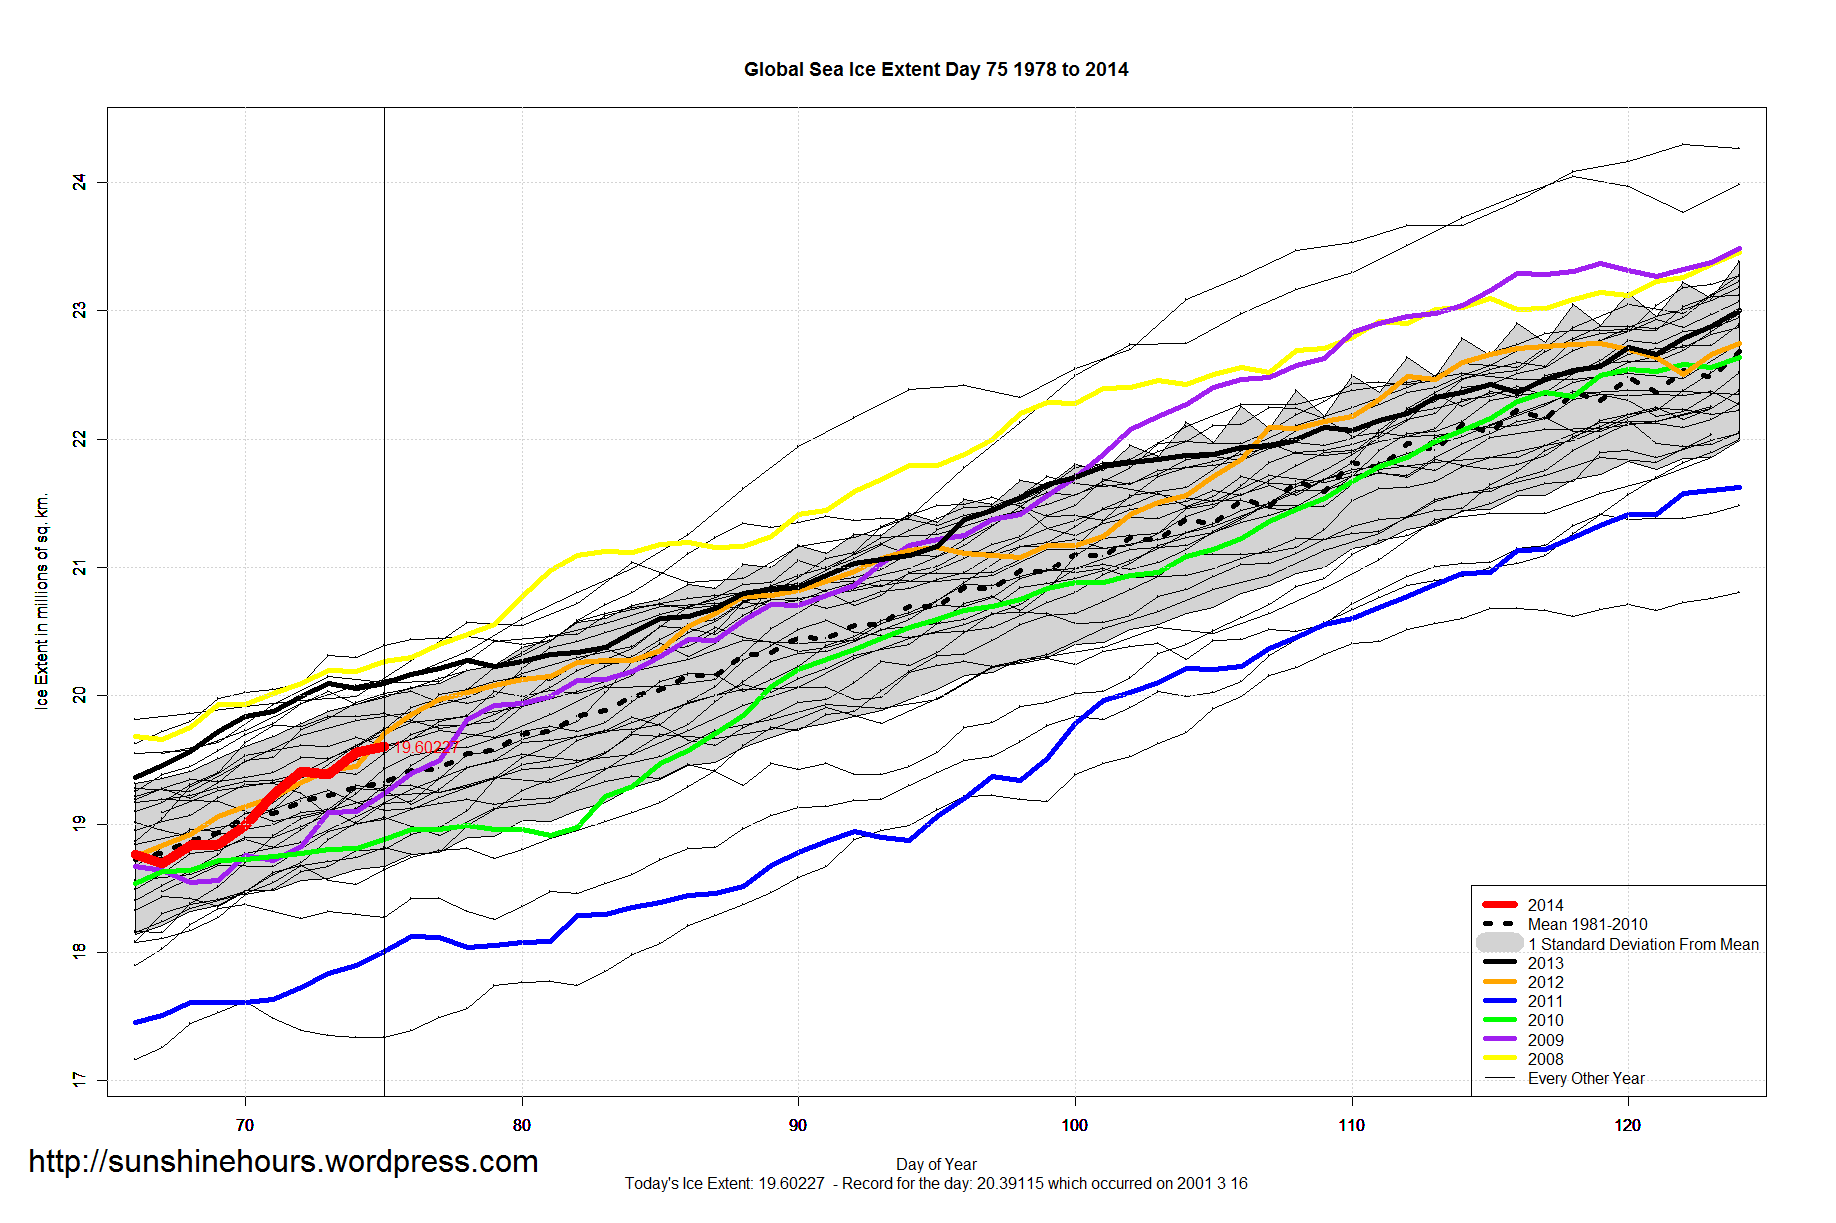
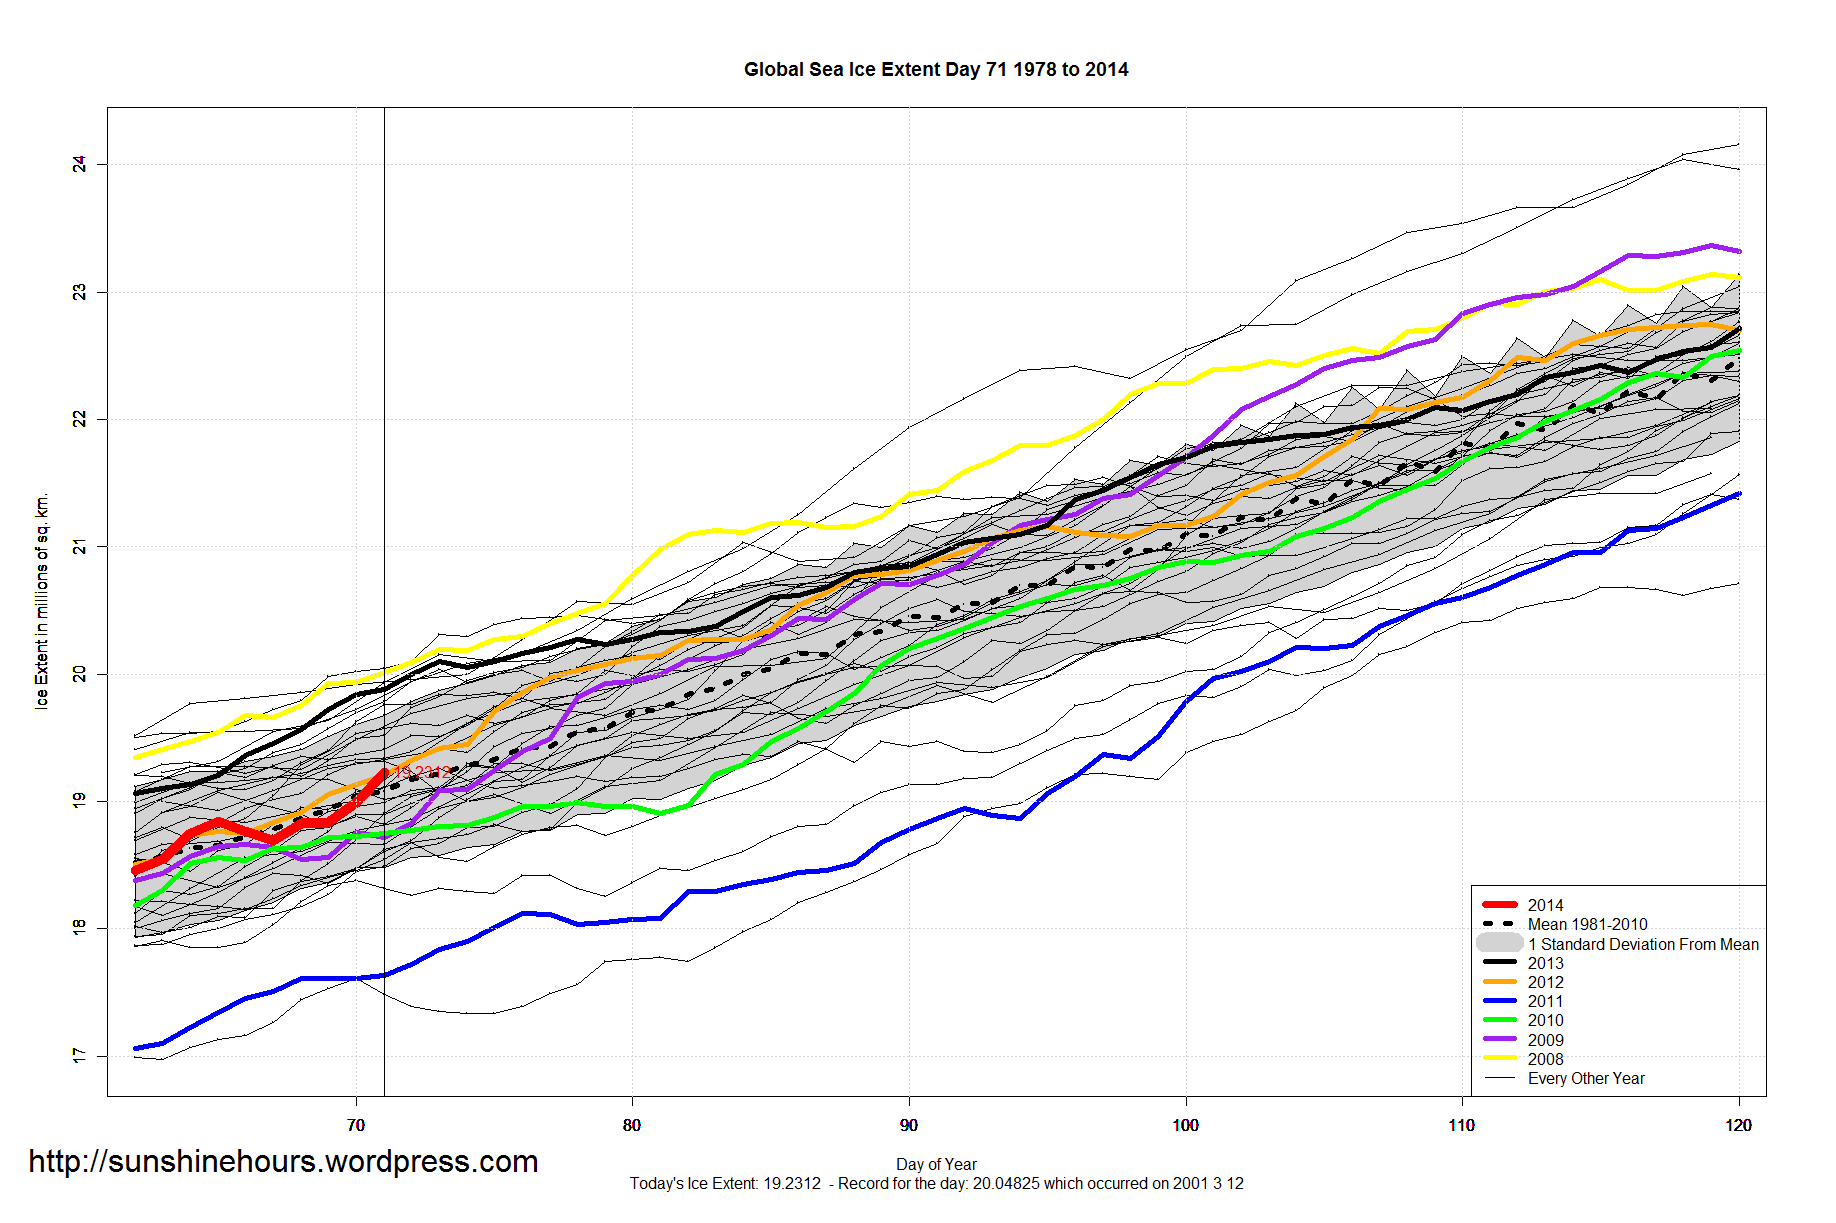
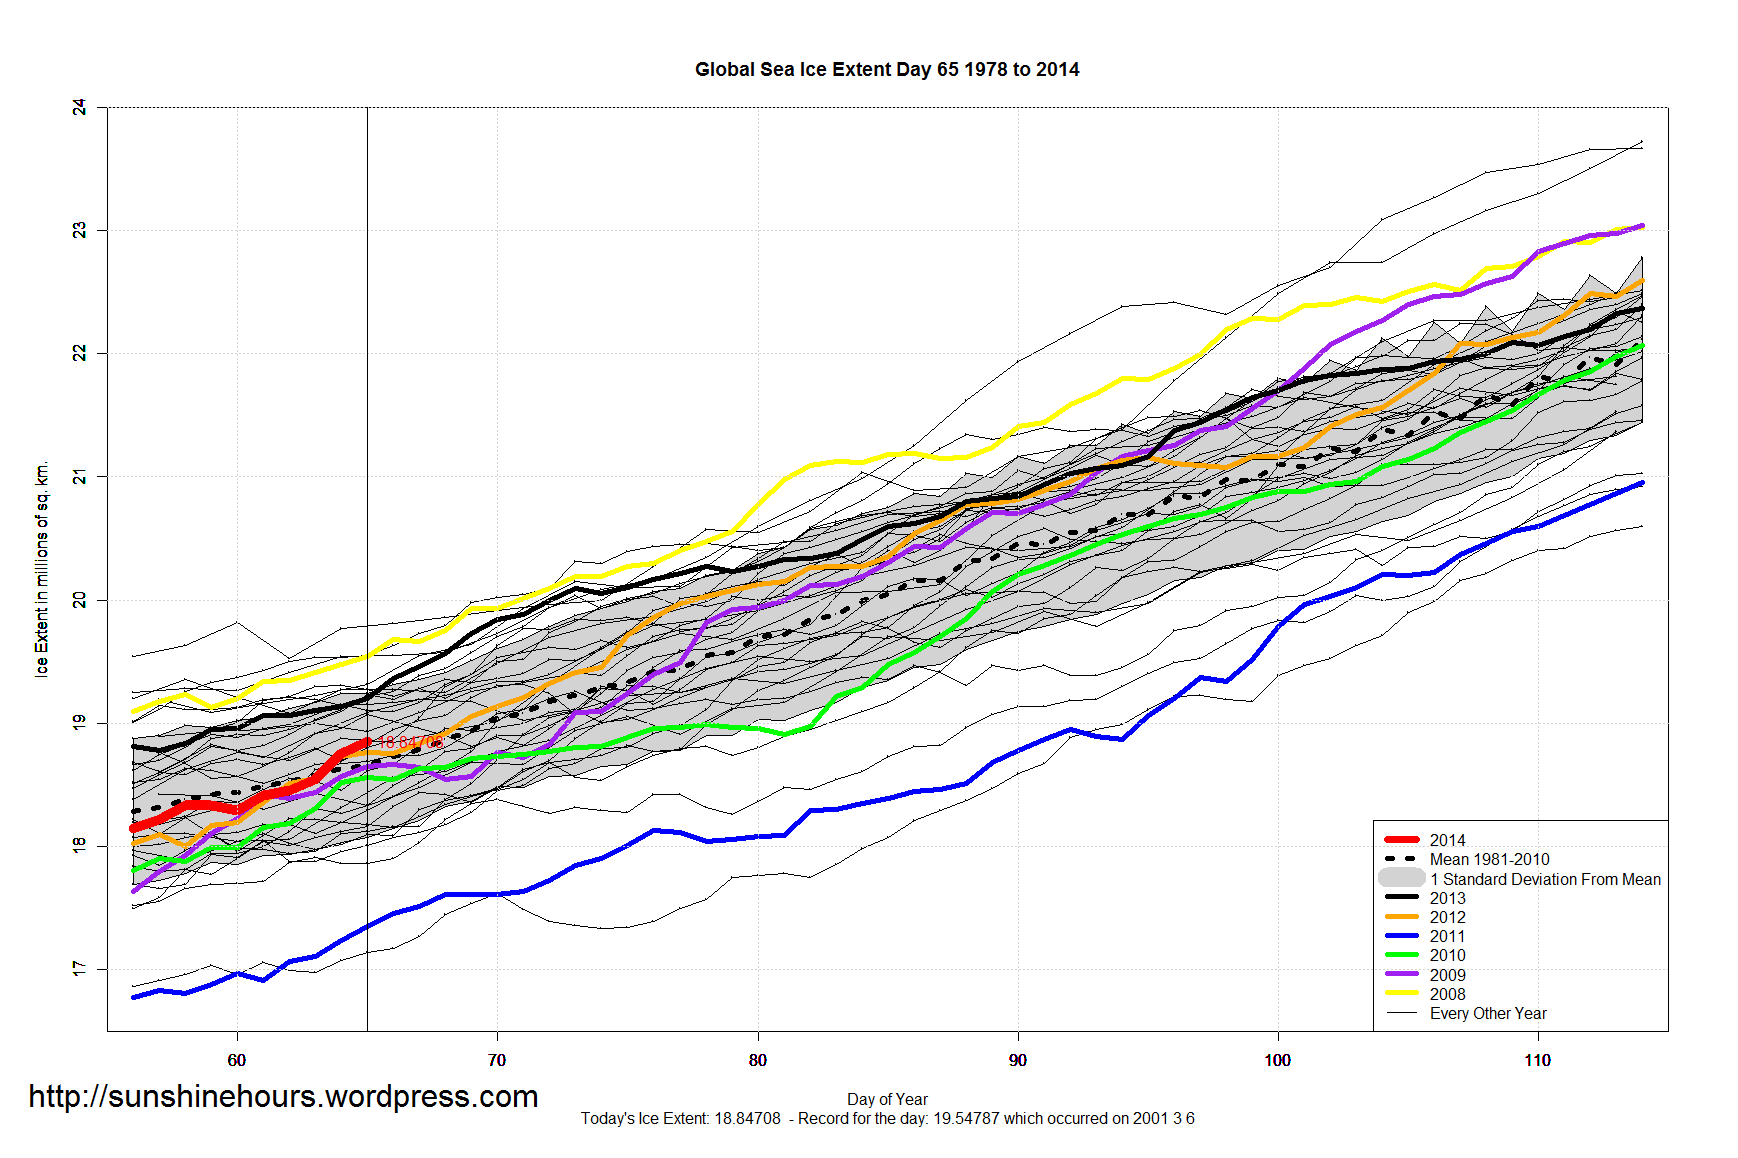
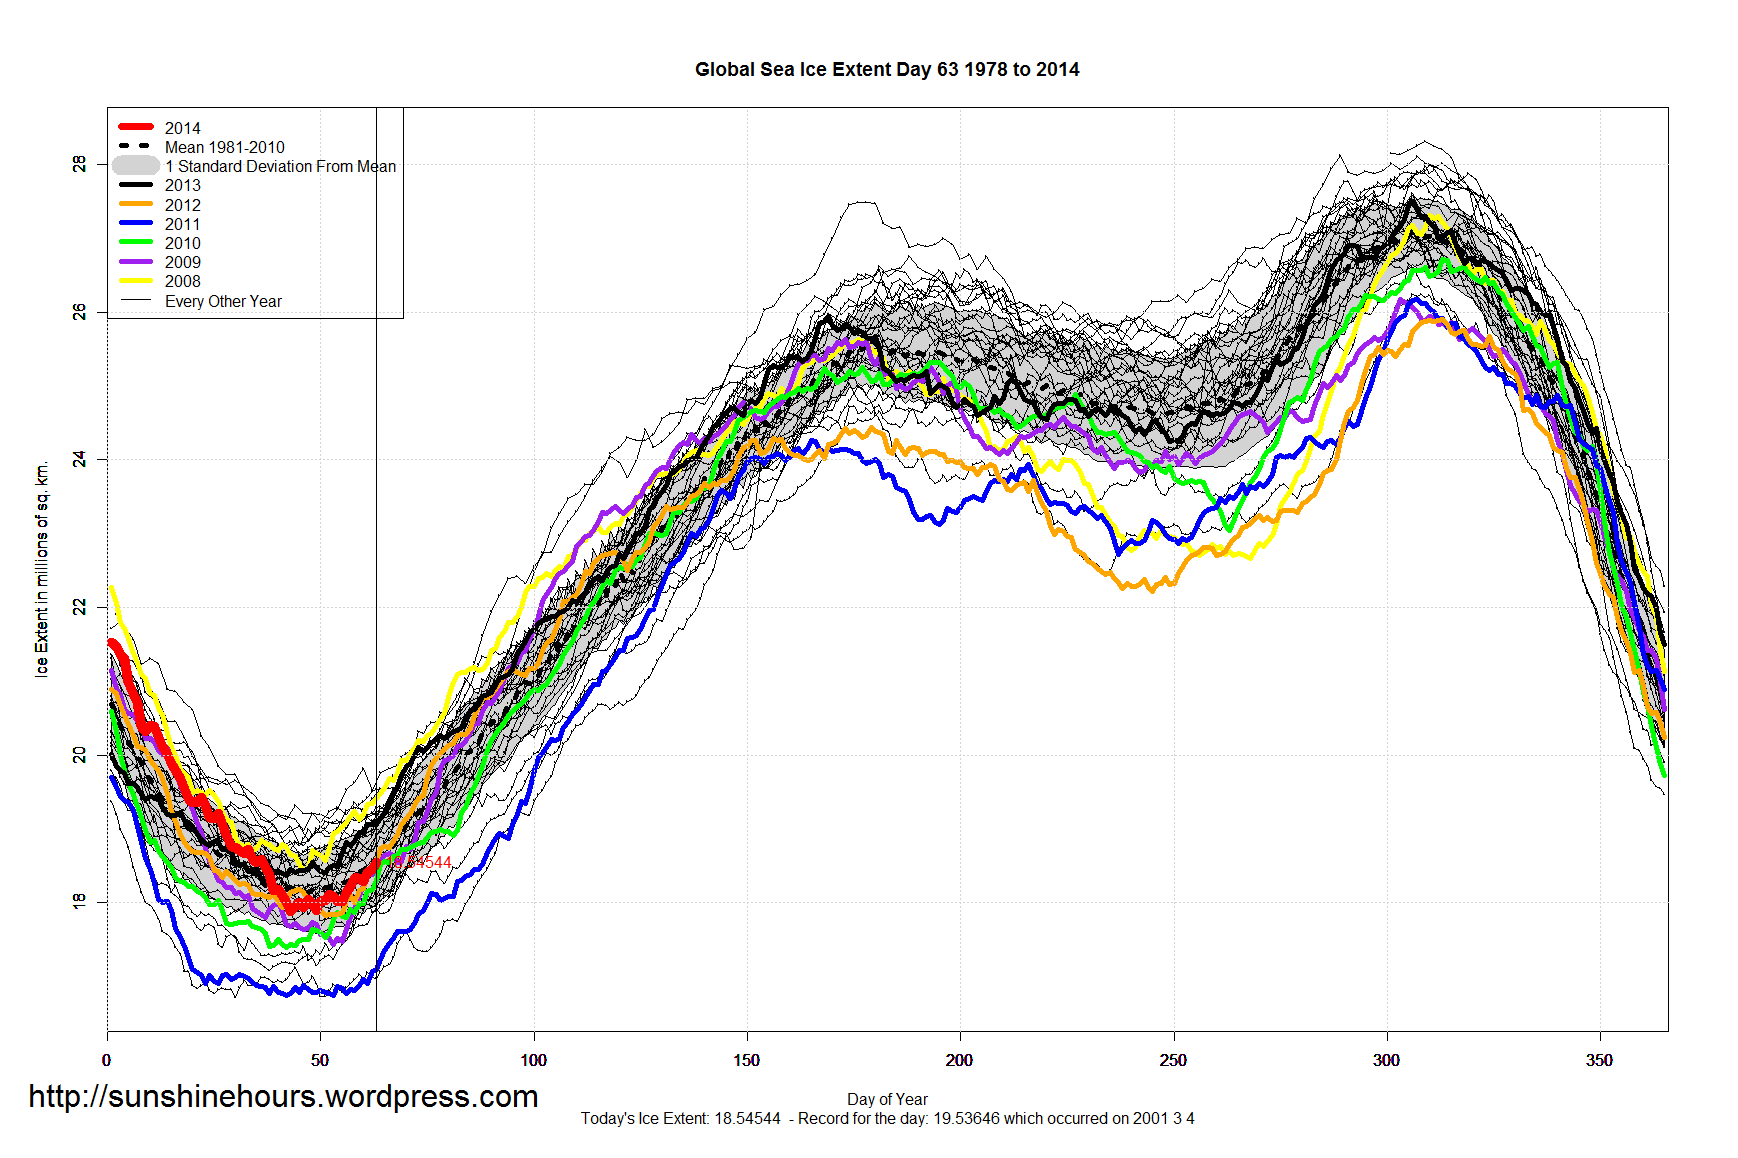
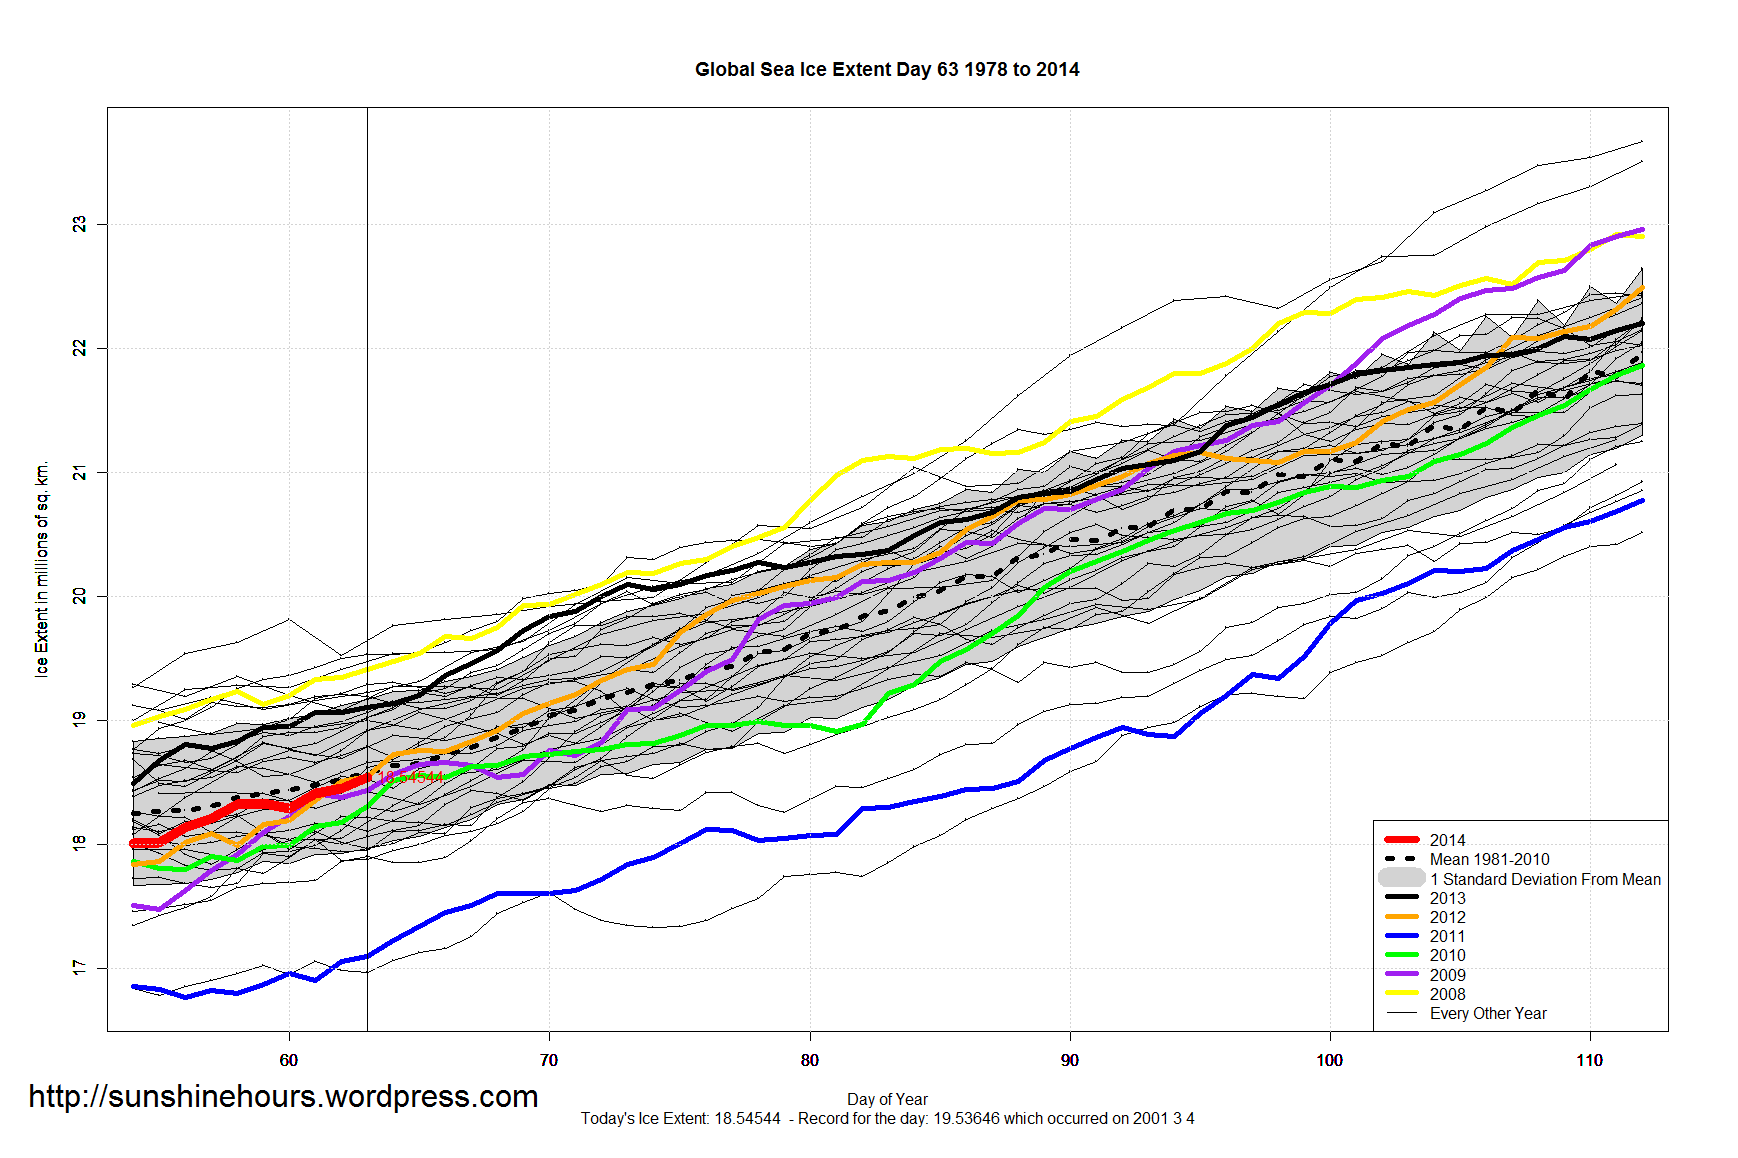
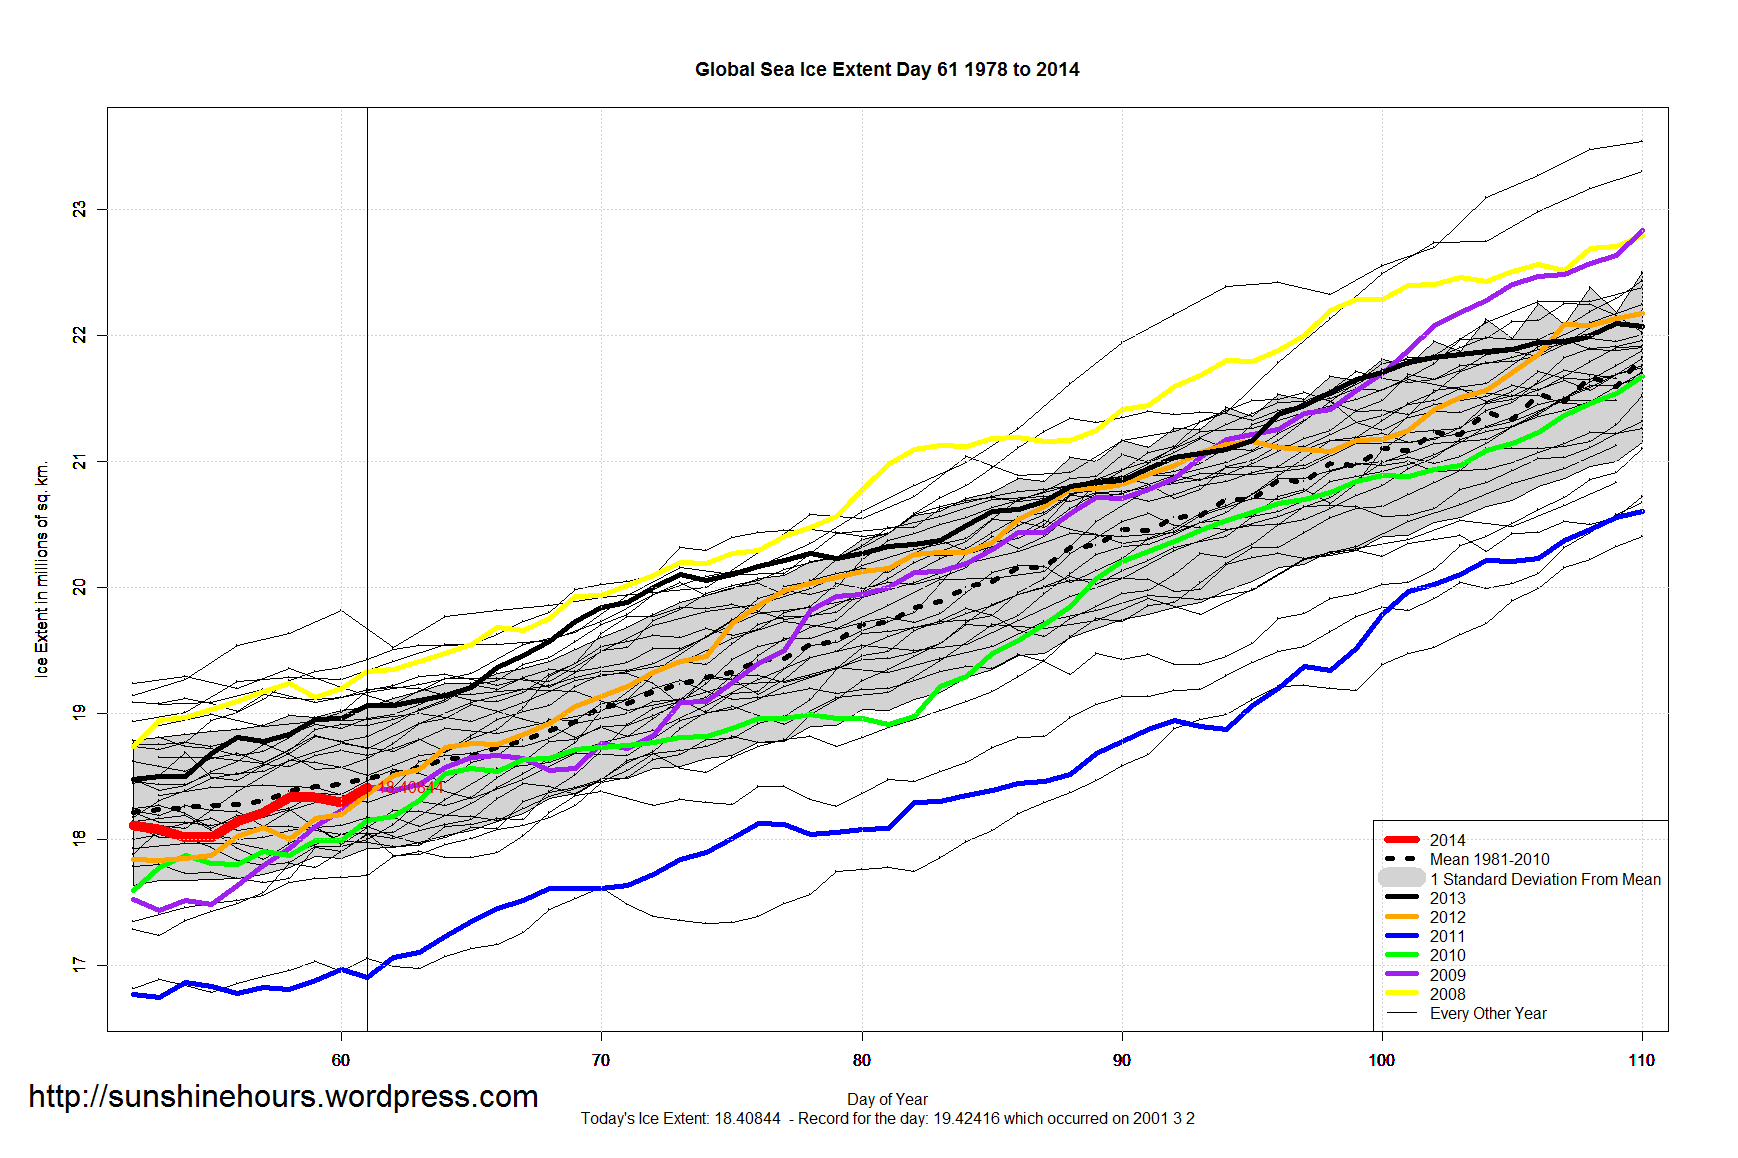
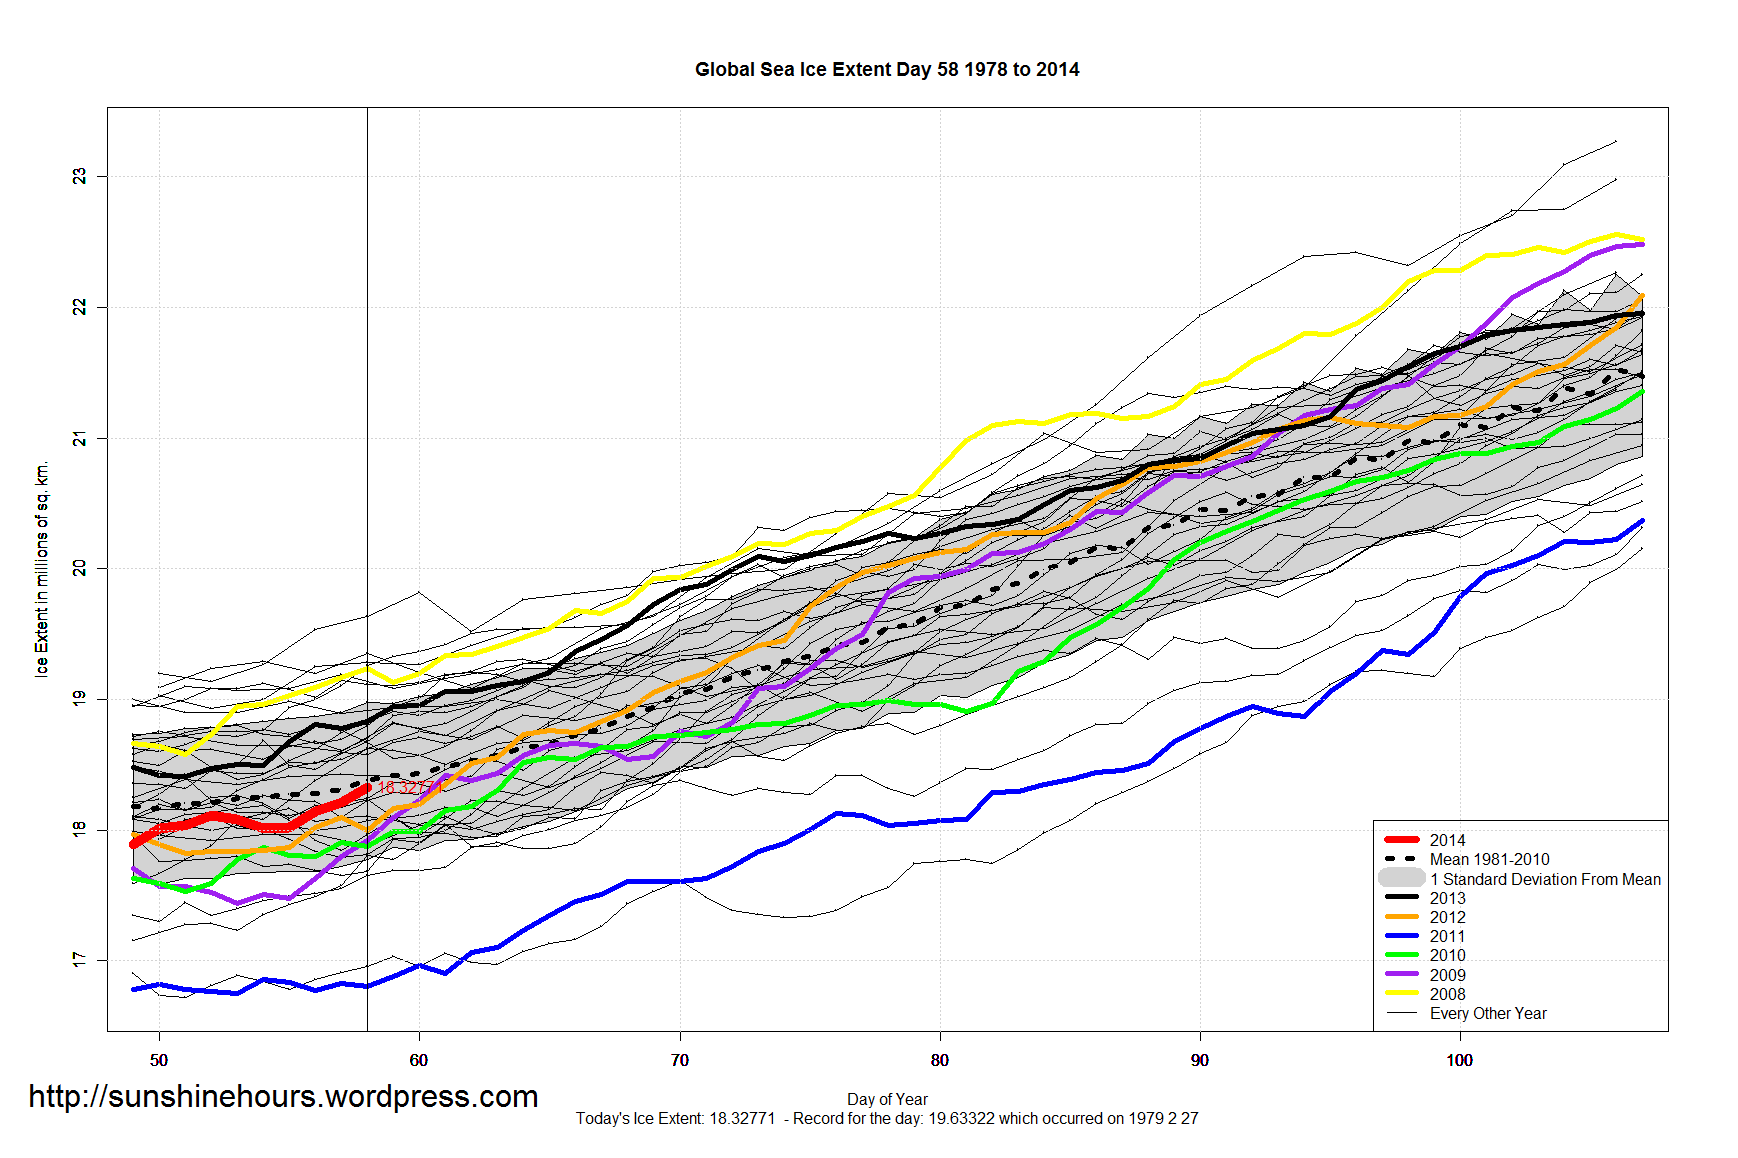
- Global Sea Ice is 430,000 sq km above the 1981-2010 mean.
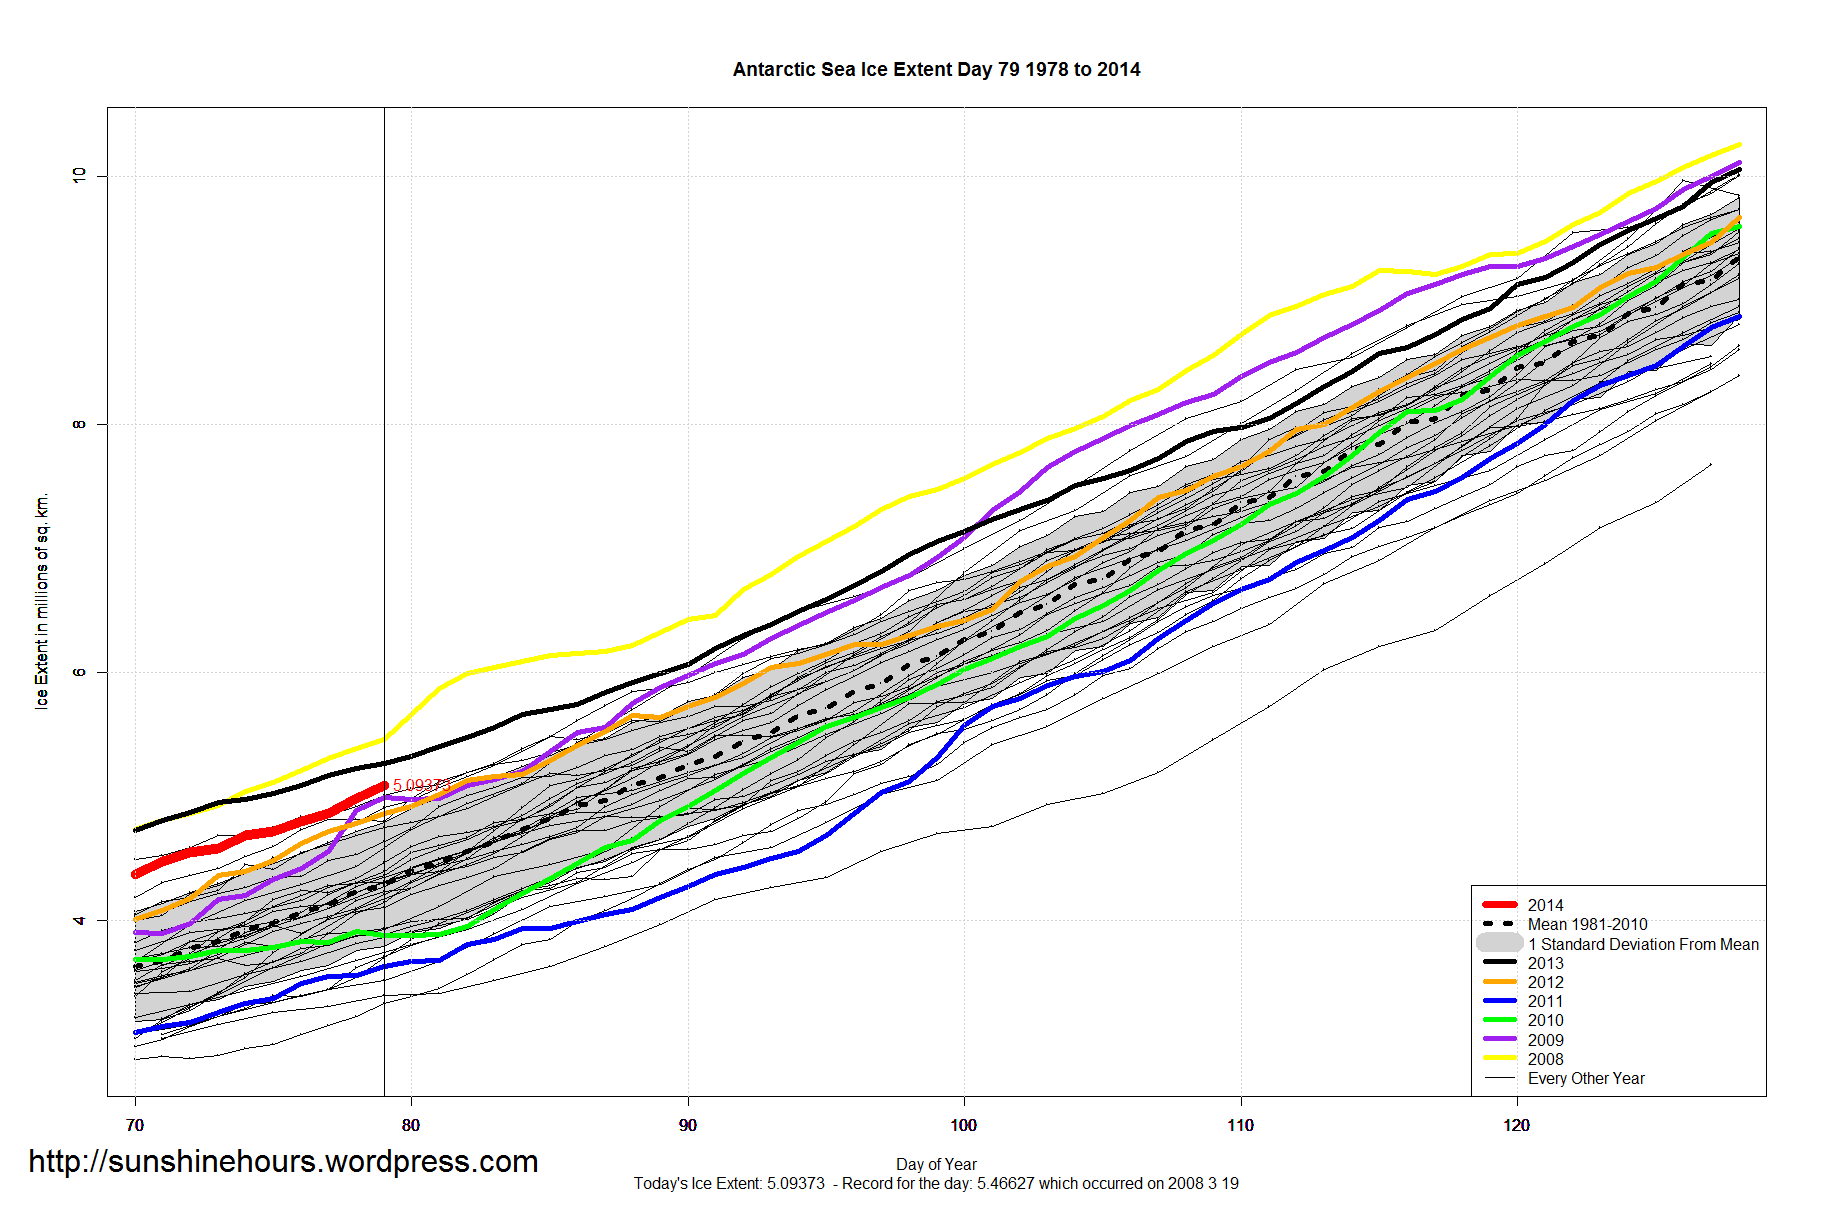
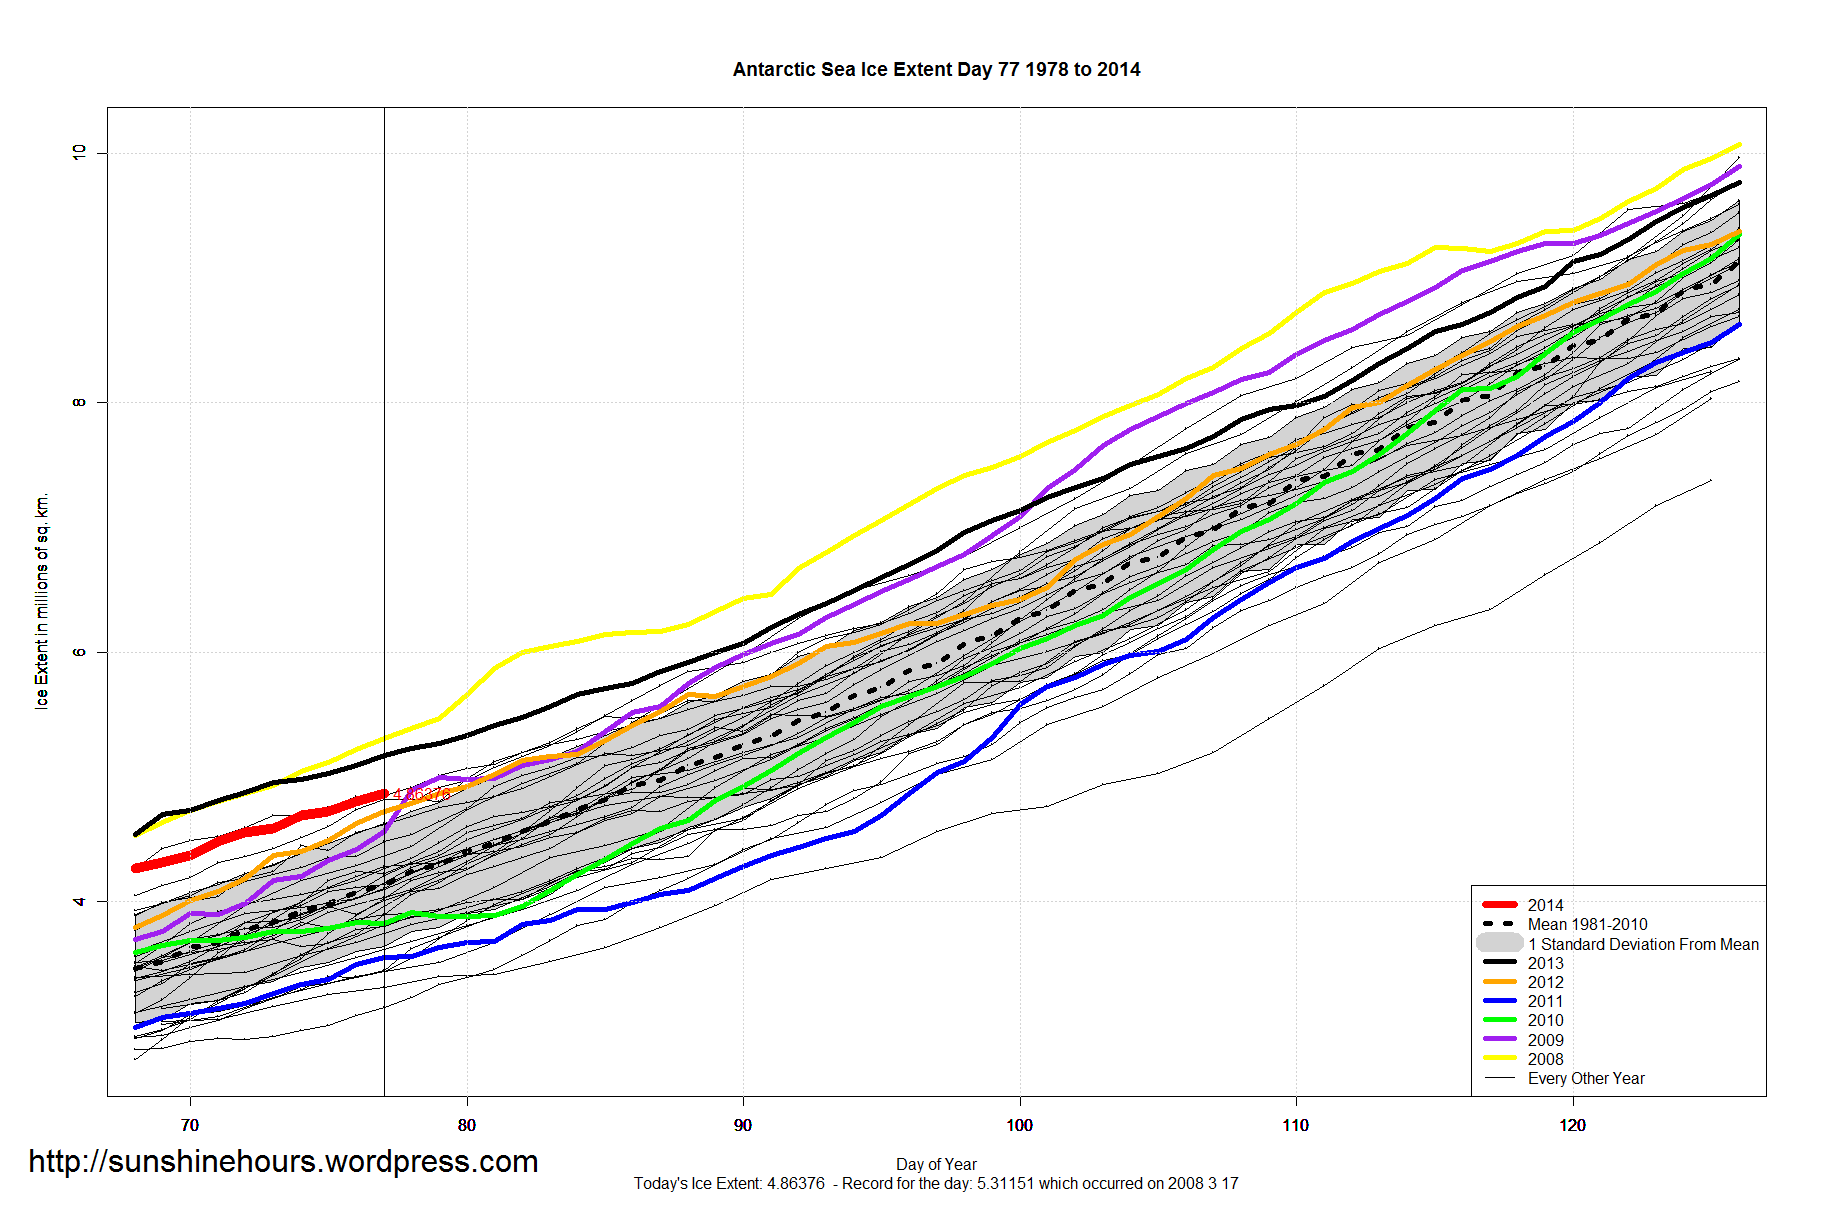
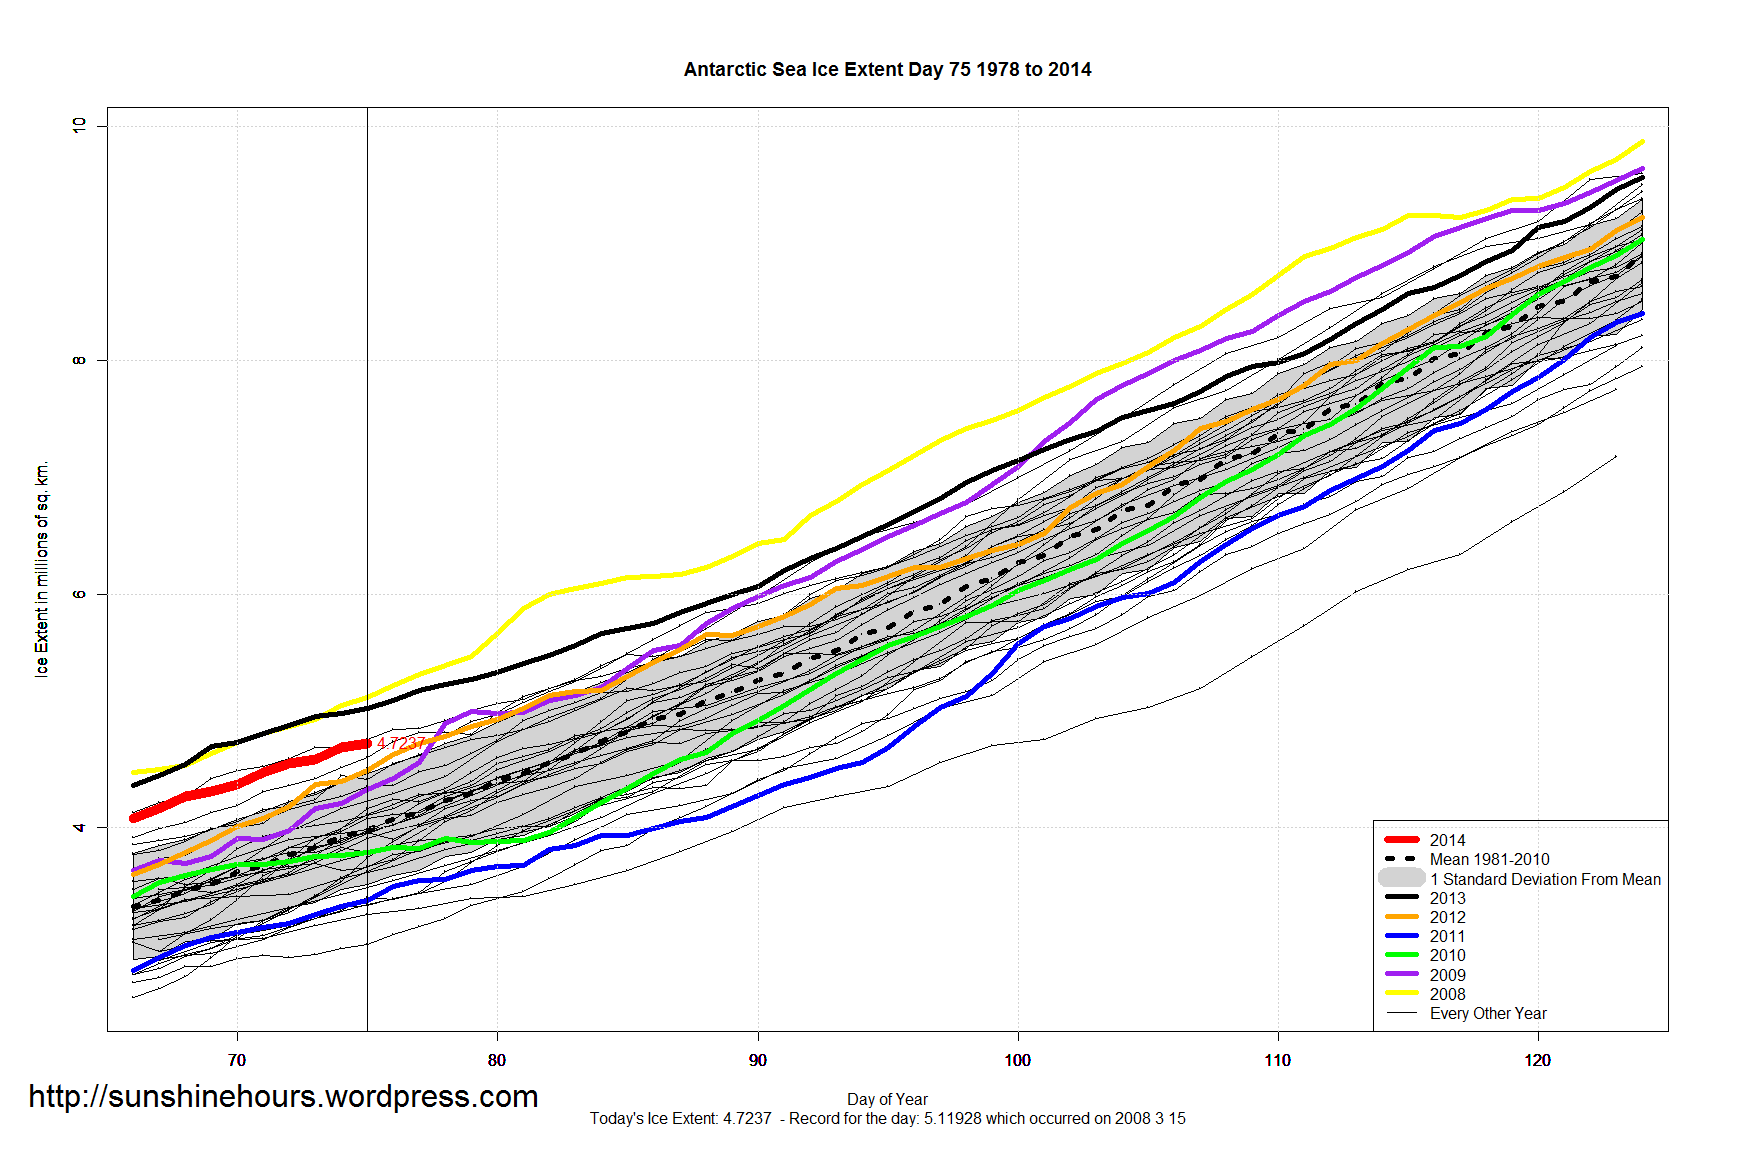
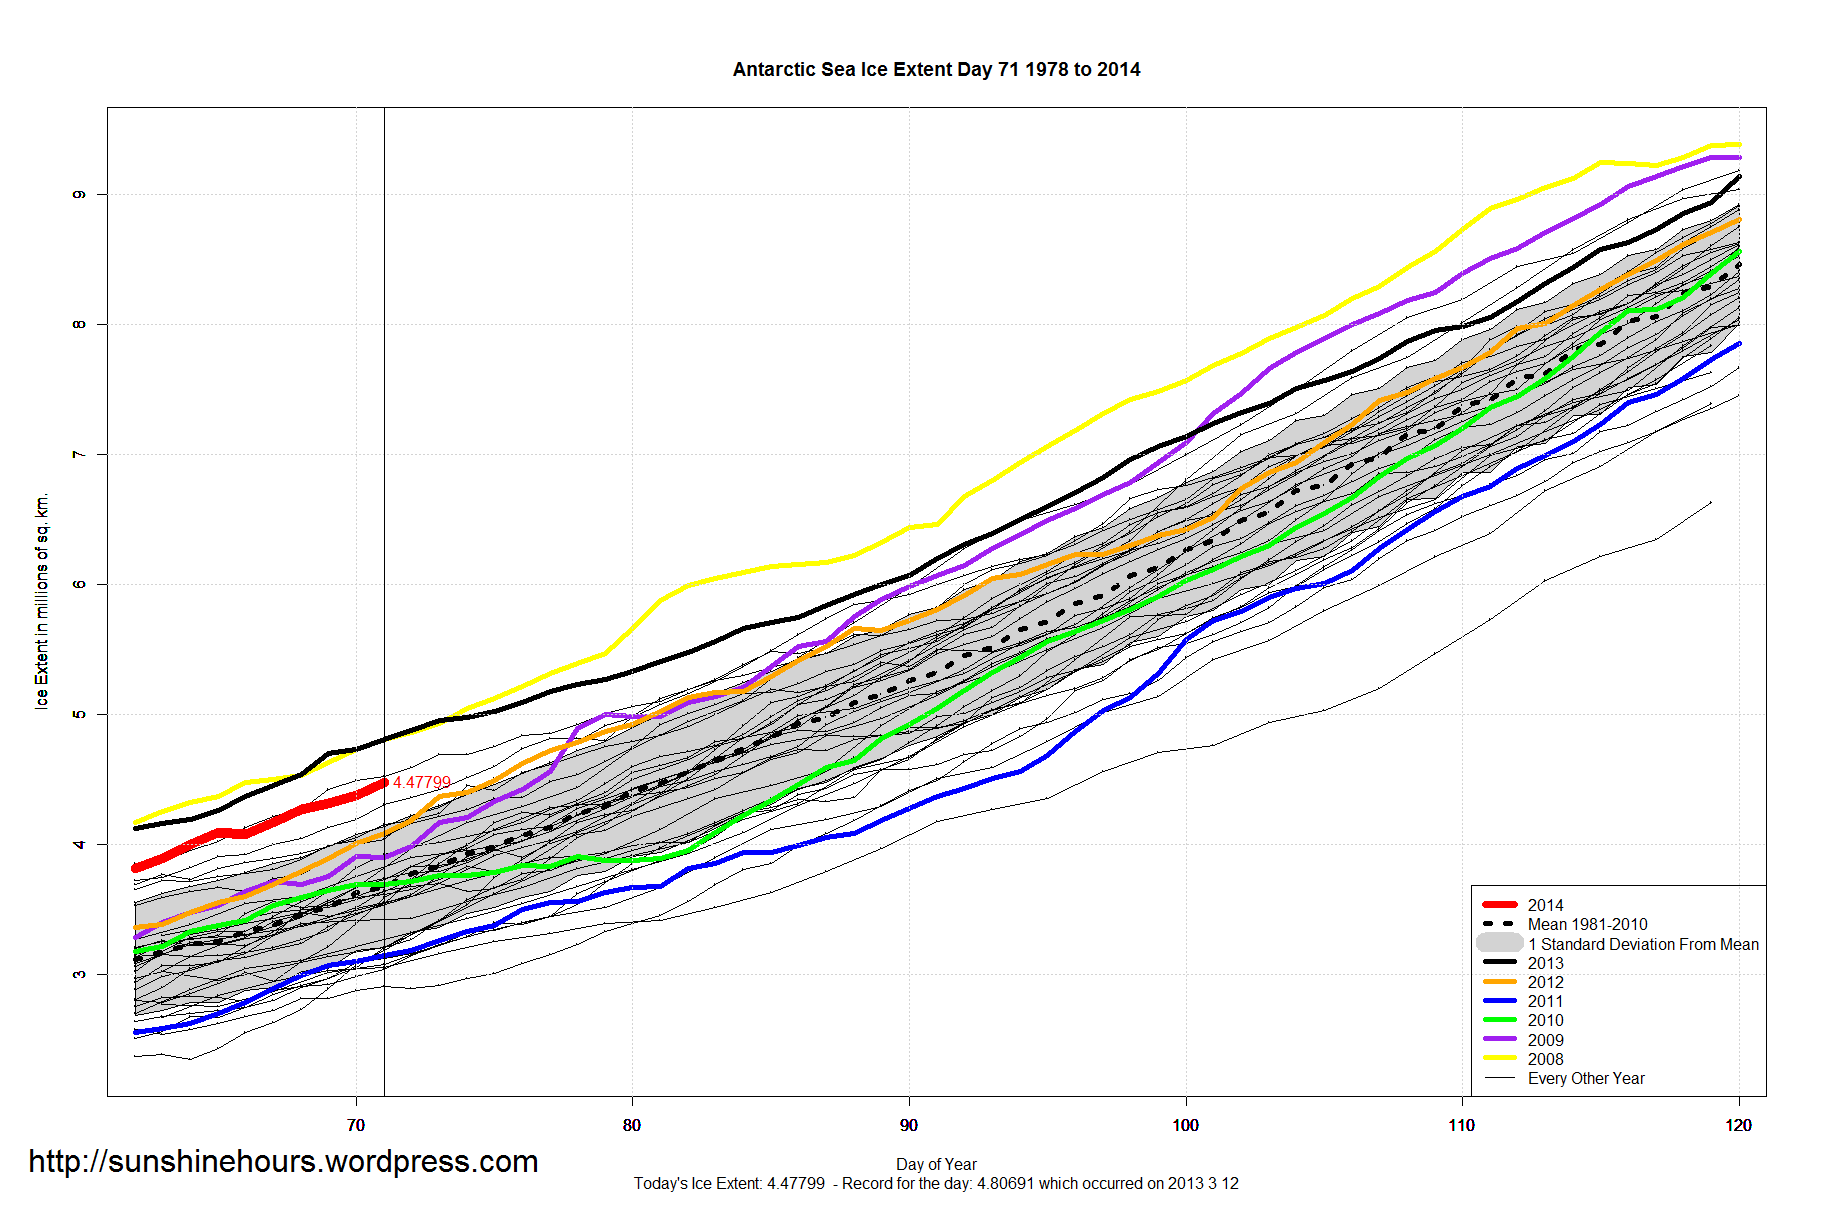
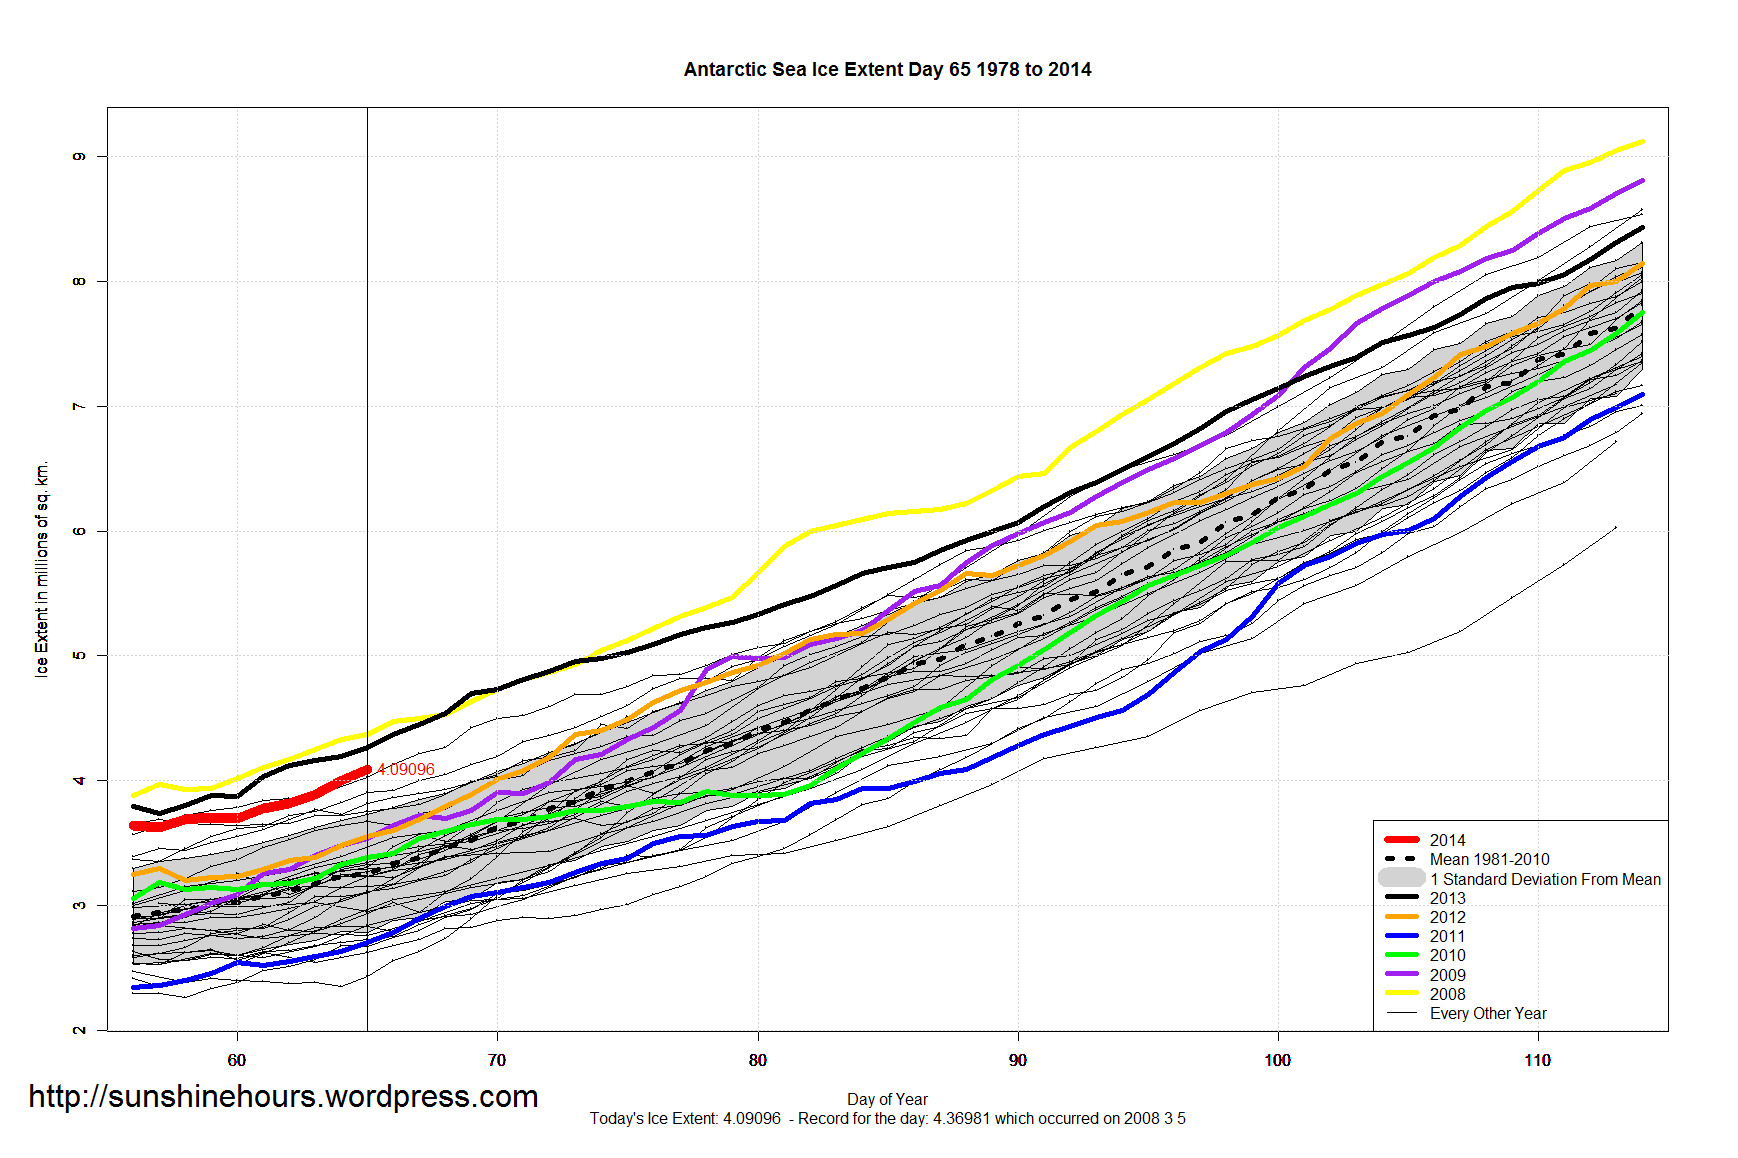
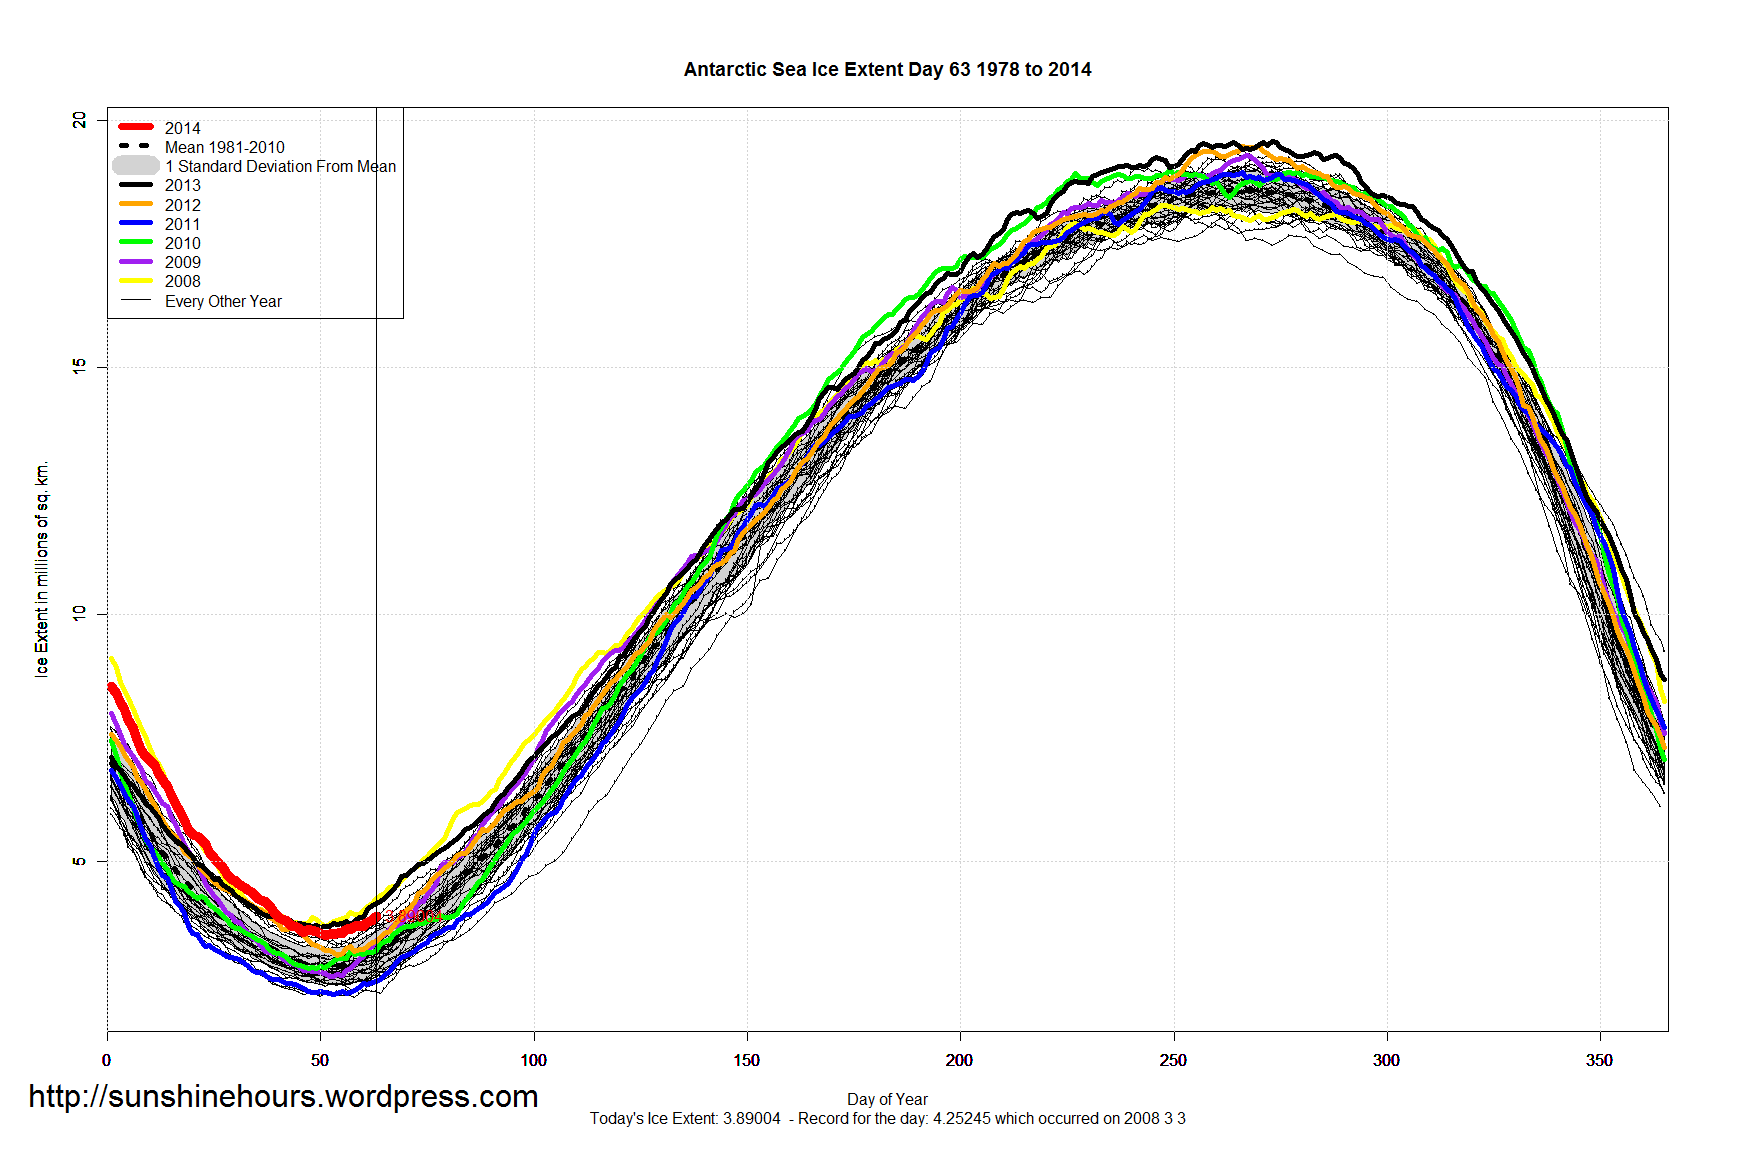
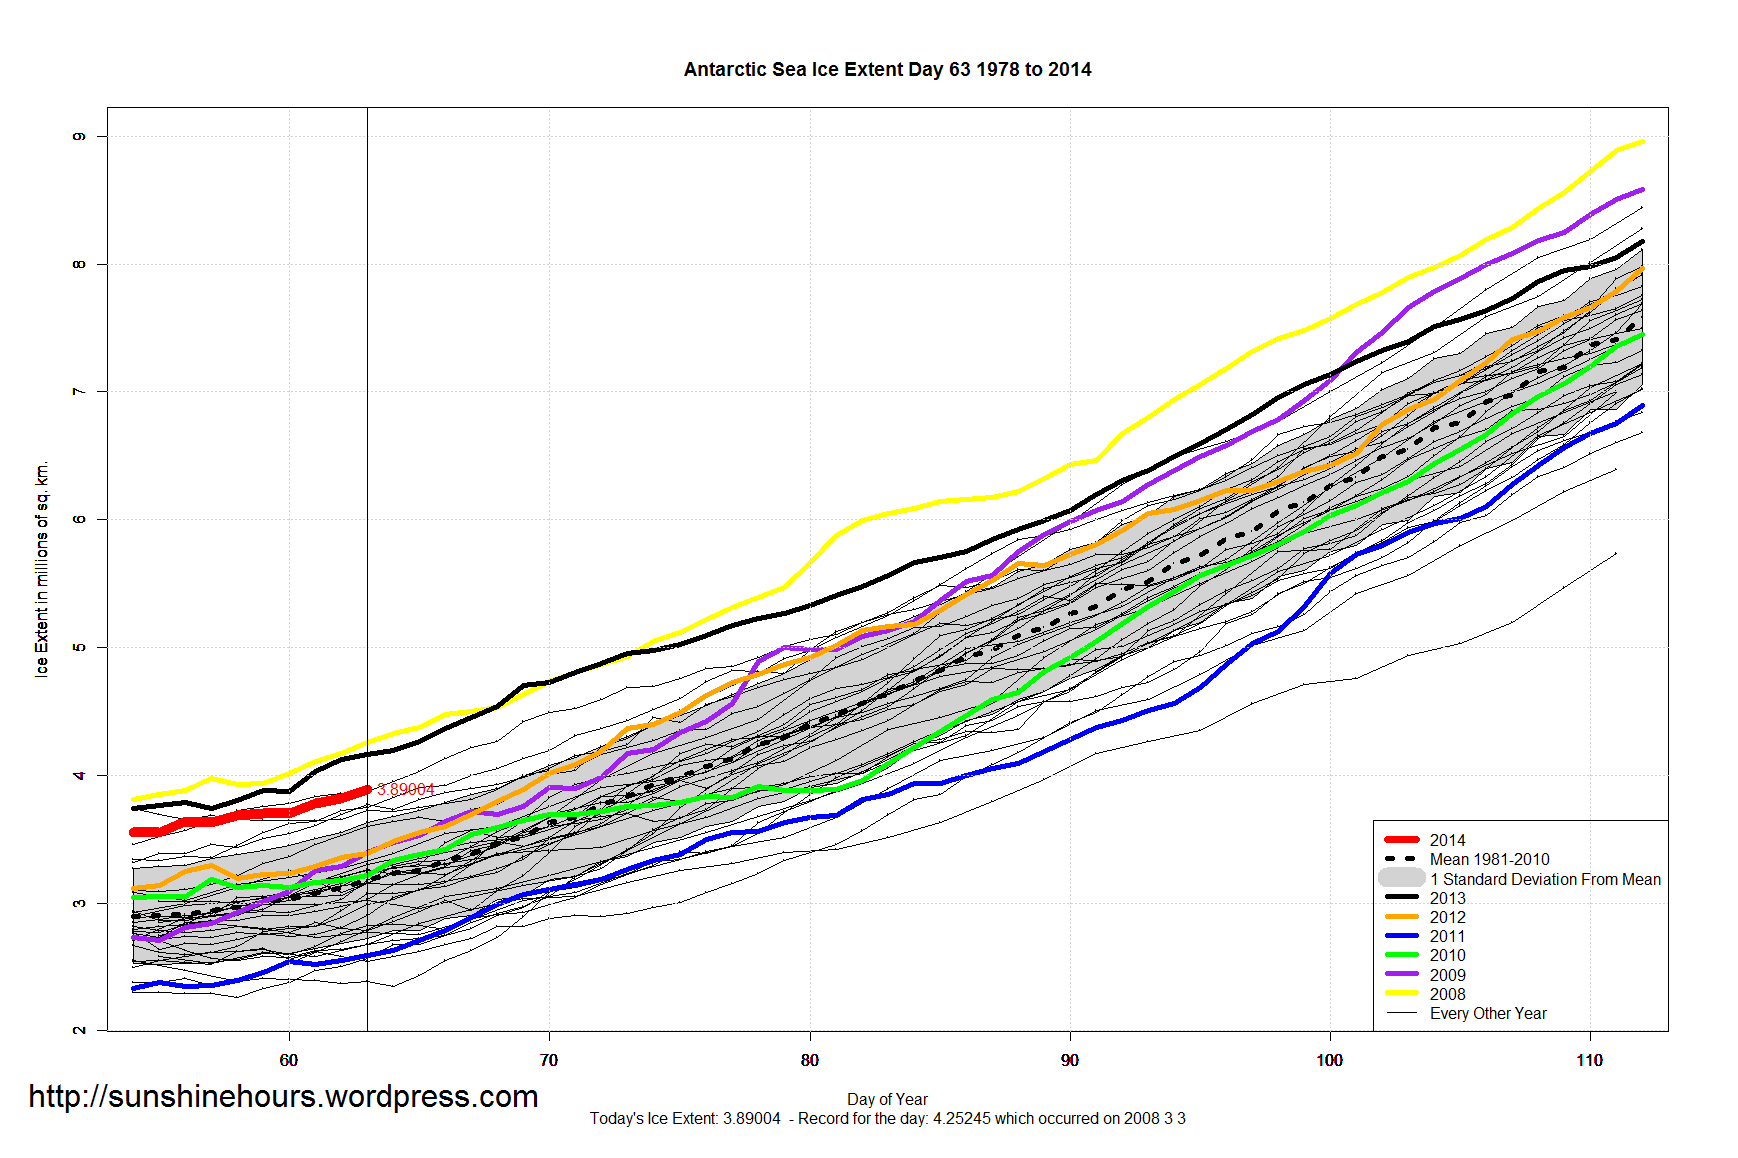
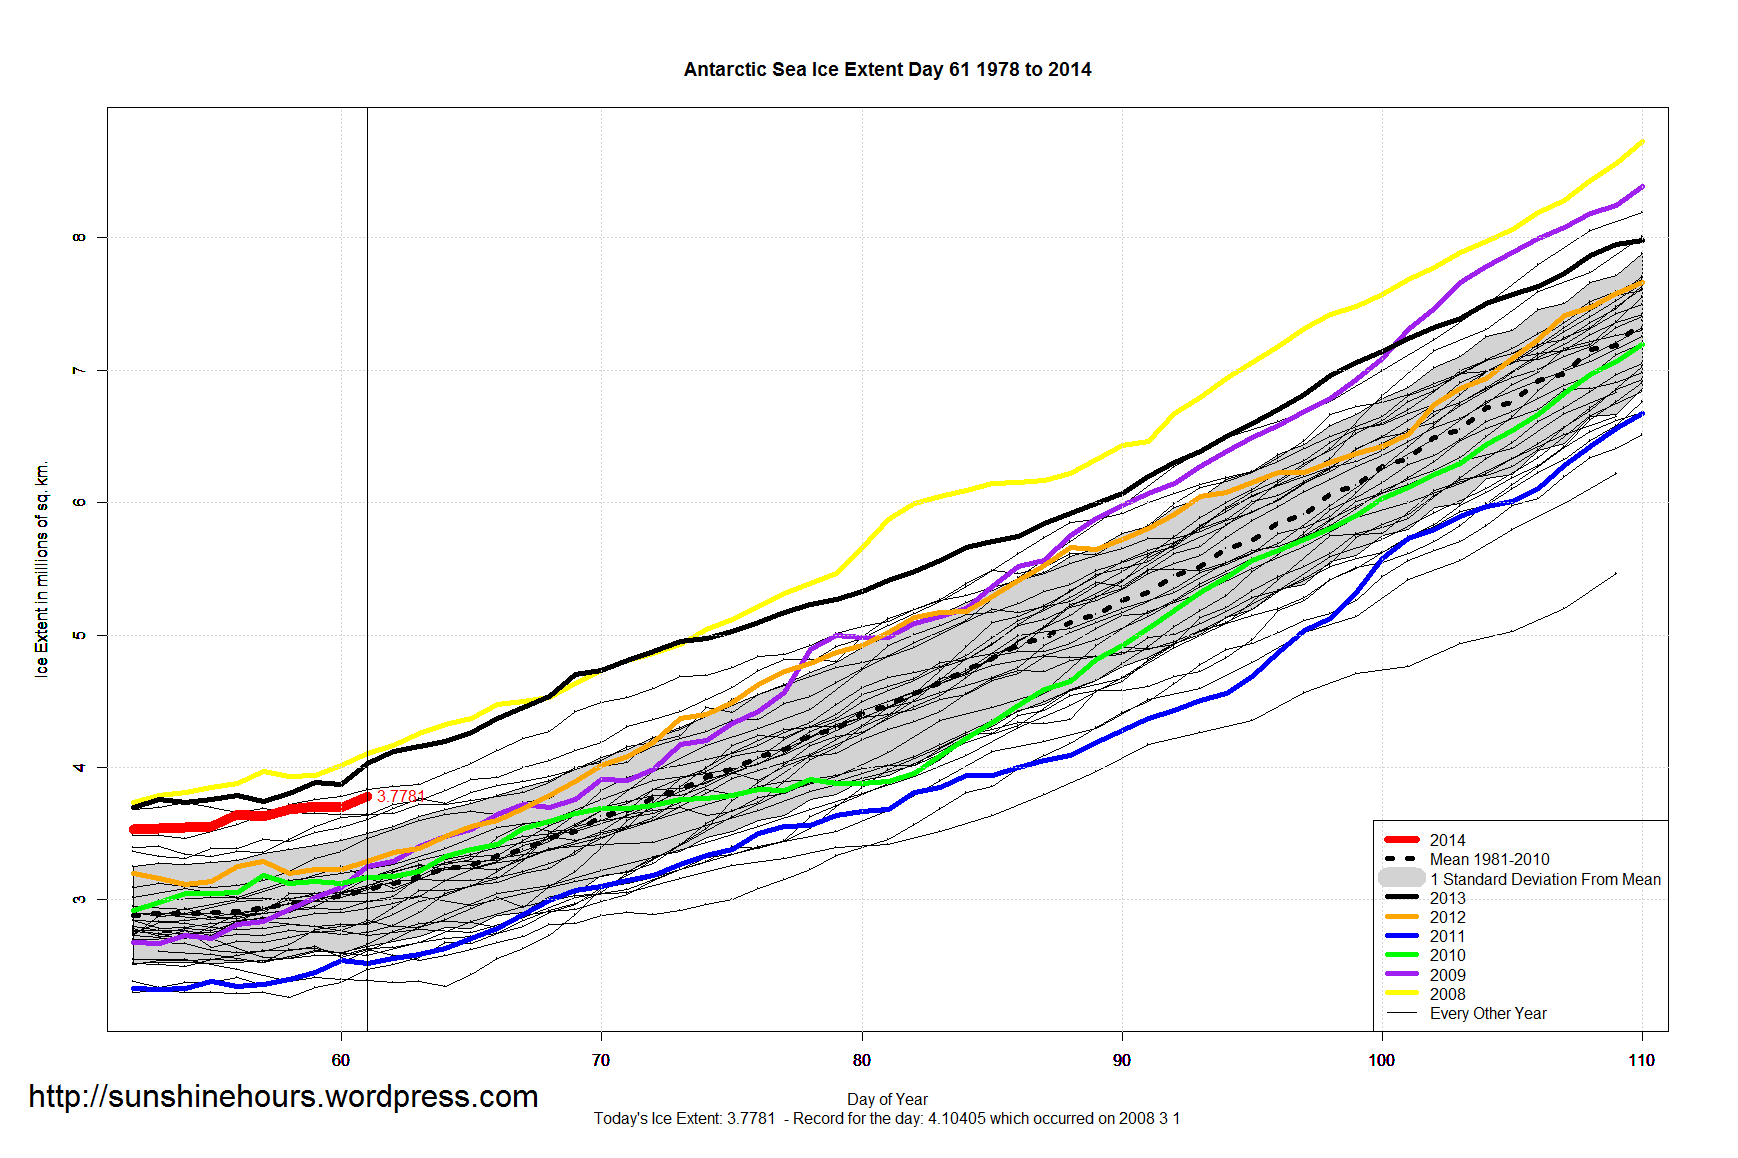
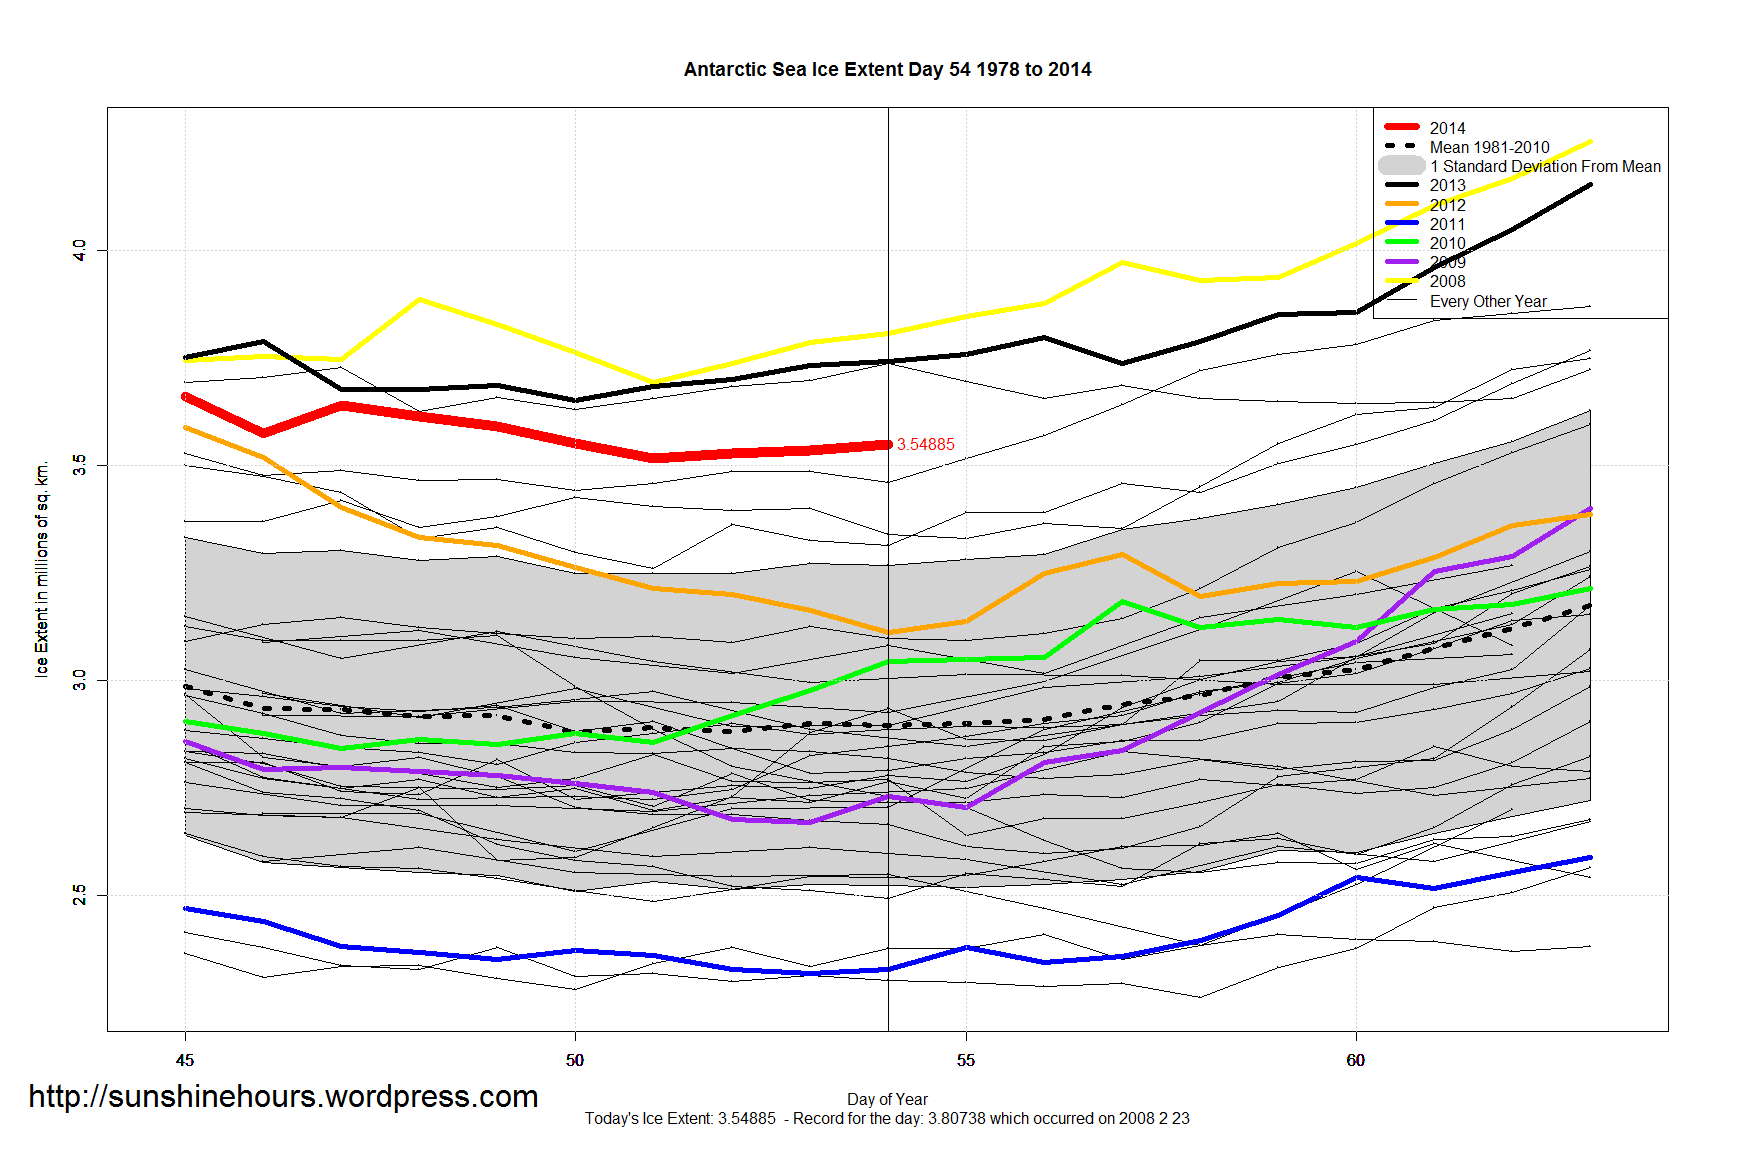
- Antarctic Sea Ice is 800,000 sq km above the 1981-2010 mean. 3rd highest for this day.
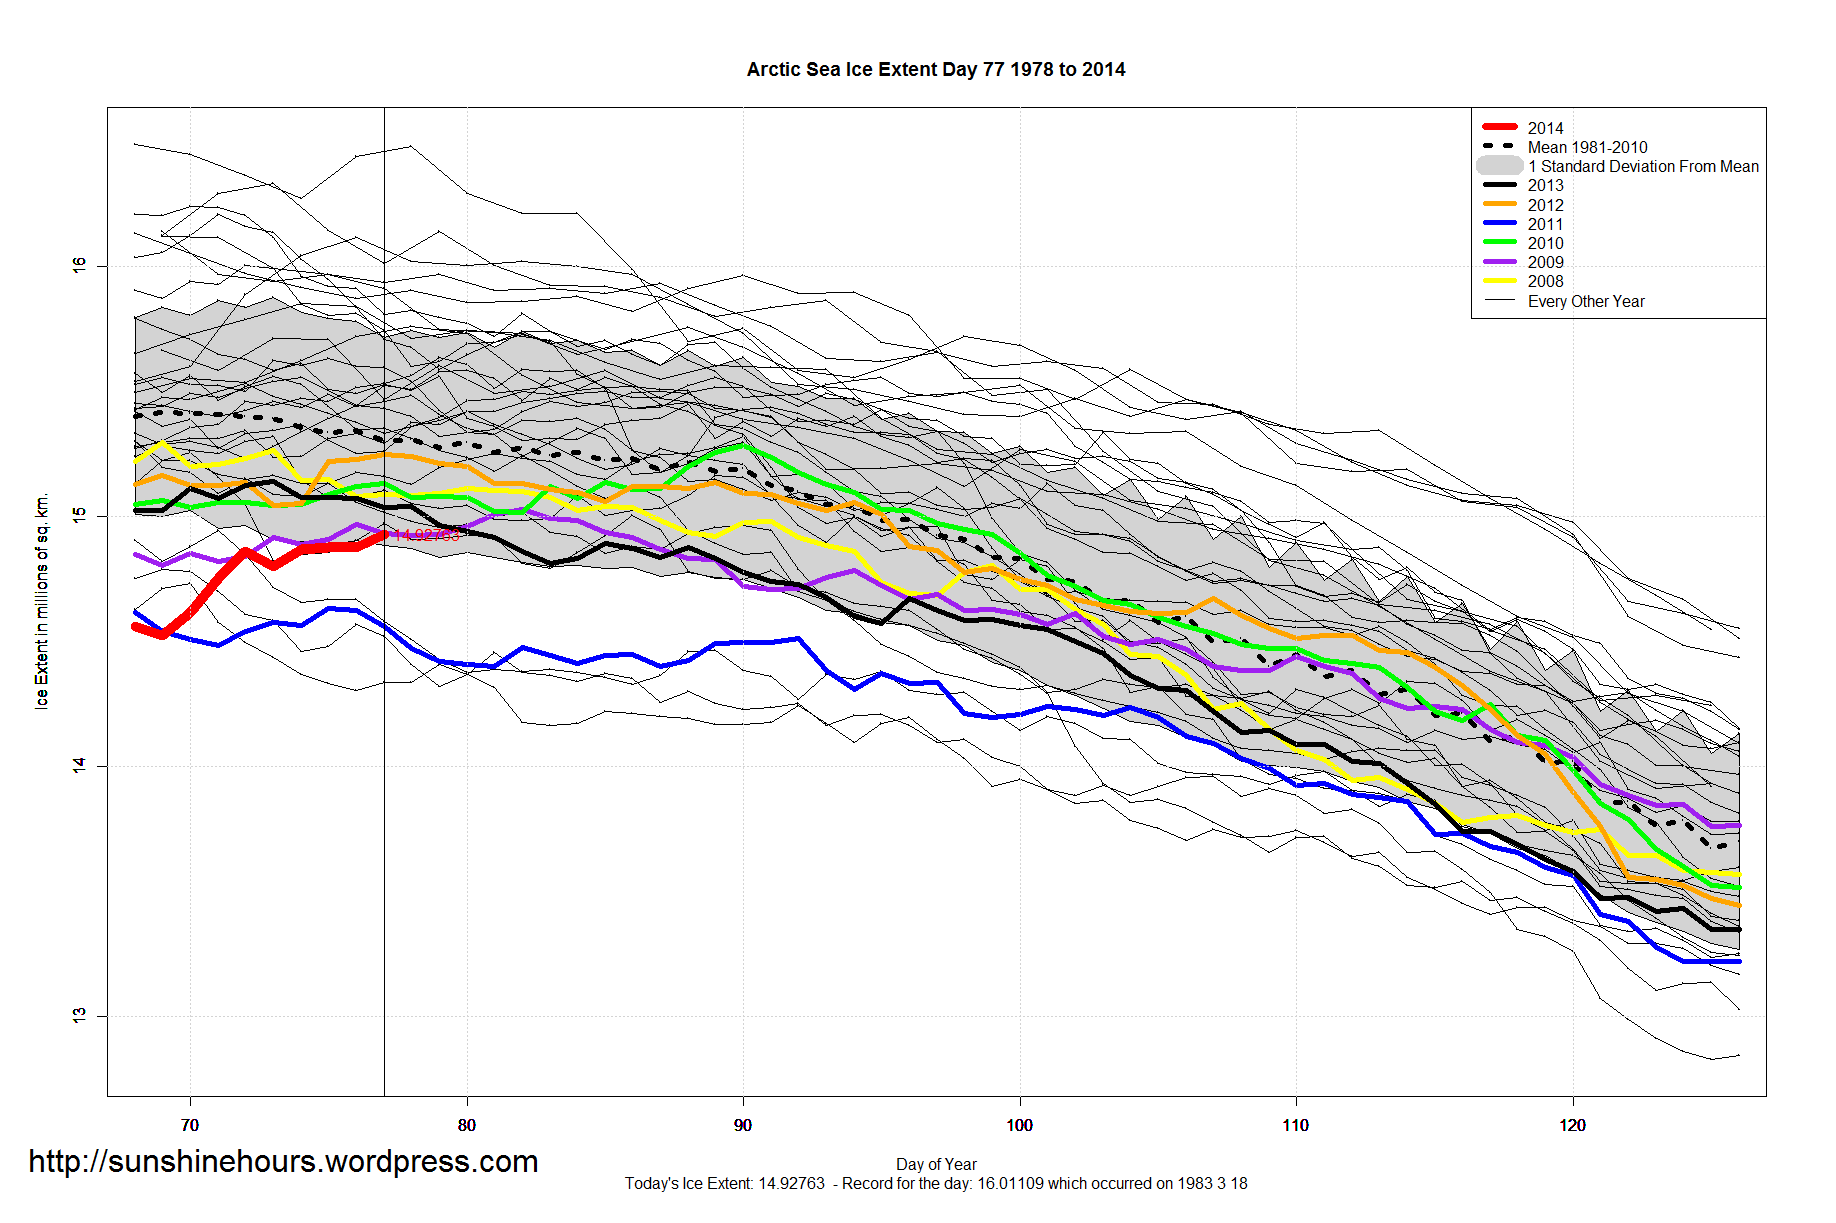
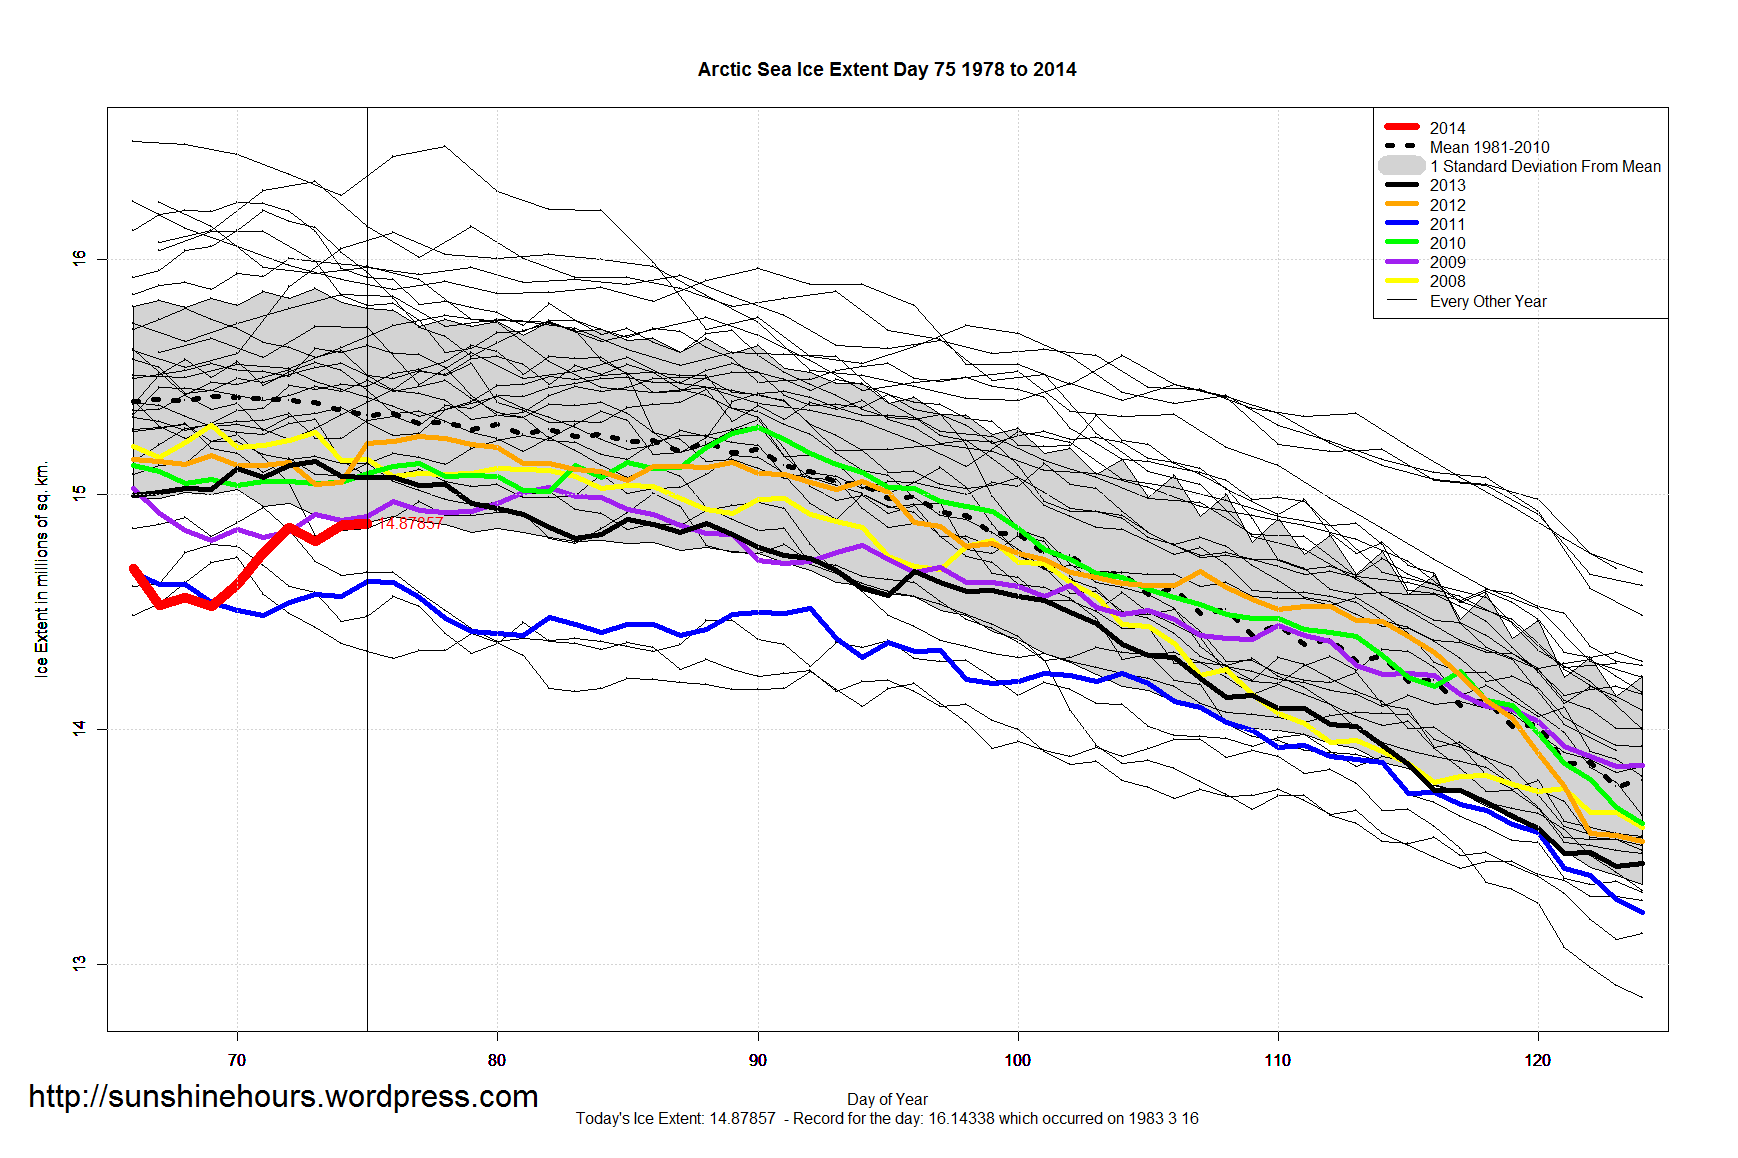
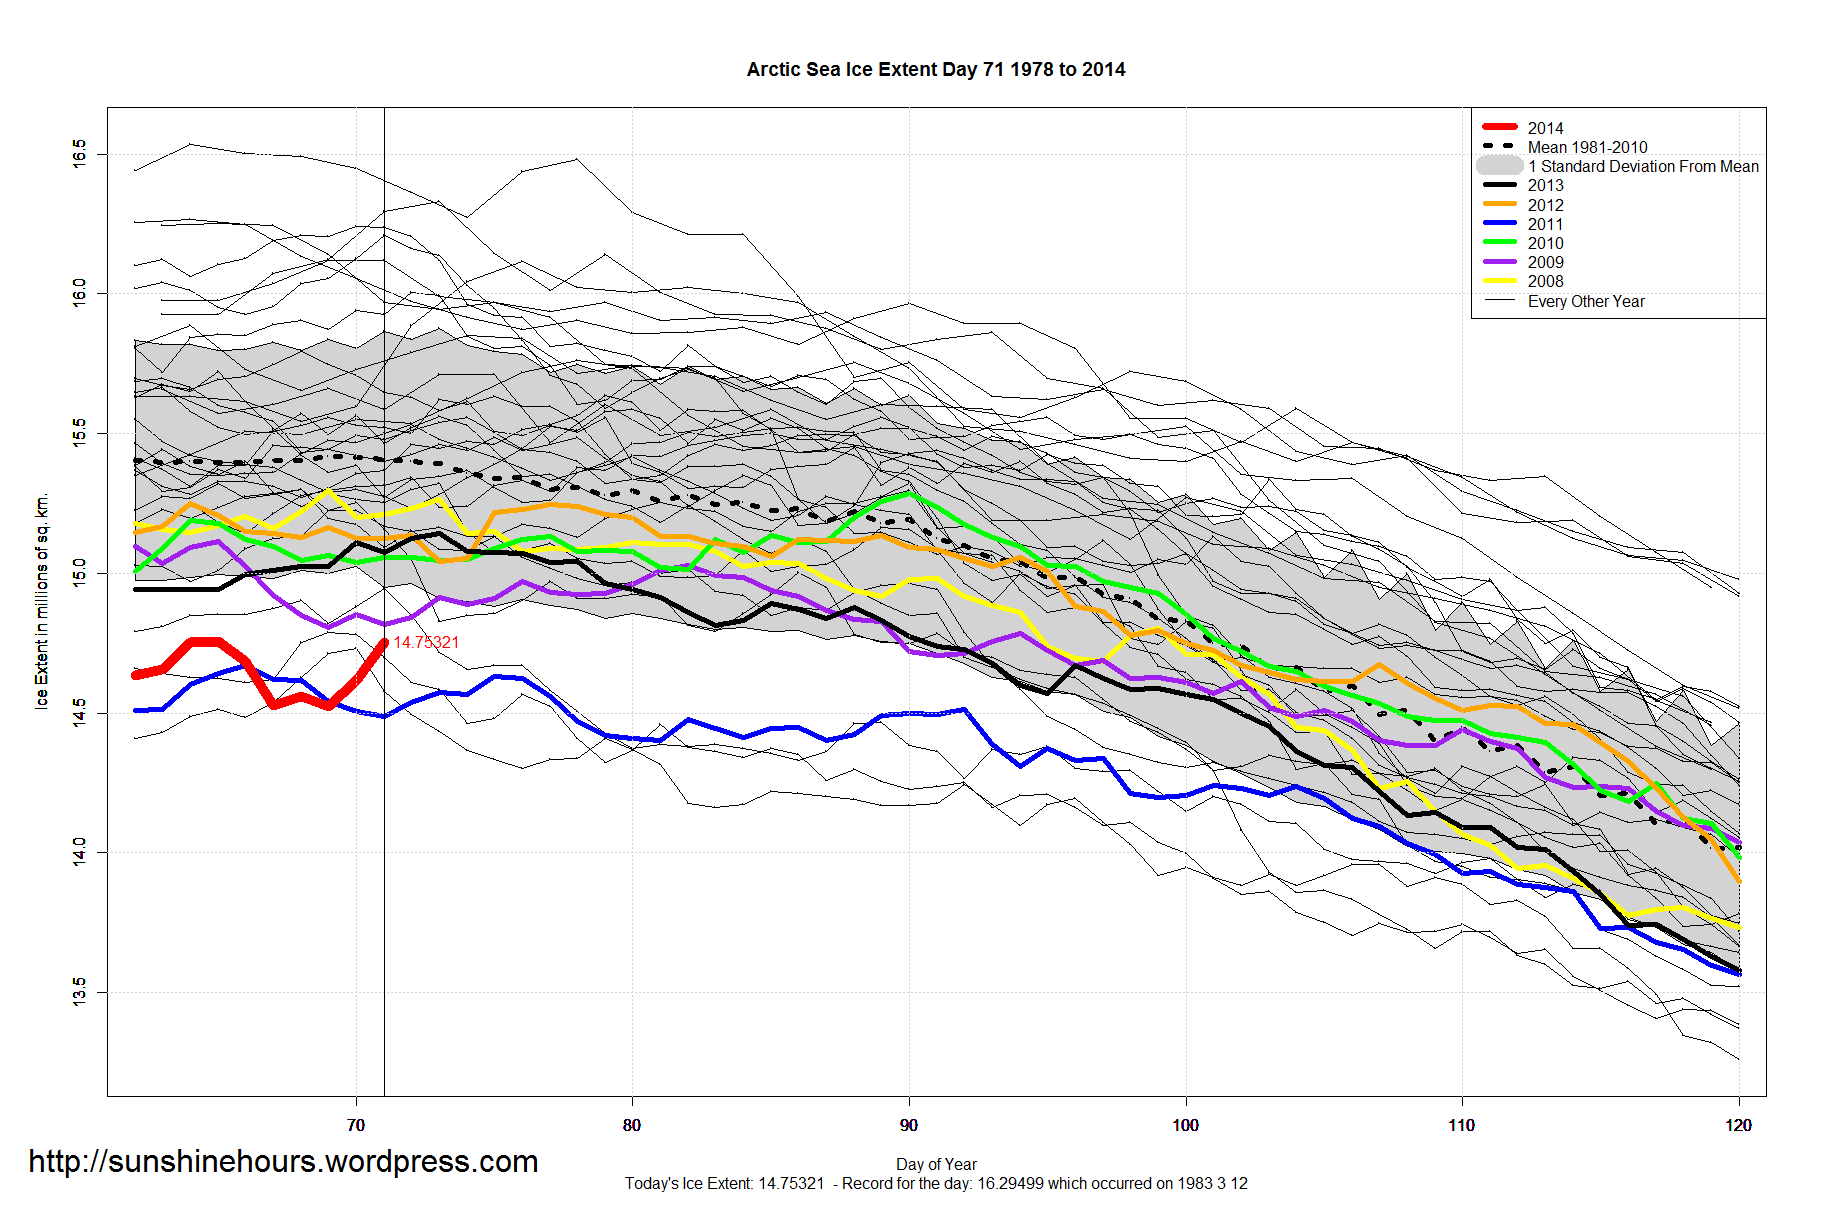
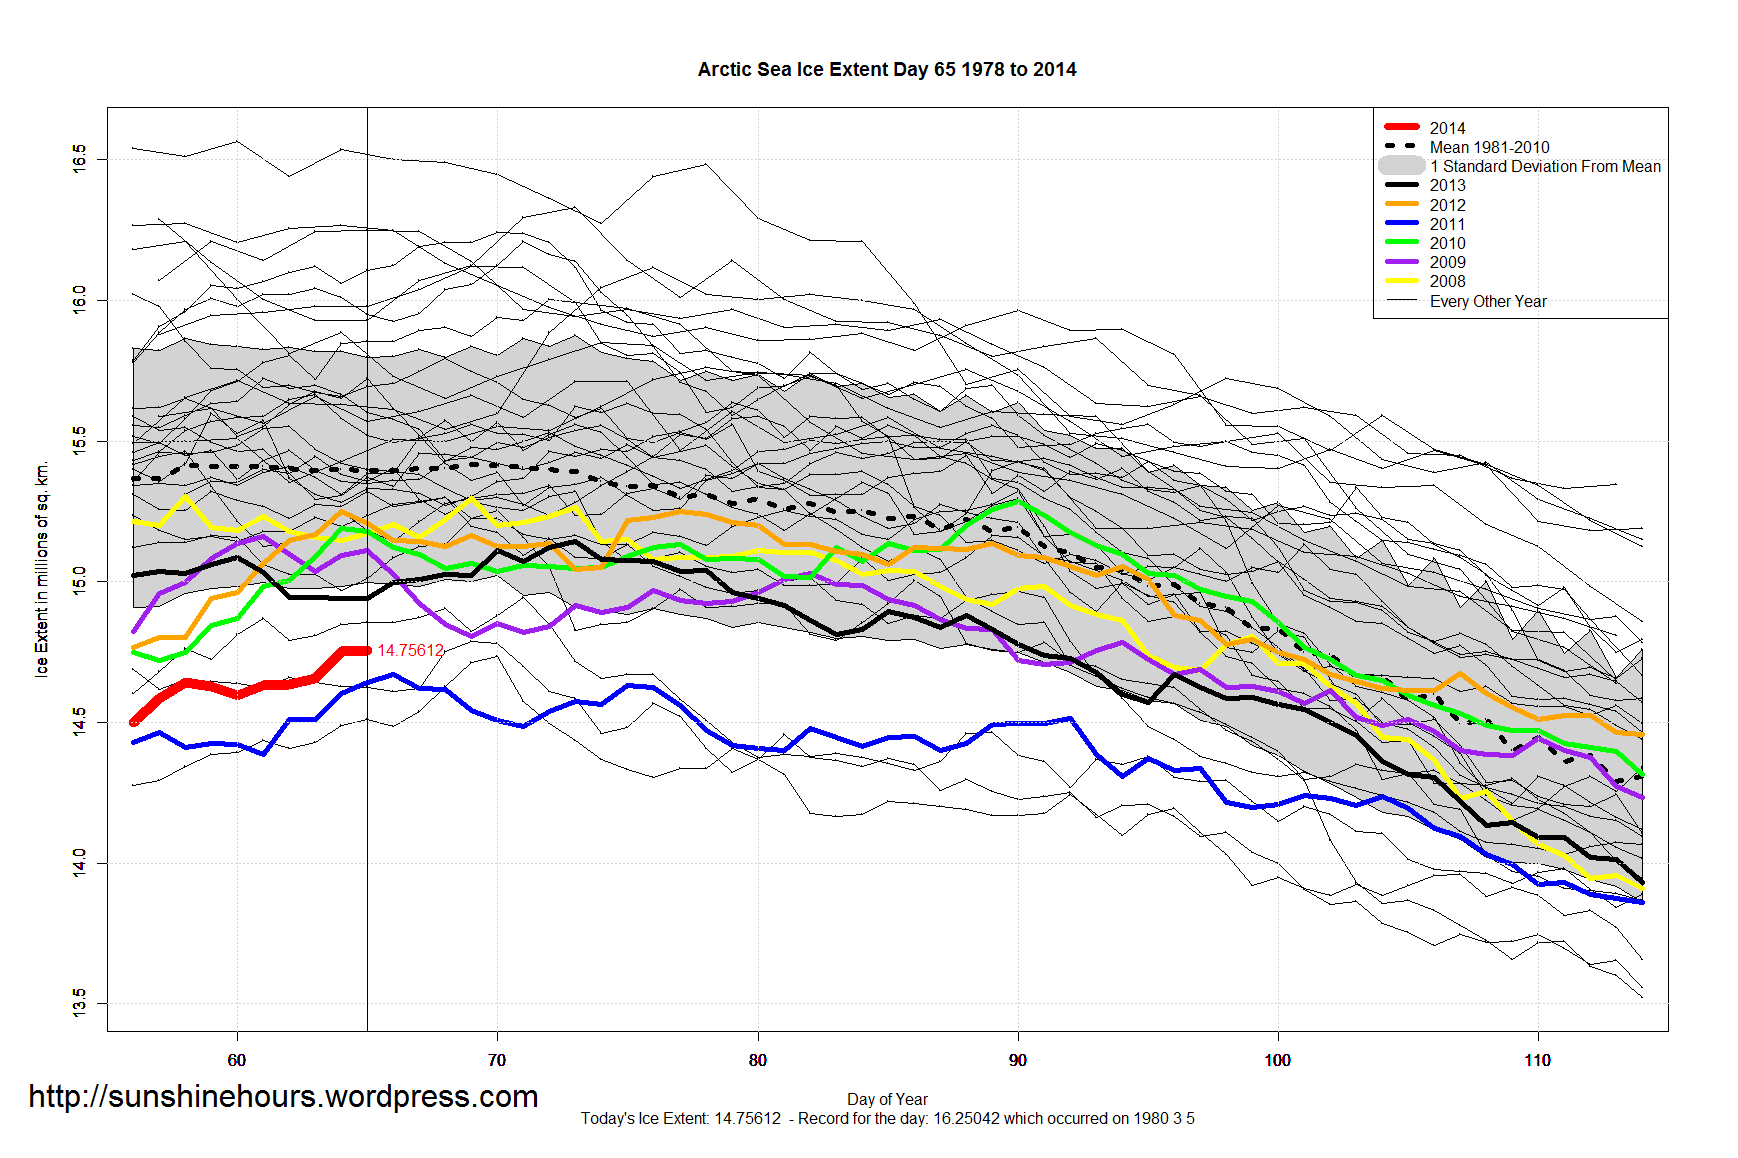
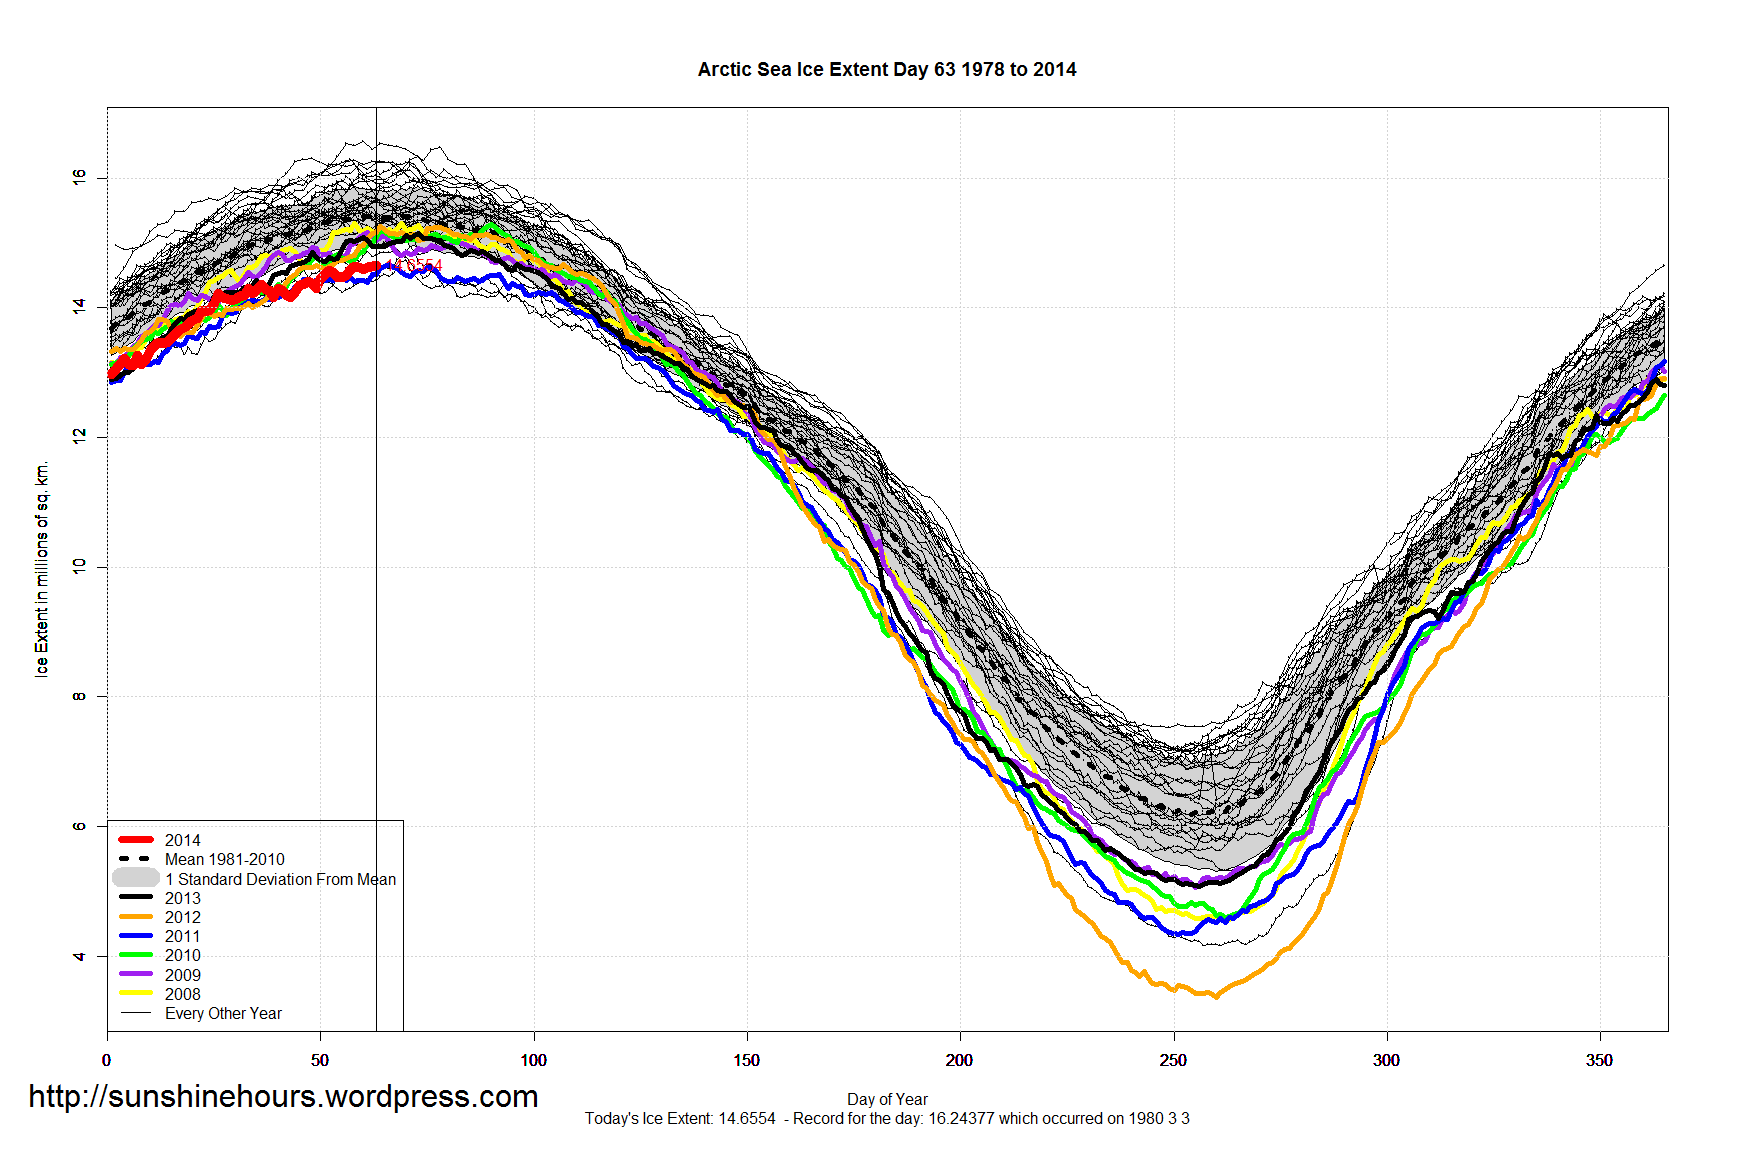
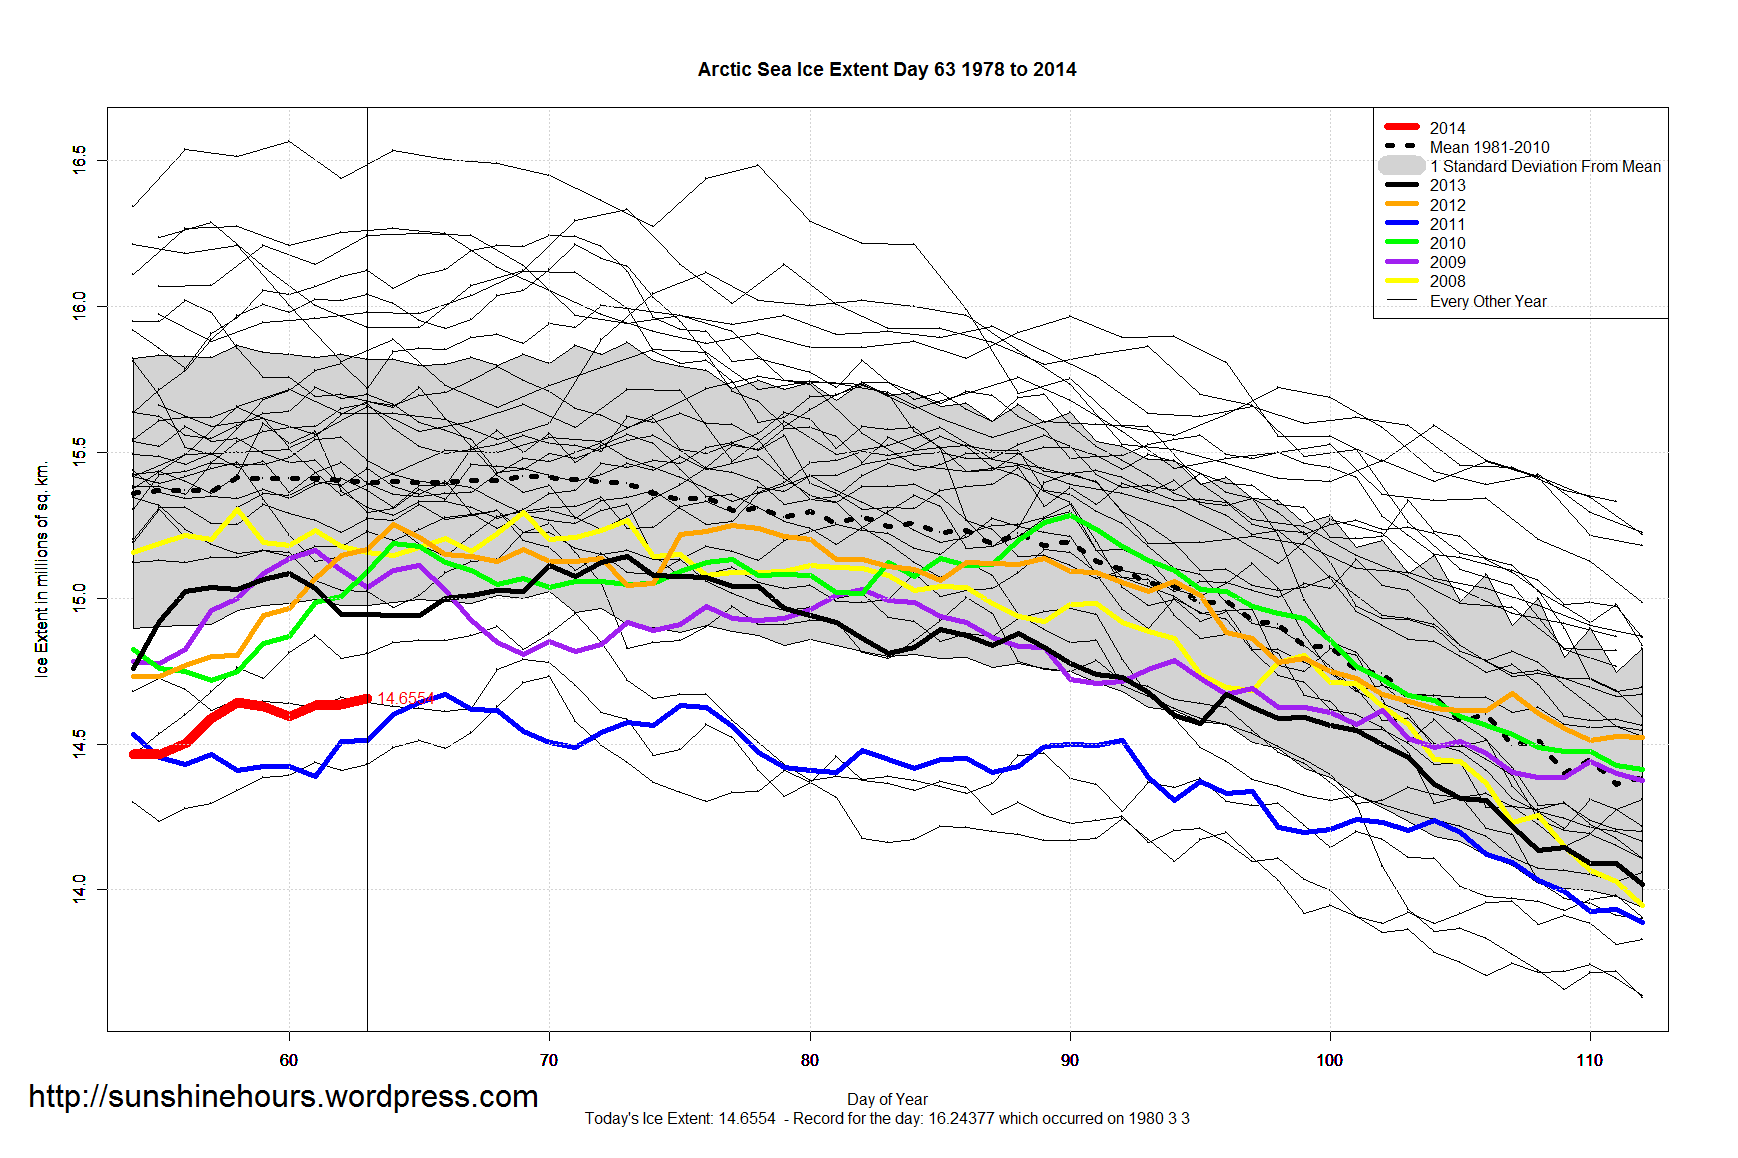
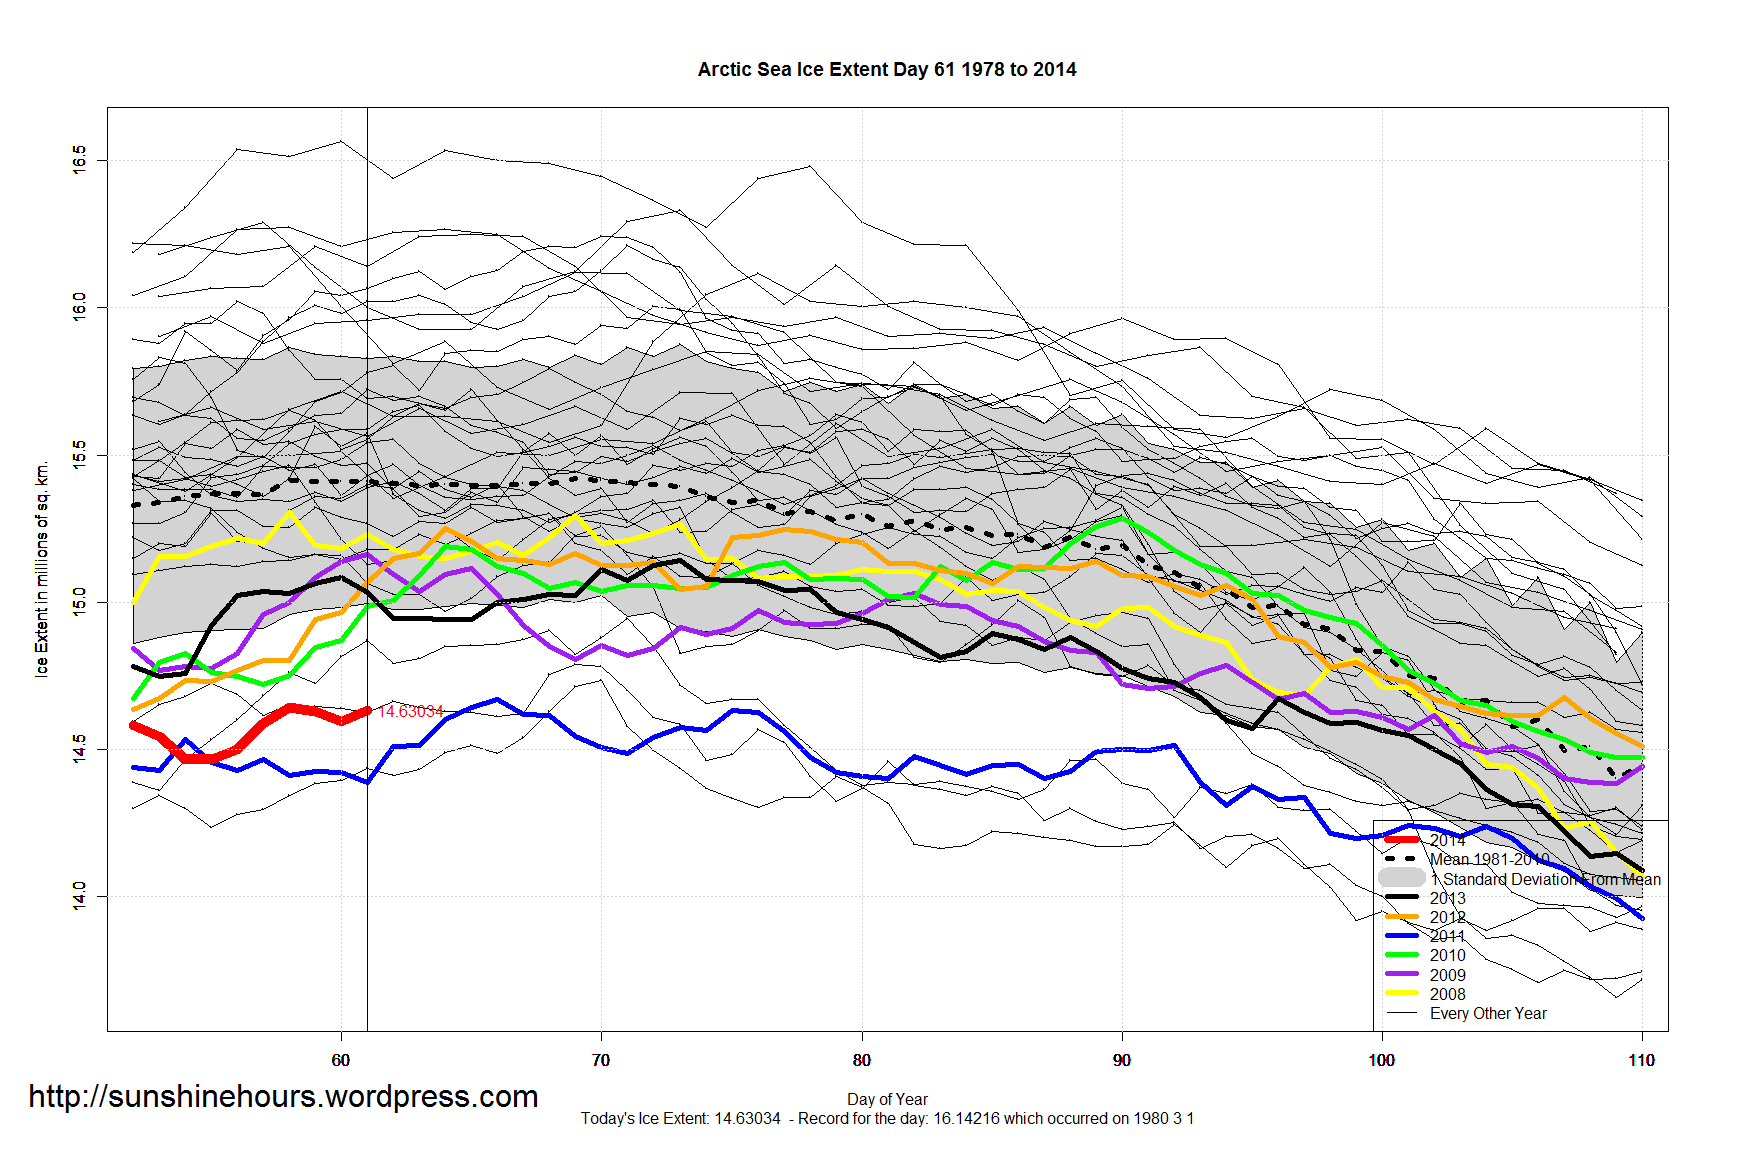
- Arctic Sea Ice is only 317,000 sq km below the 1981-2010 mean. That is 130,000 sq km inside the one standard deviation mark.
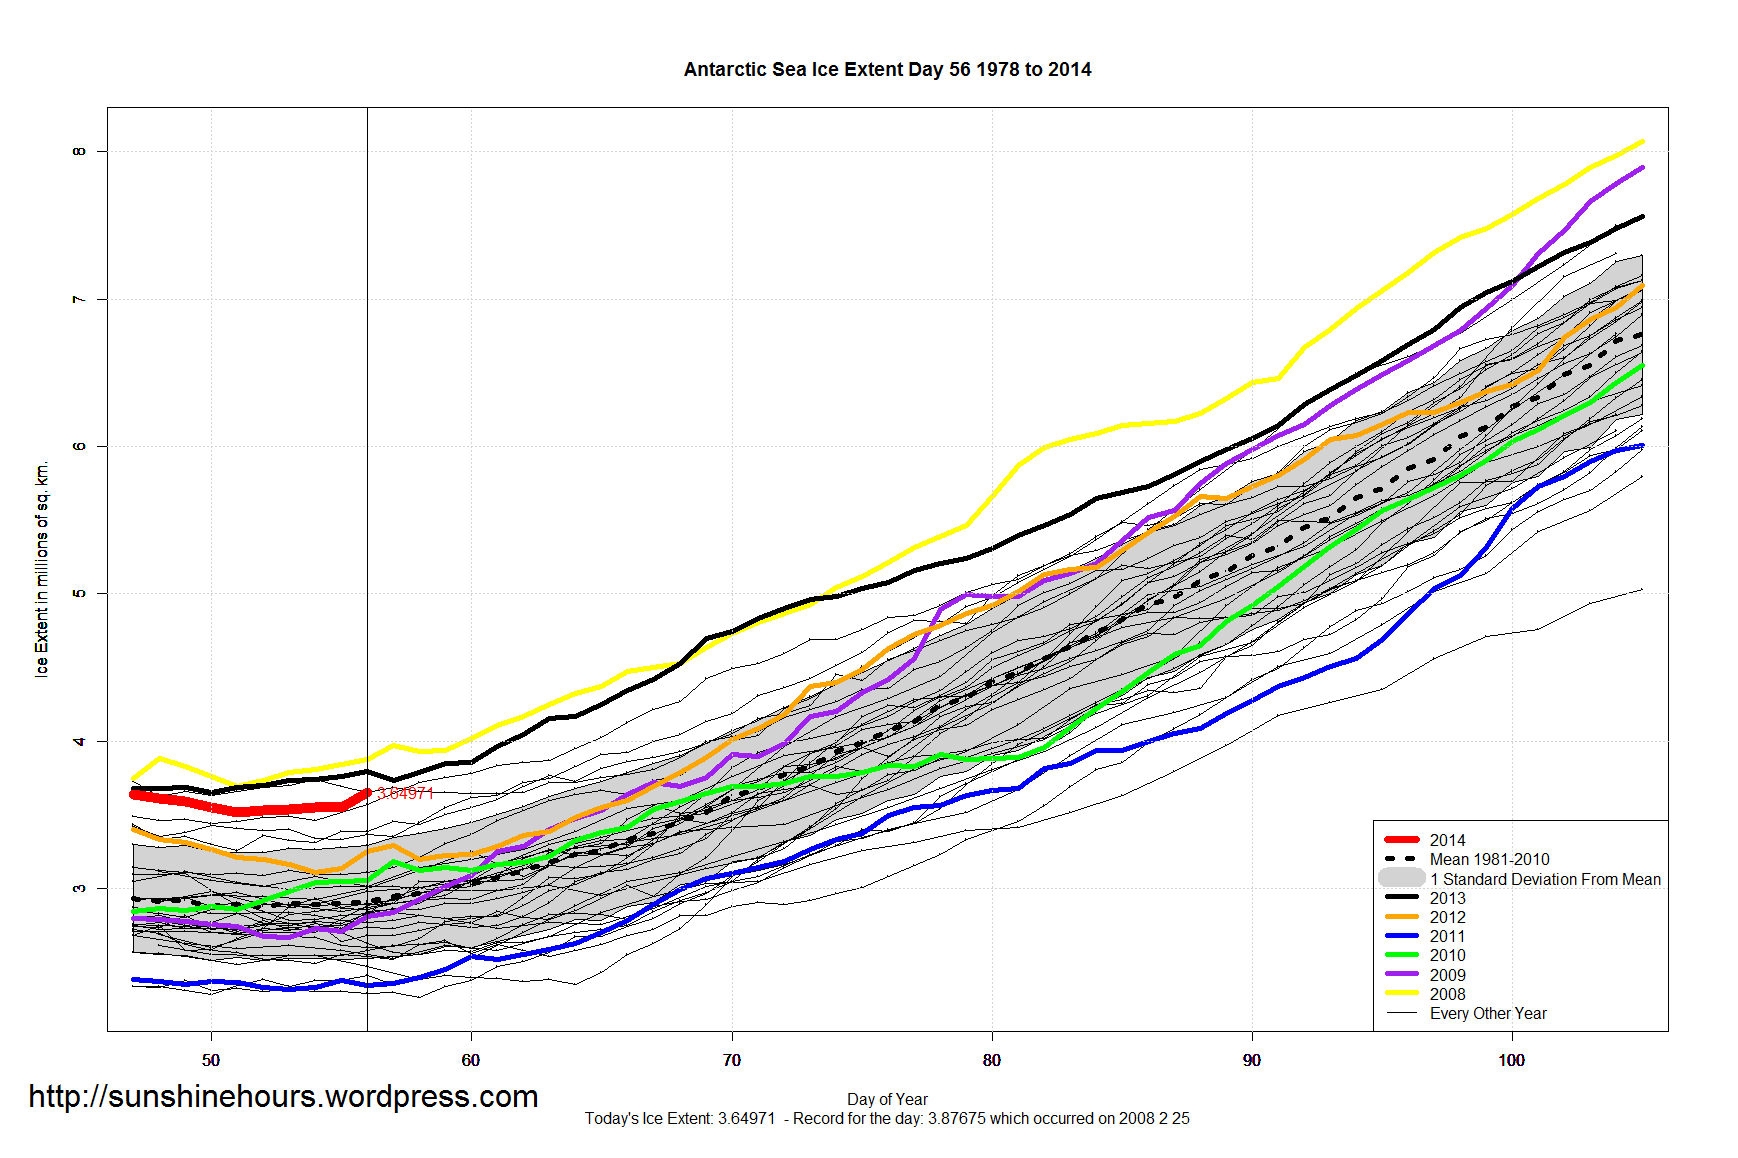
Data here. Graphs below. Click for bigger.


