Global Sea Ice Extent Anomaly Only 170,000 sq km = 0.7%

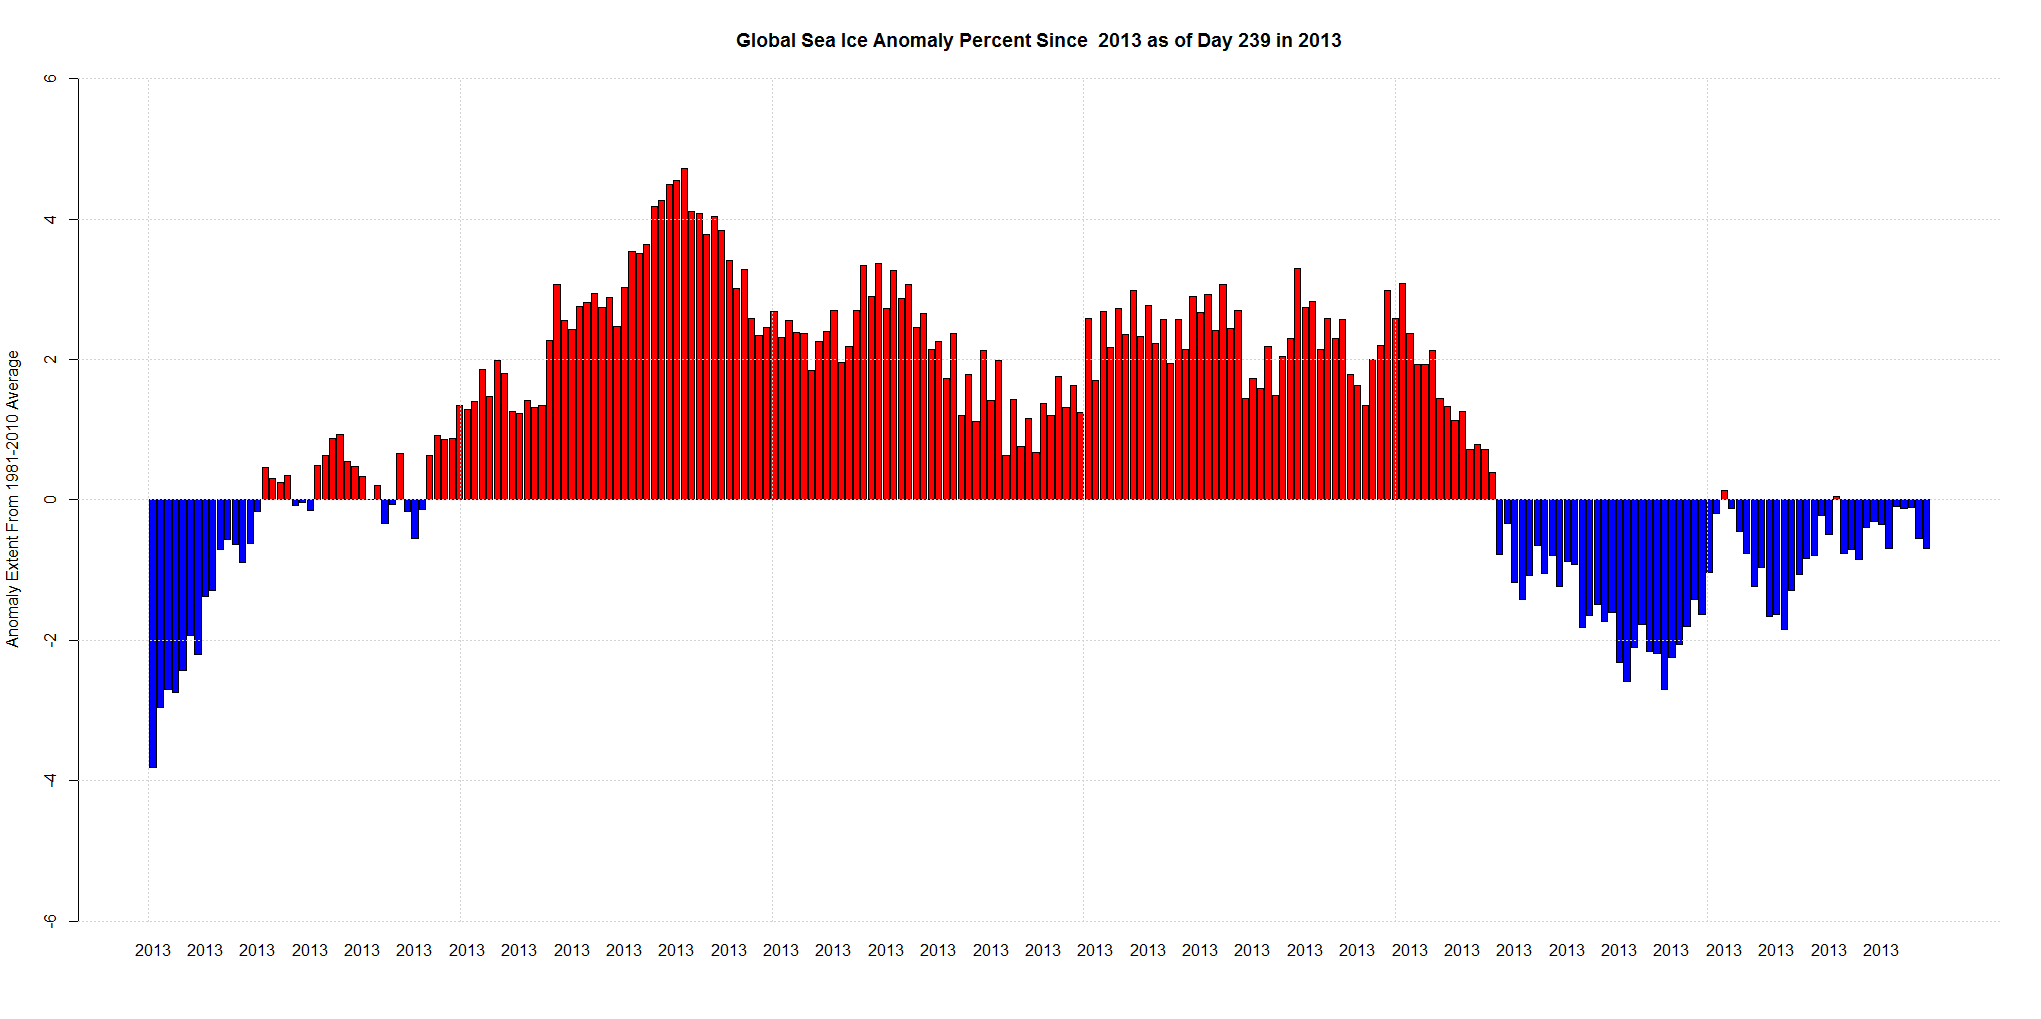
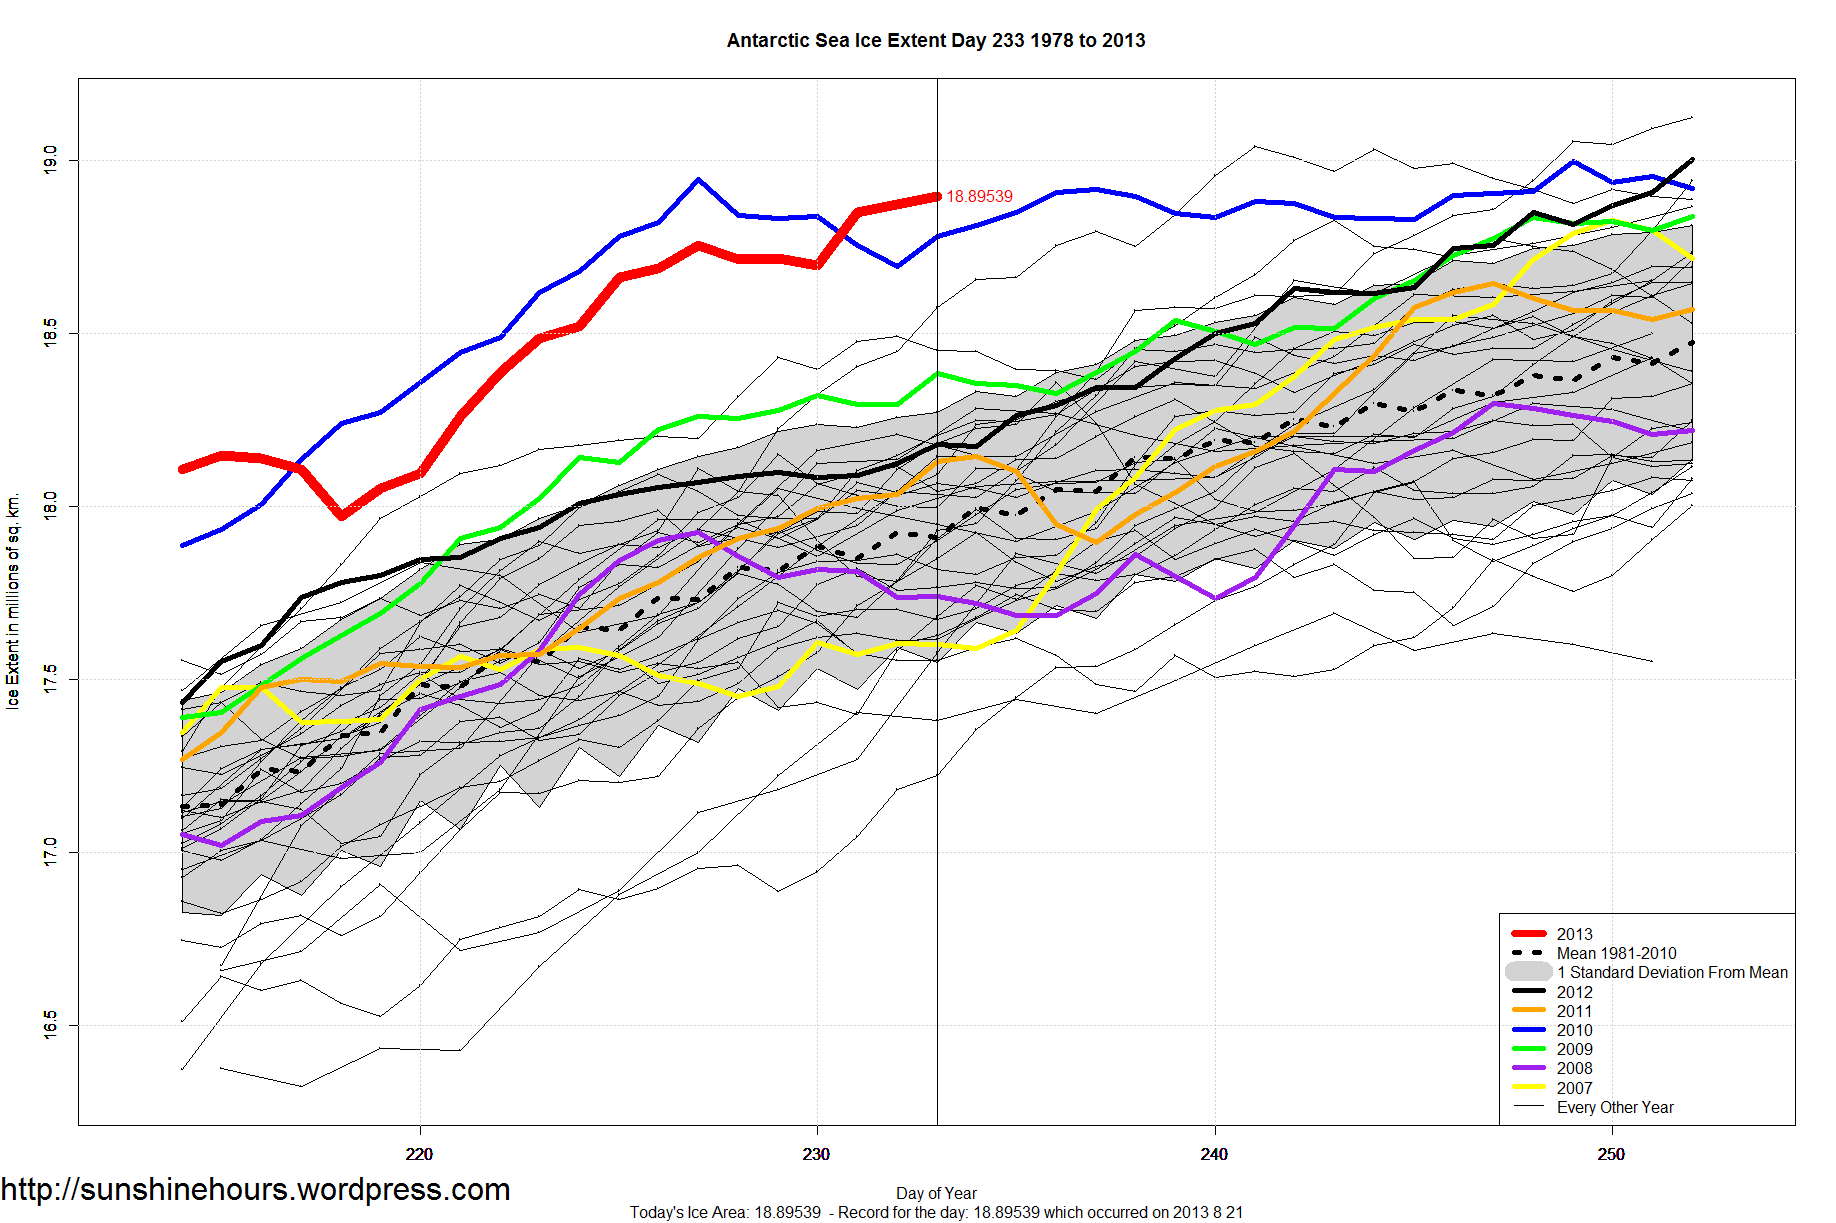
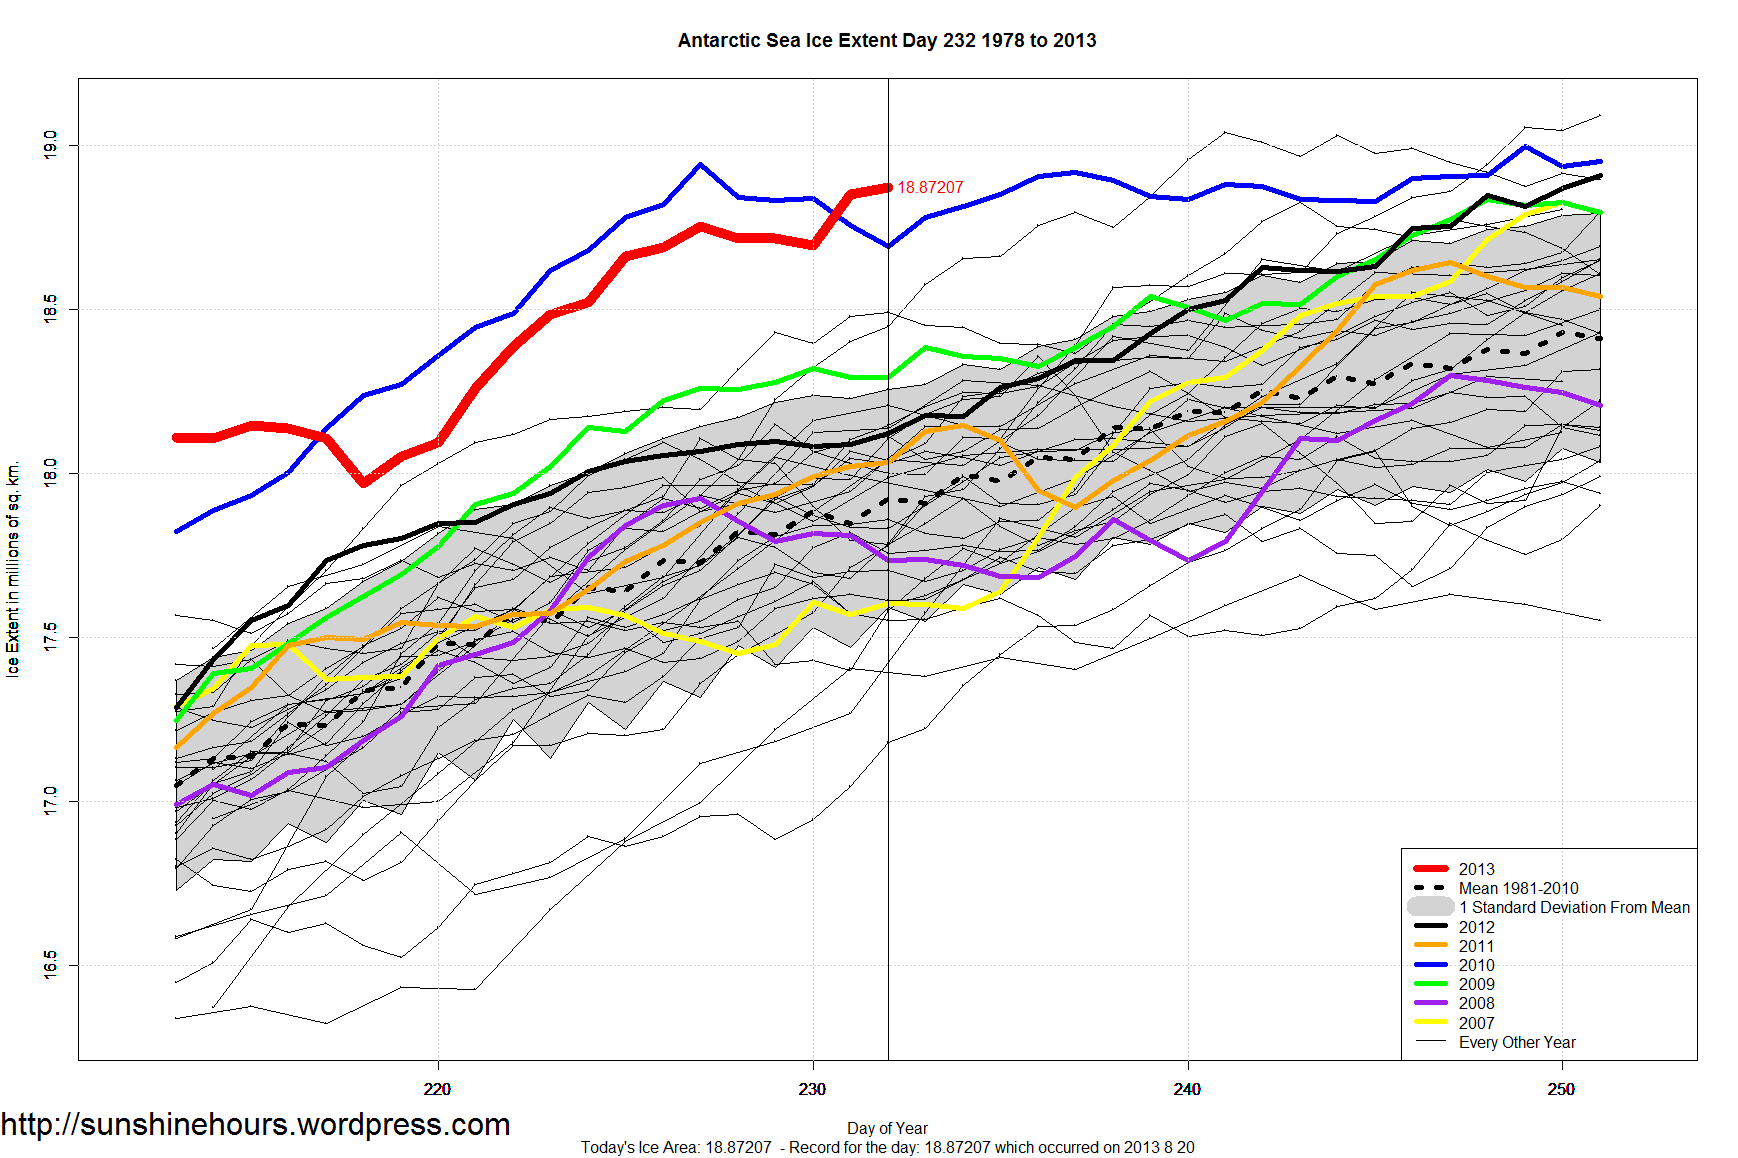
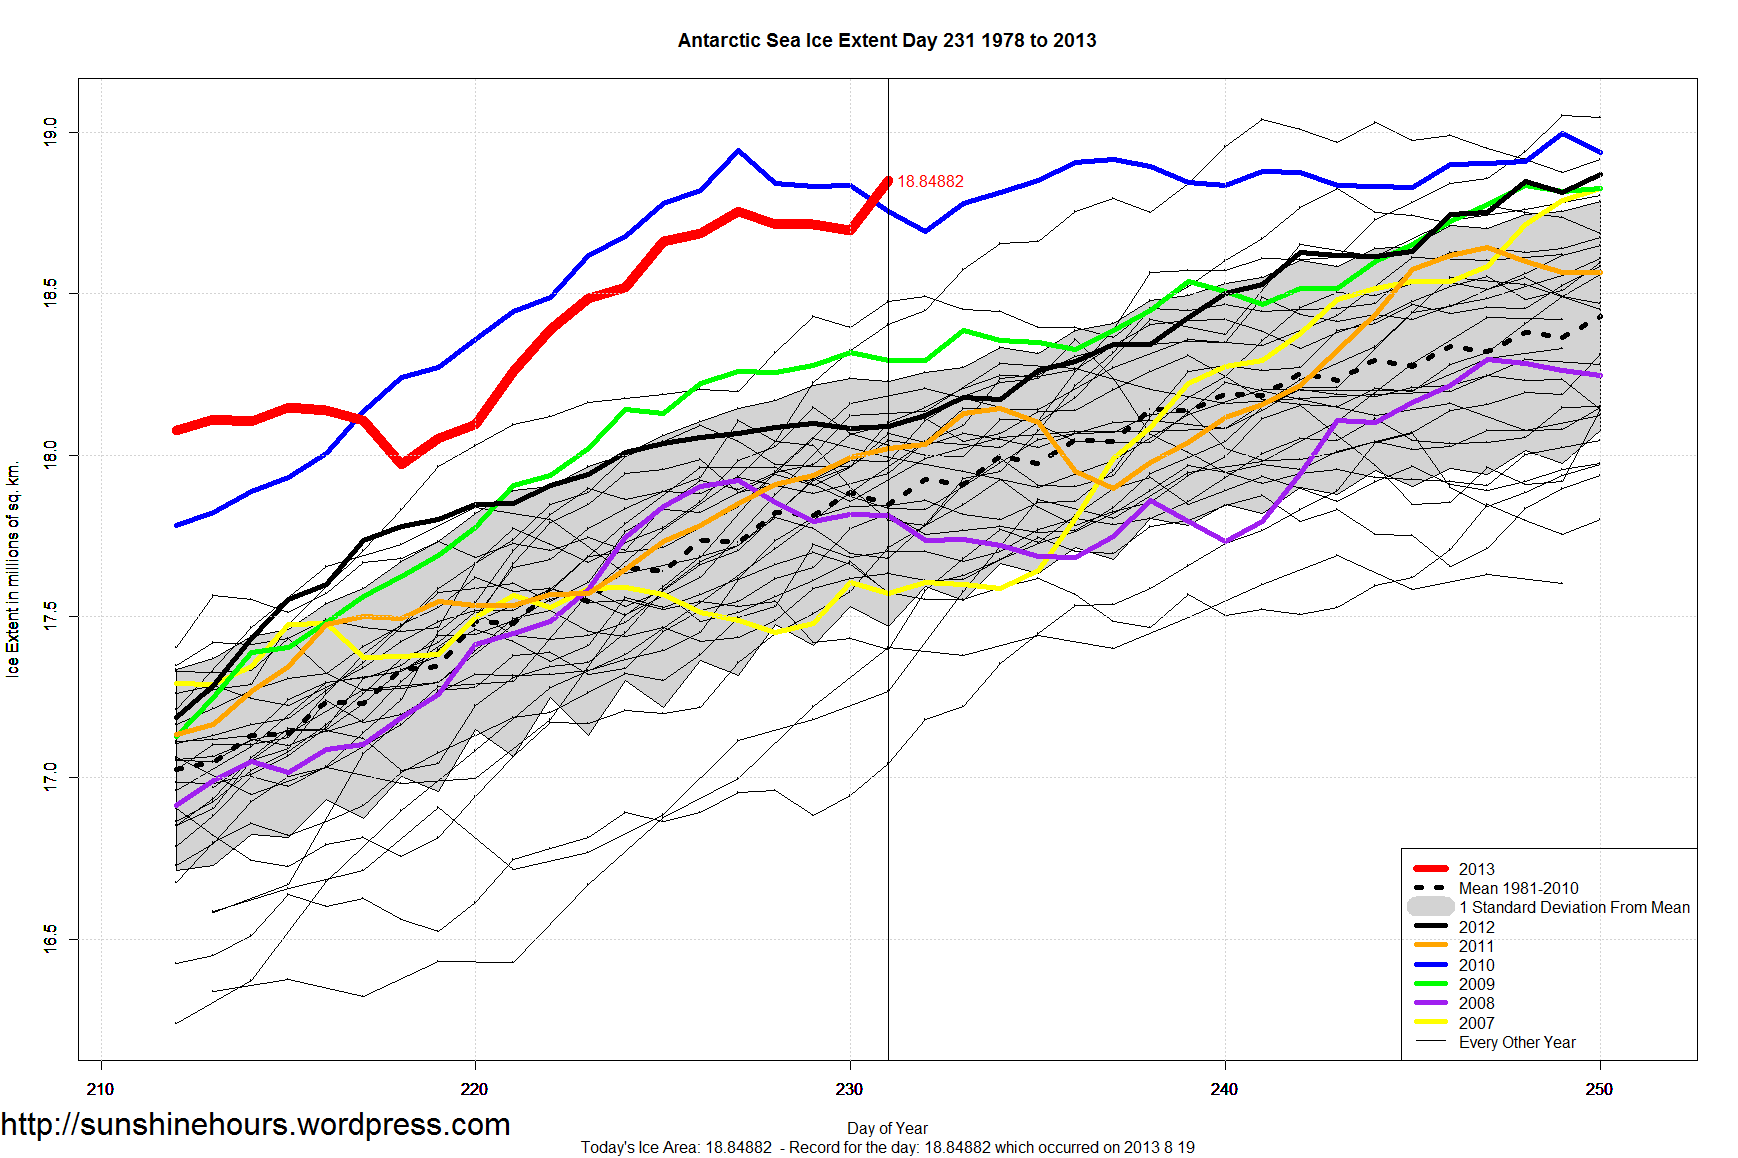
If you add up the Antarctic  Sea Ice Extent Anomaly from the 30 year mean and the Arctic Anomaly and divide by the 30 year mean it comes to 170,000 sq km. Out of a normal mean of 24,700,000 sq km on Day 239.

That is a whole 0.7% below normal. The red part is above normal.  The blue is below normal. 

The highest anomaly for 2013 was March 14th when the anomaly was 908,000 out of a mean of 19.2 million for an anomaly percent of  4.72%.

Global Sea Ice Anomaly Percent Since  2013 as of Day 239 in 2013

31st Daily Record of Year for Antarctic Sea Ice Extent (8th in a row)

August 26 (Day 238) saw the 31st Daily Record of the Year for Antarctic Sea Ice Extent. This was the 8th record in a row.

Antarctic Sea Ice Extent is 19.03962 million sq km.  That is 1,000,000 sq km higher than the 30 year mean.

With still 2 – 4 weeks left in the Antarctic Freeze Season, 2013 Sea Ice Extent has already surpassed 25 years yearly maximums.

Only the following years have had more ice: 1980, 1998, 2000, 2004, 2005, 2006, 2007, 2009, 2012.

Click graph for bigger. Data is here.

Antarctic_Sea_Ice_Extent_Zoomed_2013_Day_238_1981-2010

Antarctic Sea Ice – Earliest to 19,000,000 sq km

Antarctic Sea Ice Extent (NSIDC) broke 19,000,000 sq km on August 25th (day 237). That was the earliest ever.

The previous earliest to break 19 million was August 29 2006 (day 241).

Yesterday was also the 30th daily record of the year.  And 7th in a row.

The record for most ice ever is day 266 in 2012 when the ice extent was 19.47713 million sq km.

Antarctic_Sea_Ice_Extent_Zoomed_2013_Day_237_1981-2010

29th Daily Record of Year for Antarctic Sea Ice Extent (6th in a row)

August 24 (Day 236) saw the 29th Daily Record of the Year for Antarctic Sea Ice Extent. This was the 6th record in a row.

Antarctic Sea Ice Extent is 18.97784 million sq km. The earliest the Antarctic reached 19 million sql km was in 2006 when it happened on day 241.

The most days over 19 million sq km was in 2006 and 2012 when there were 30 days each.

Click graph for bigger. Data is here.

Antarctic_Sea_Ice_Extent_Zoomed_2013_Day_236_1981-2010

28th Daily Record of Year for Antarctic Sea Ice Extent (5th in a row)

August 23 (Day 235) saw the 28th Daily Record of the Year for Antarctic Sea Ice Extent. This was the 5th record in a row.

2013 now holds 3rd place for the Number of Daily Records in a year. (It was tied yesterday)

Year No of Records
2008 125
2010 111
2013 28
2006 27
2012 27
2007 21
2009 8
2004 5
1998 4
2000 4
2005 3
1979 2
1980 1

Click graph for bigger. Data is here.

Antarctic_Sea_Ice_Extent_Zoomed_2013_Day_235_1981-2010

27th Daily Record of Year for Antarctic Sea Ice Extent (4th in a row)

August 22 (Day 234) saw the 27th Daily Record of the Year for Antarctic Sea Ice Extent. This was the 4th record in a row.

It also ties 2013 with 2006 and 2012 for the Number of Daily Records in a year.

Year No of Records
2008 125
2010 112
2013 27
2006 27
2012 27
2007 21
2009 8
2004 5
1998 4
2000 4
2005 3
1979 2
1980 1

Click graph for bigger. Data is here.

Antarctic_Sea_Ice_Extent_Zoomed_2013_Day_234_1981-2010


24th Daily Record of Year for Antarctic Sea Ice Extent – Aug 19 2013

August 19 (Day 231) saw the 24th Daily Record of the Year for Antarctic Sea Ice Extent.

Day 231 Sea Ice Extent was 950,000 sq km higher than the 30 year mean.

2013 has a chance at catching 2006 and 2012 for the number of daily records set in a year.

Year No of Records
2008 125
2010 115
2006 27
2012 27
2013 24
2007 21
2009 8
2004 5
1998 4
2000 4
2005 3
1979 2
1980 1

Click graph for bigger. Data is here.

Antarctic_Sea_Ice_Extent_Zoomed_2013_Day_231_1981-2010