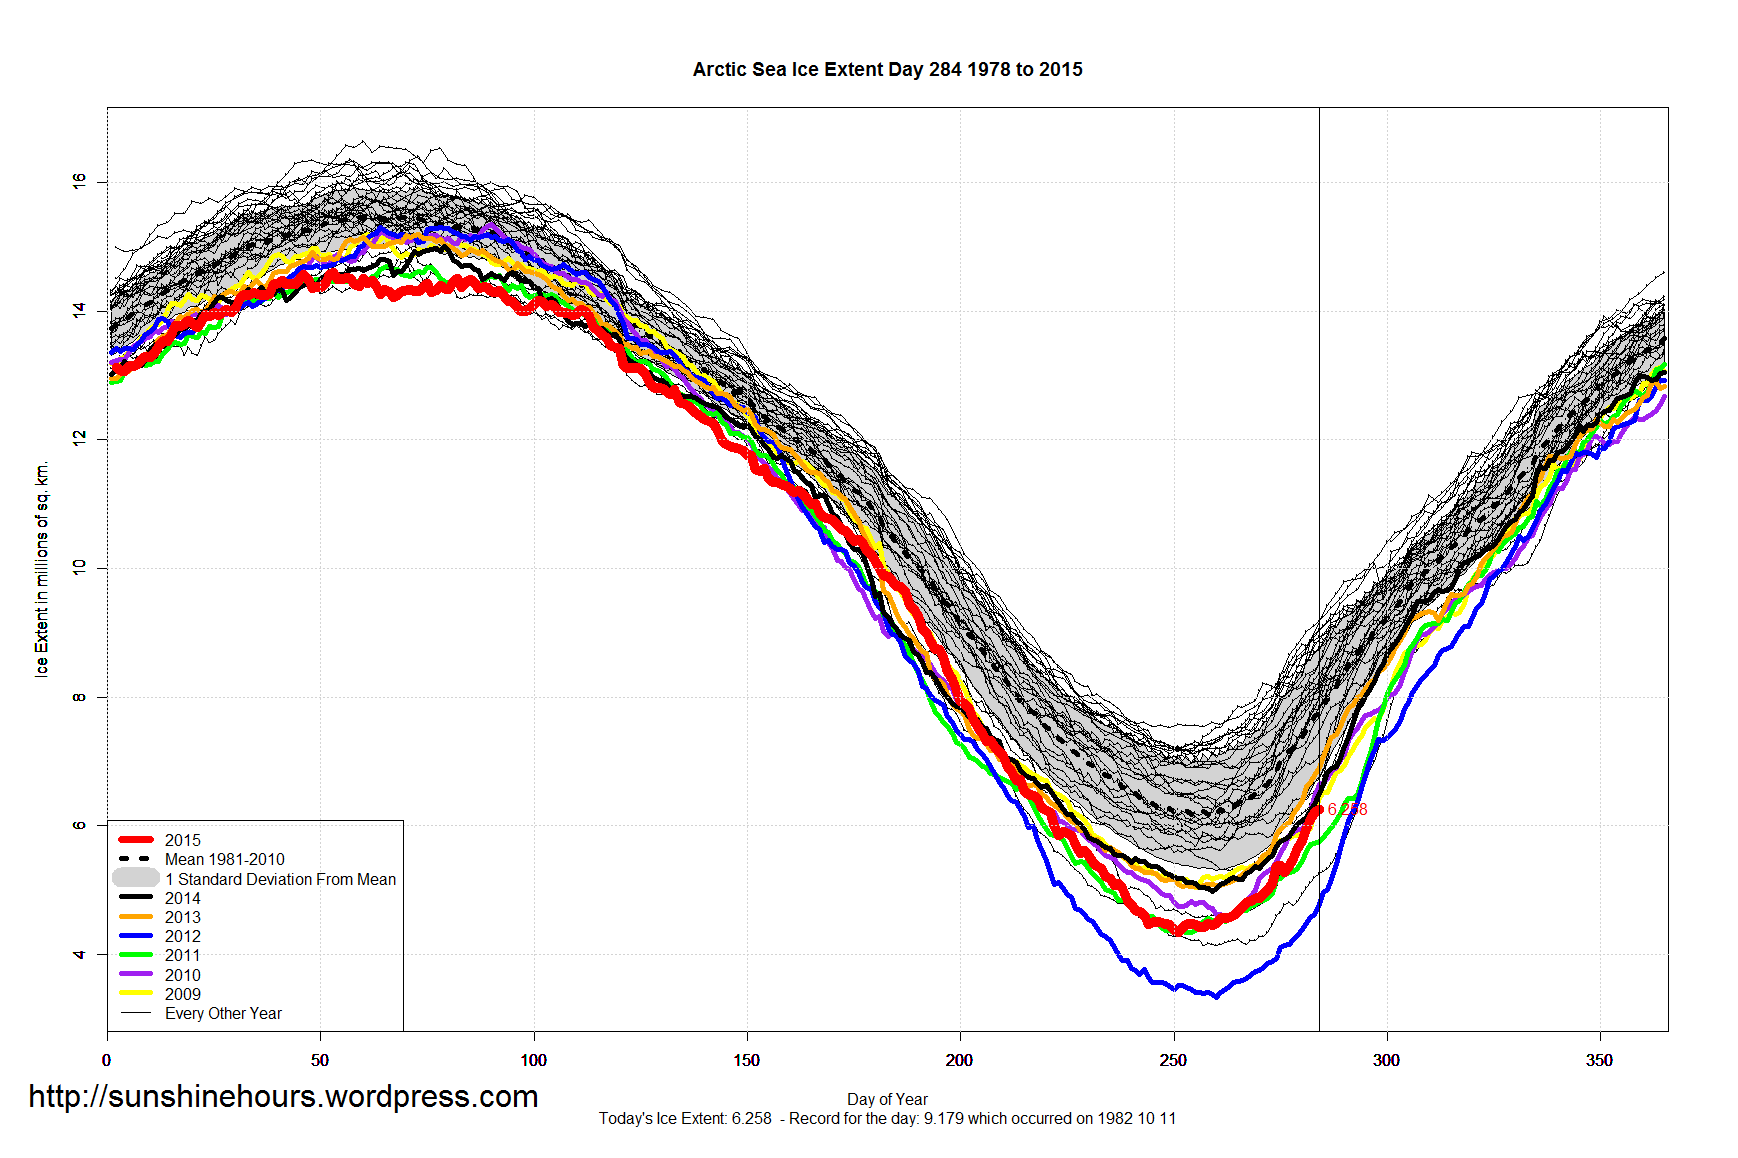
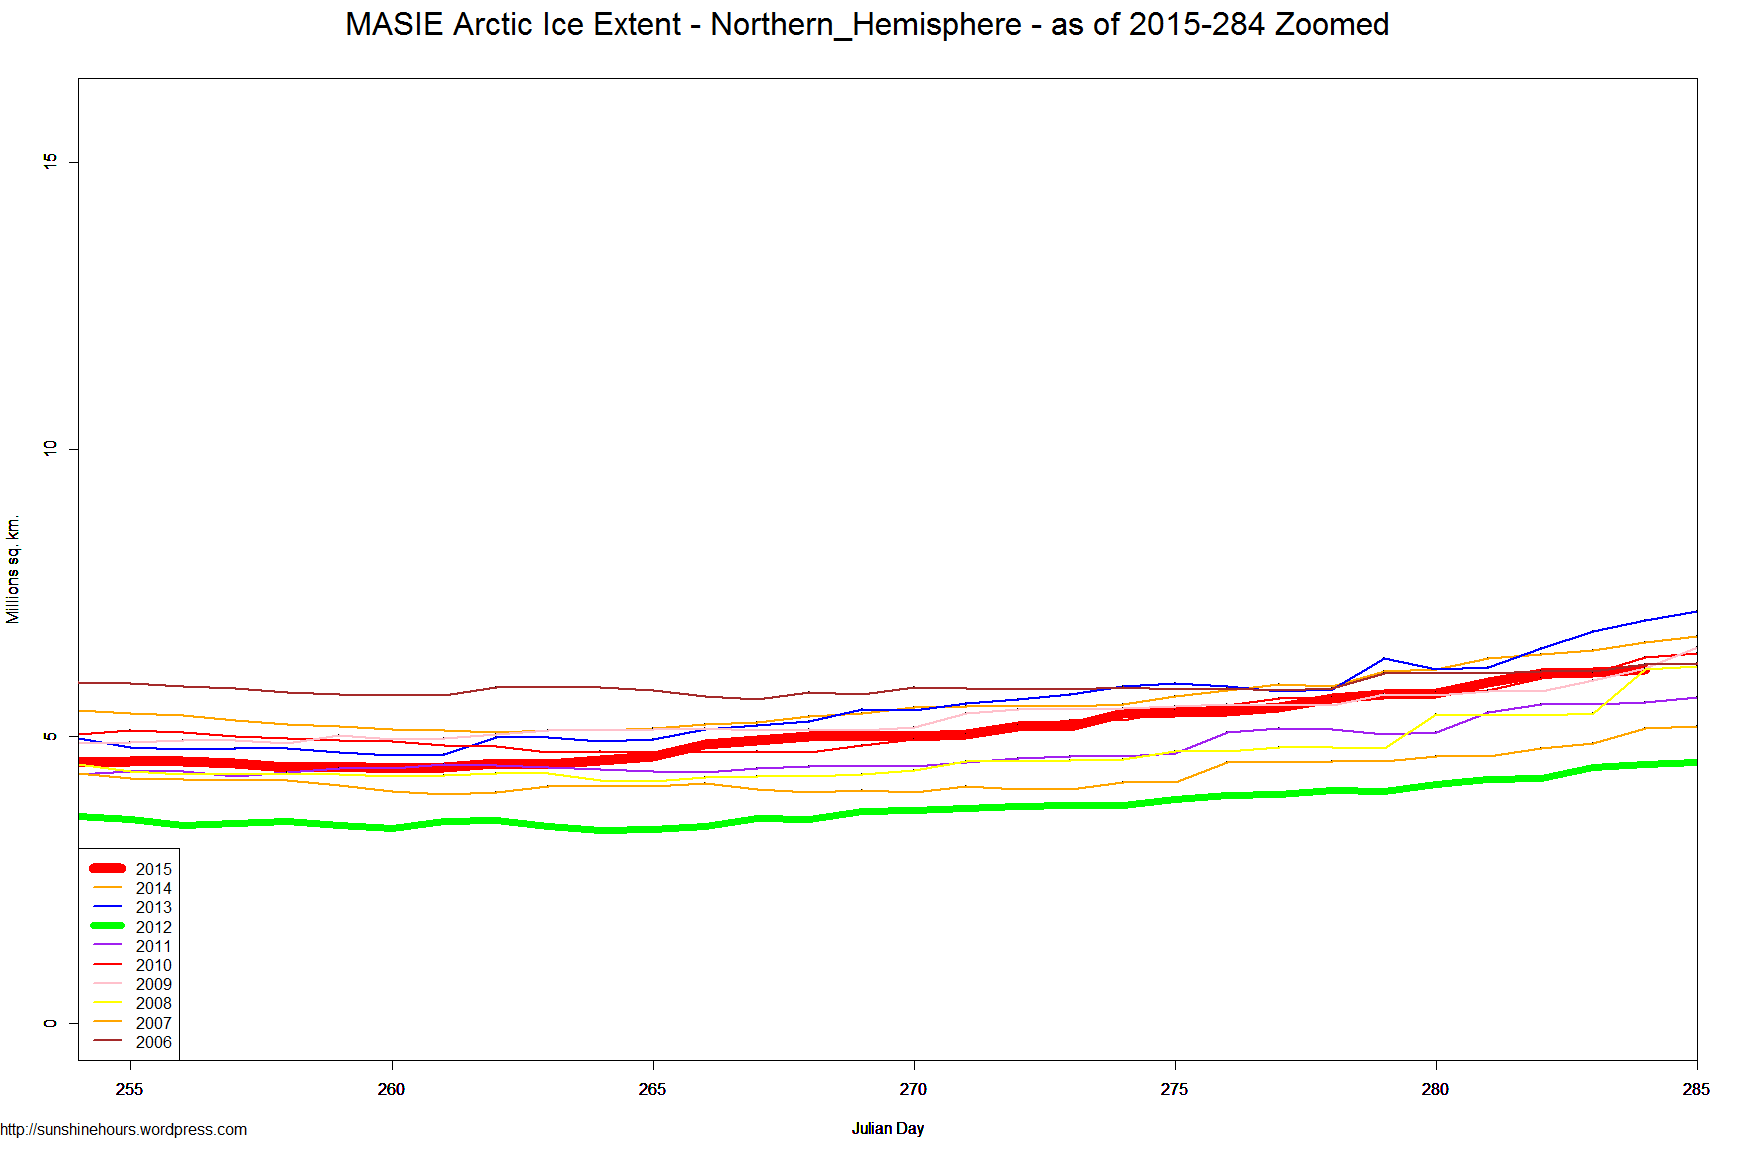
MASIE for day 284. The list of regions and differrence from 2012 (ie Day 284 2015 minues Day 284 2012)
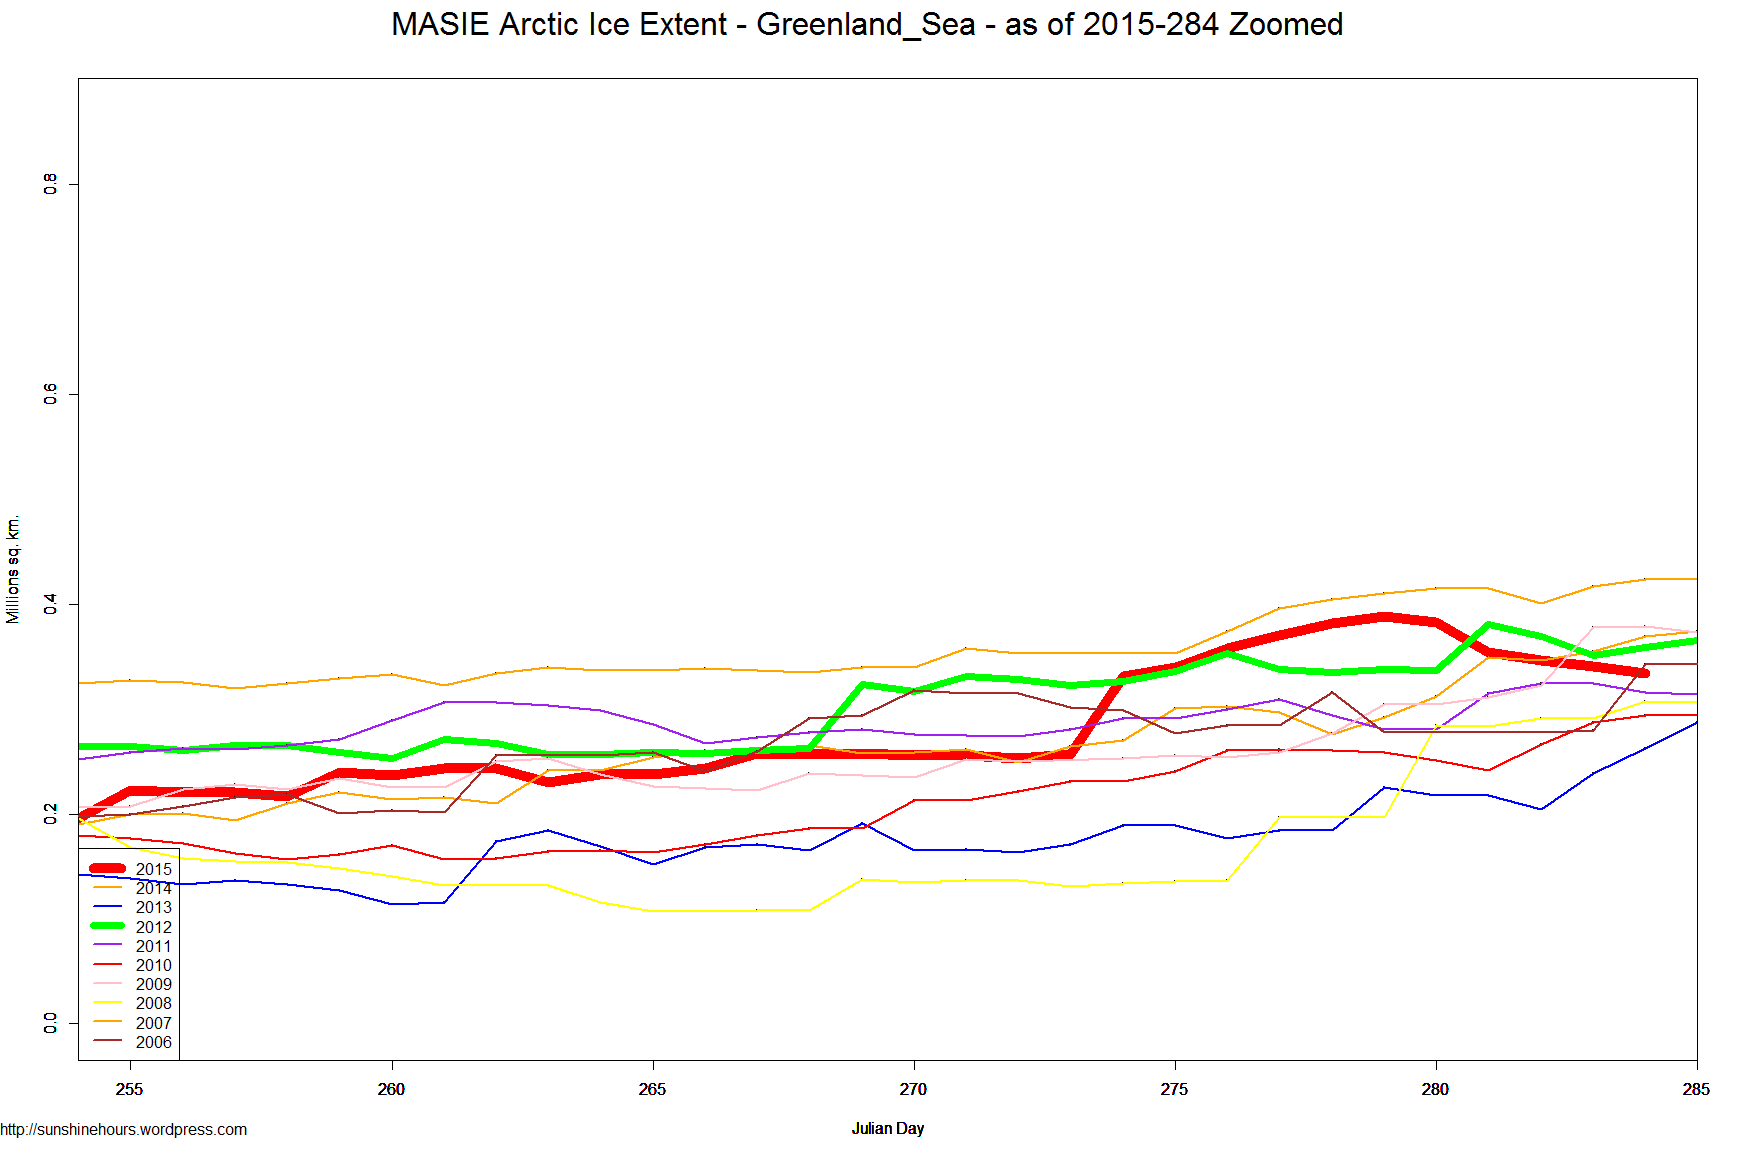
The only area with more sea ice in 2012 is Greenland Sea.
Northern_Hemisphere 1654281.78
Beaufort_Sea 449750.67
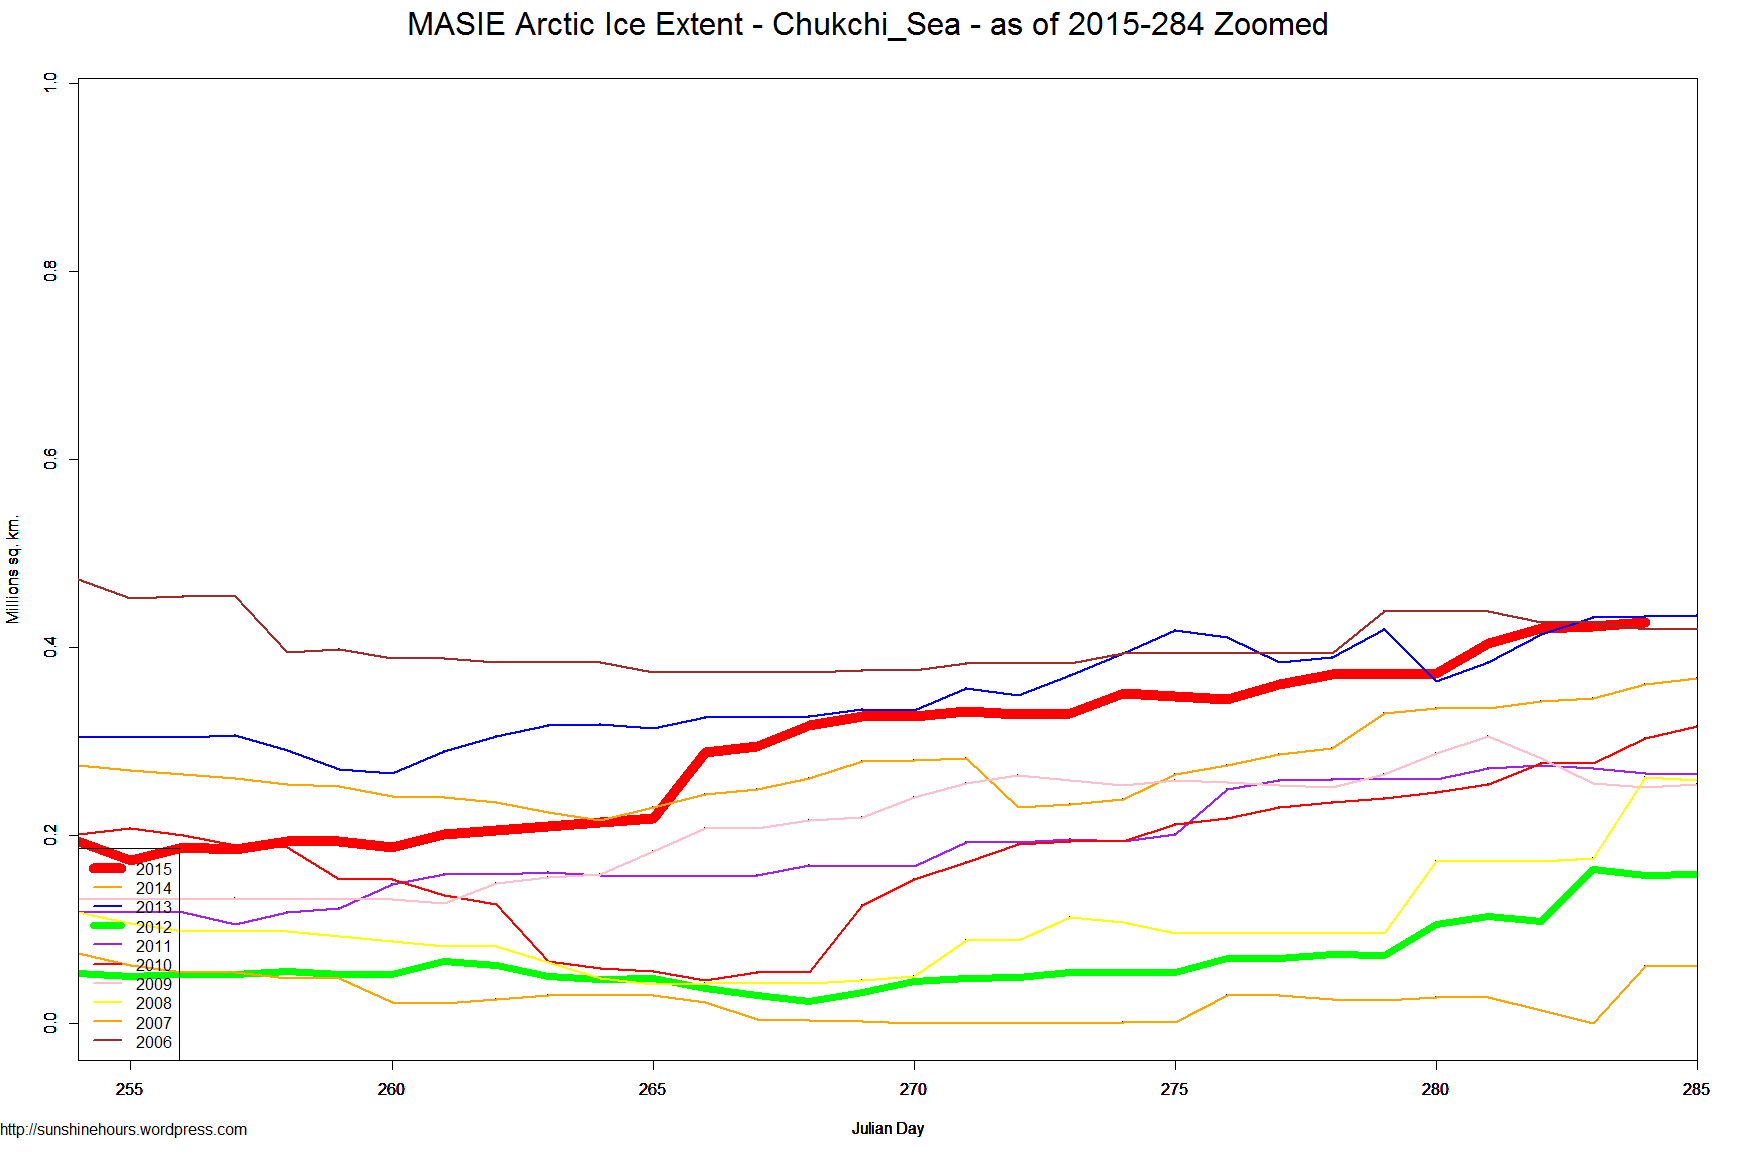
Chukchi_Sea 269003.6
East_Siberian_Sea 285379.13
Laptev_Sea 199710.43
Kara_Sea 53691.11
Barents_Sea 1588.63
Greenland_Sea -25060.33
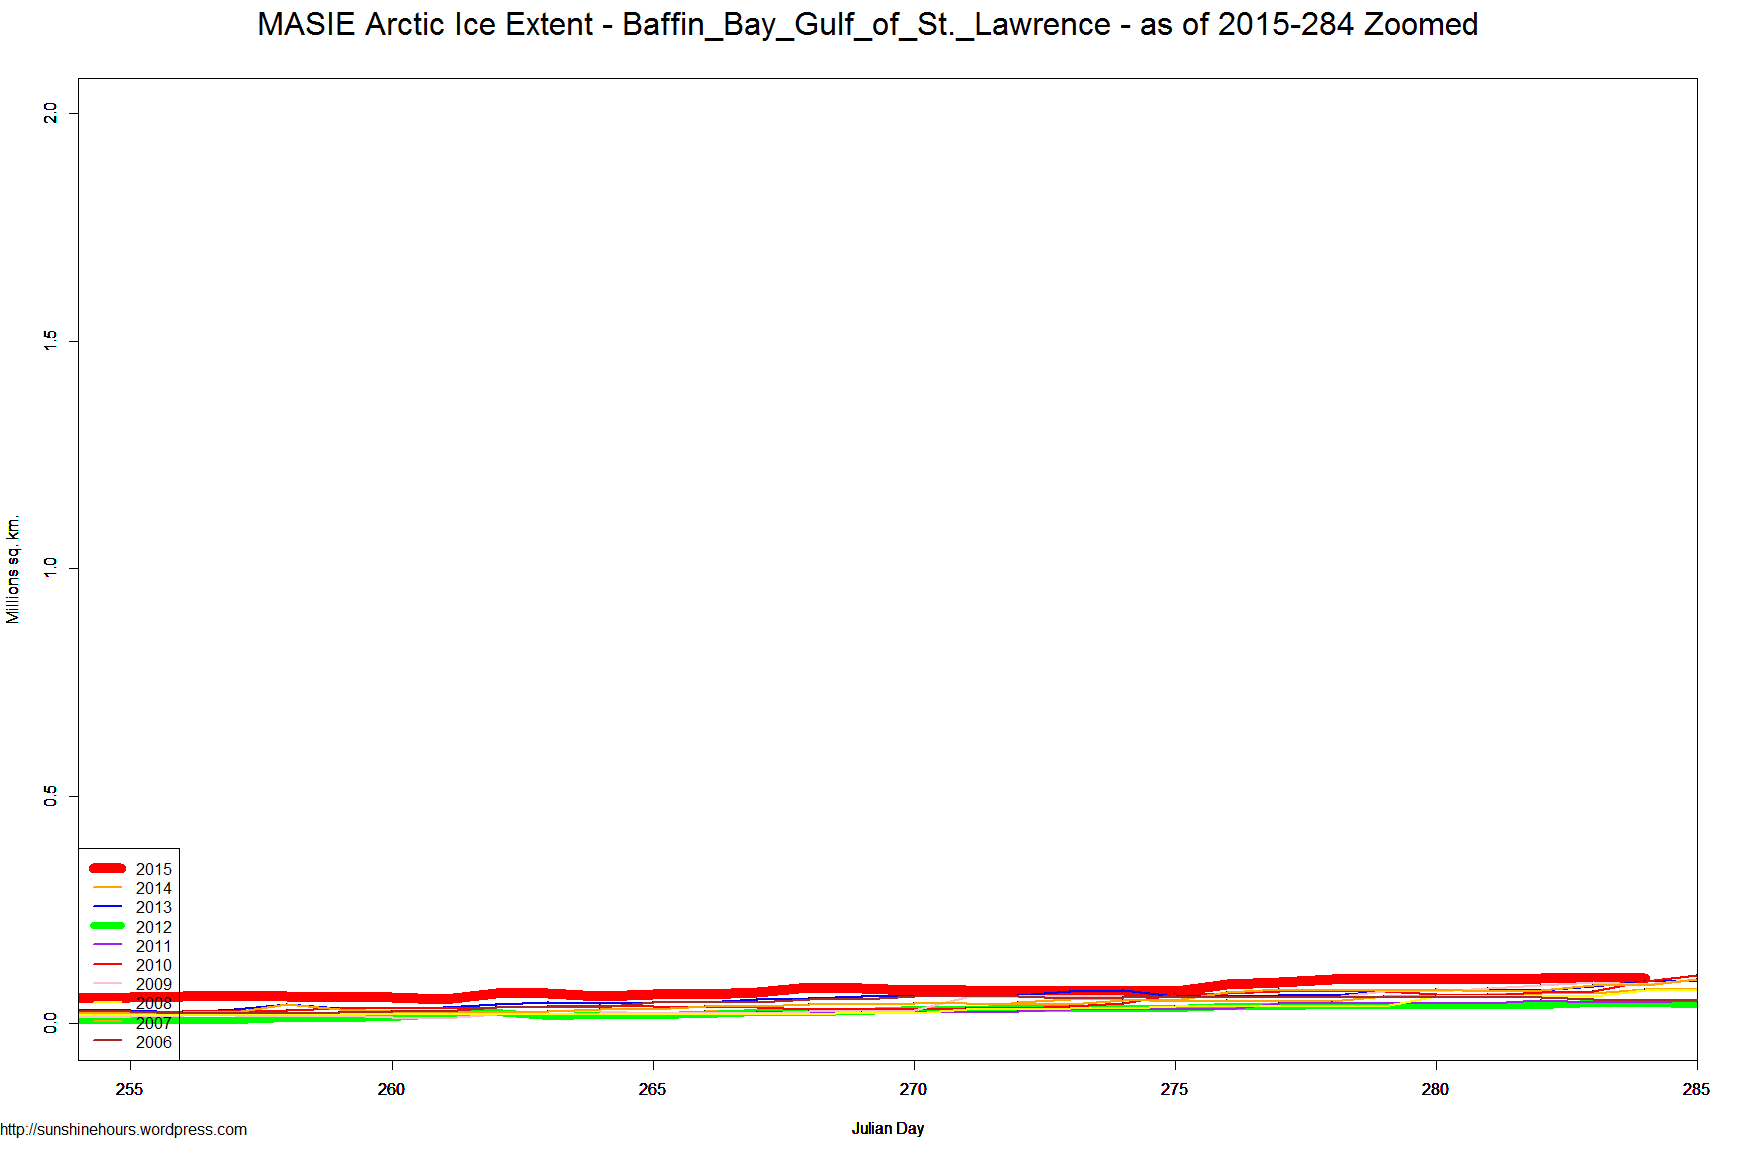
Baffin_Bay_Gulf_of_St._Lawrence 54980.18
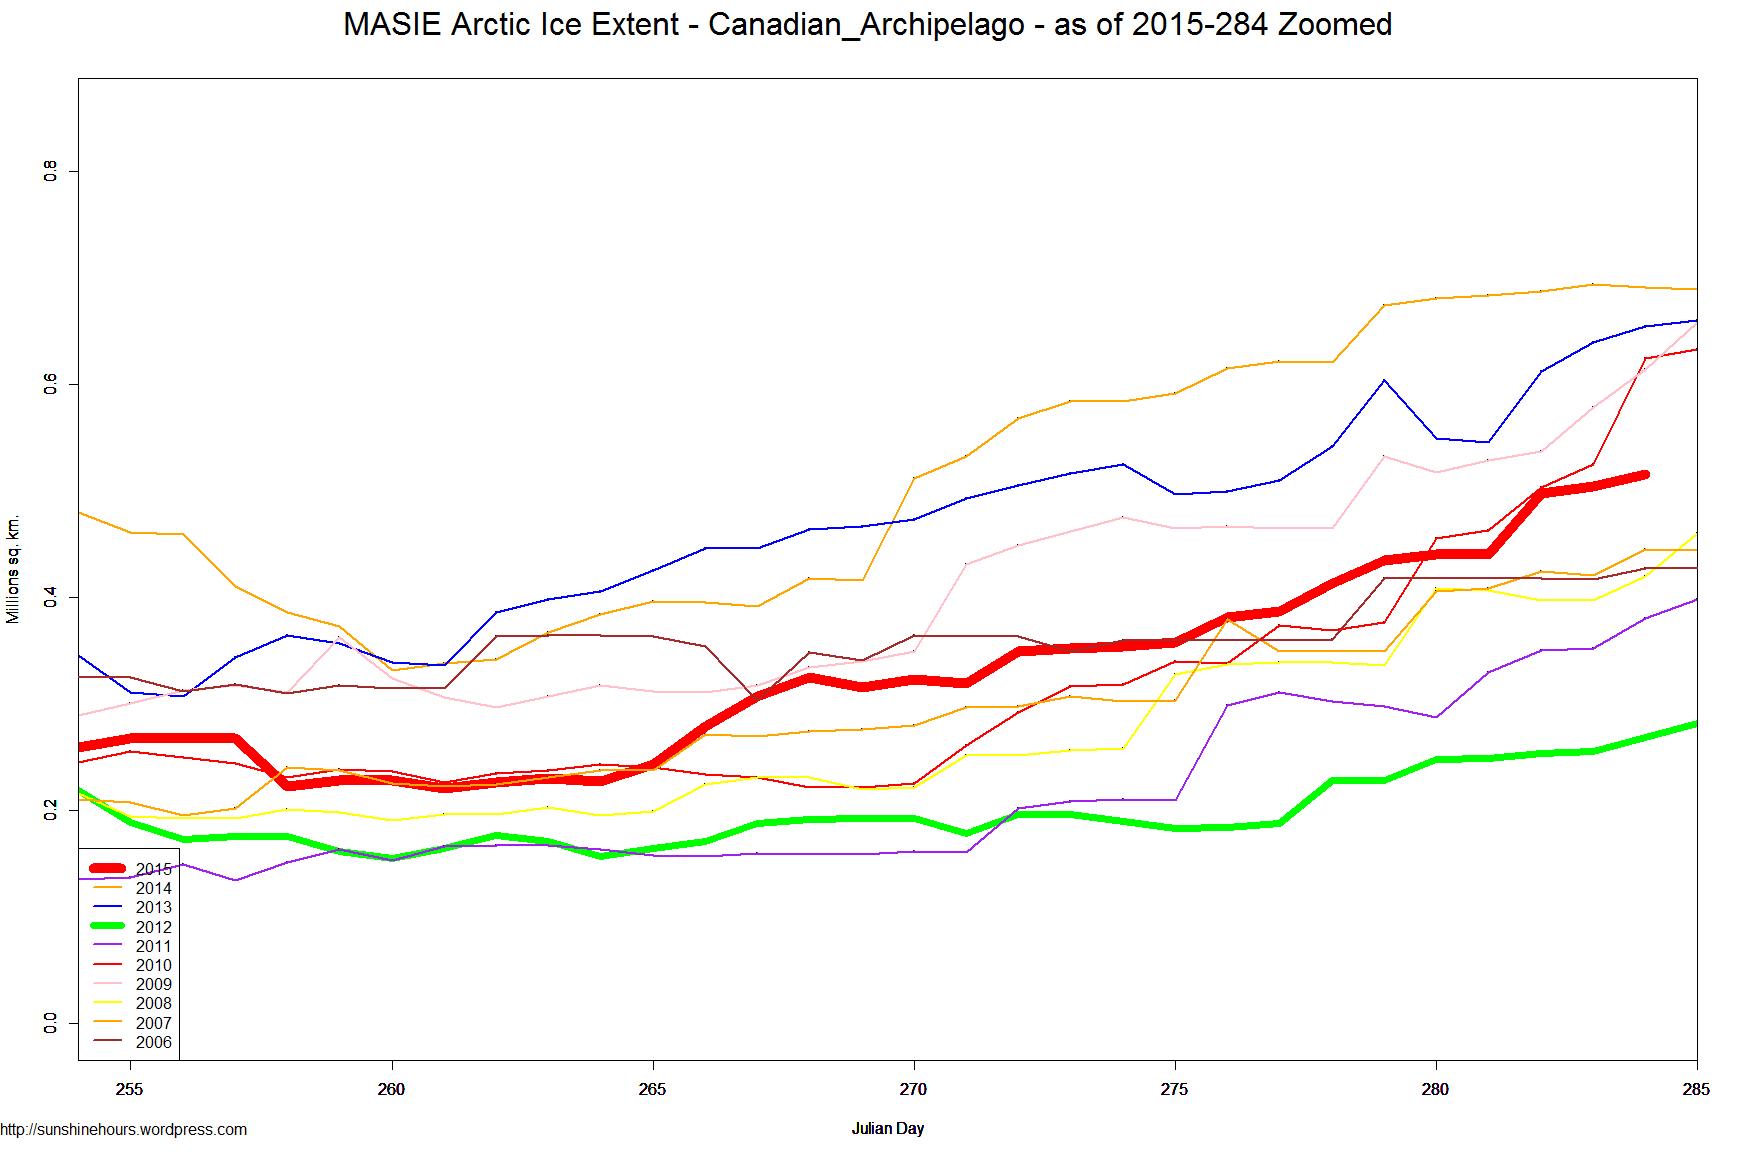
Canadian_Archipelago 247867.94
Hudson_Bay 543.62
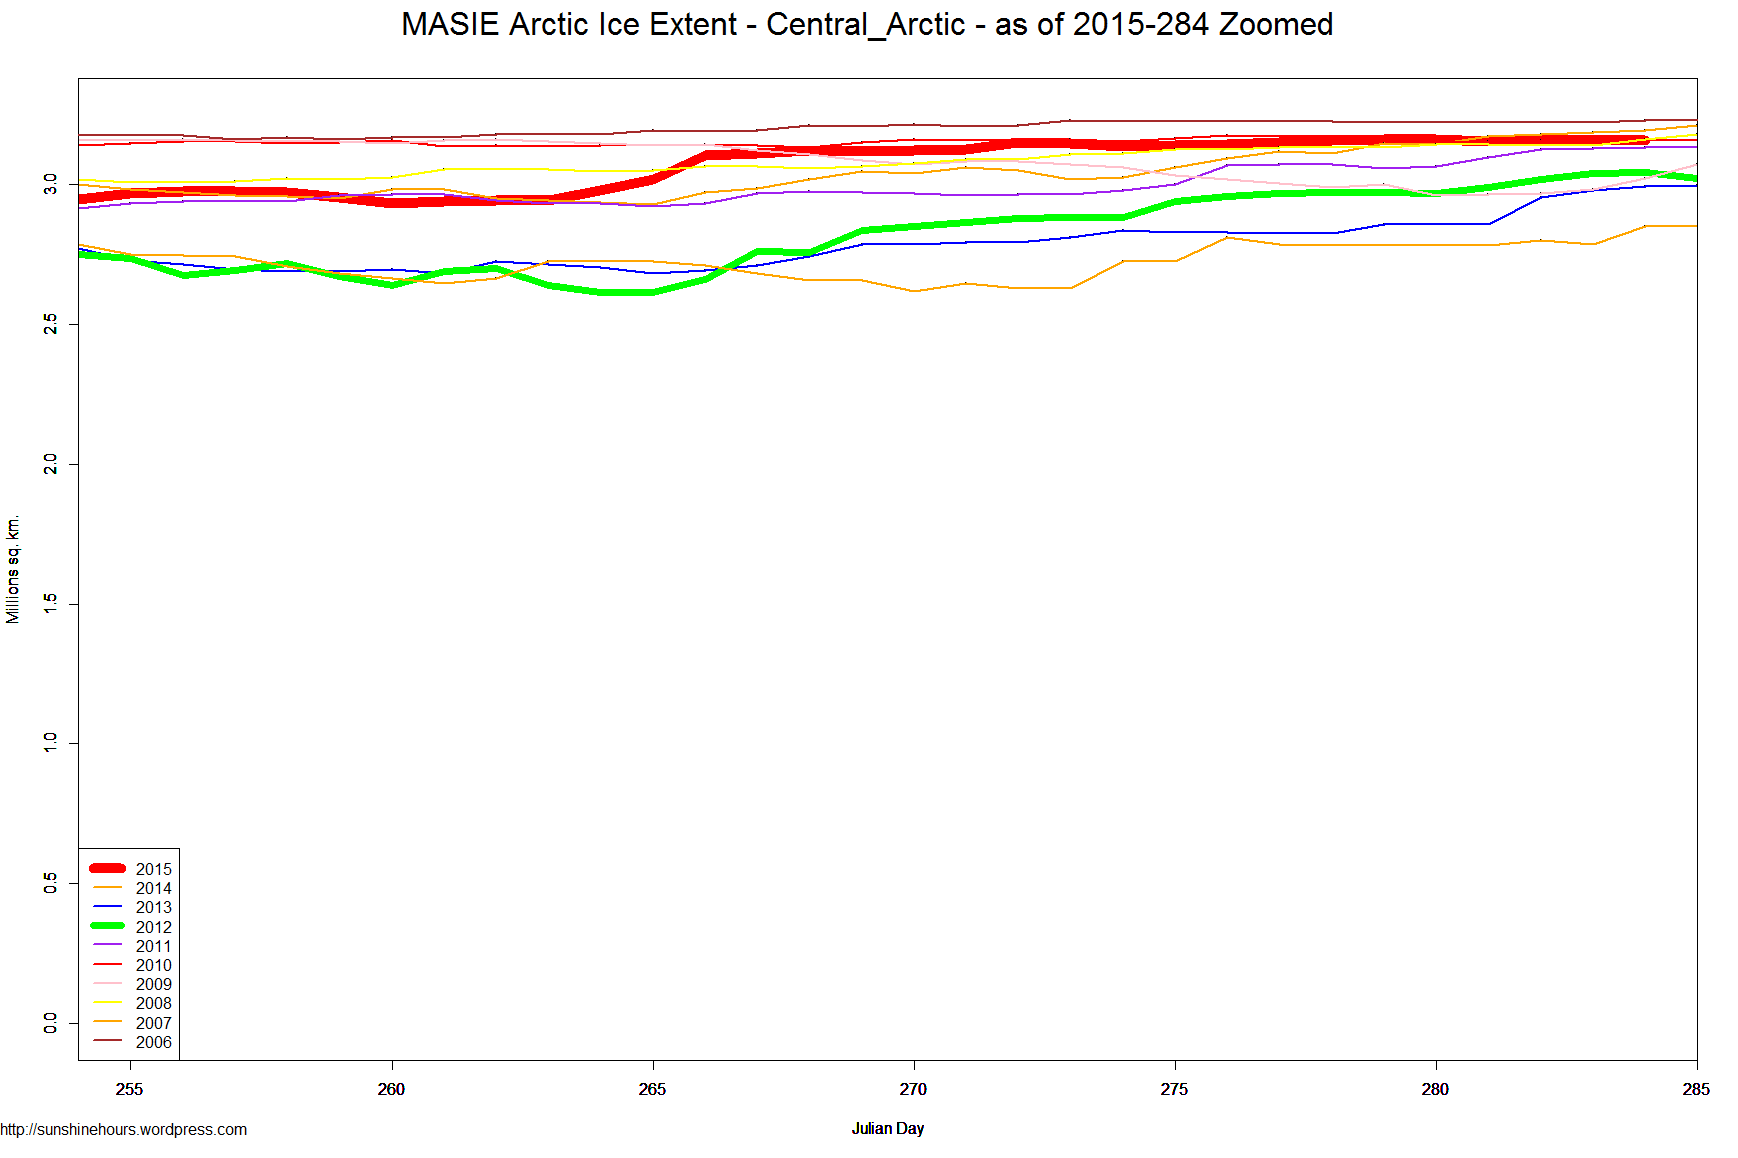
Central_Arctic 116826.83
Bering_Sea 0
Baltic_Sea 0
Sea_of_Okhotsk 0
Yellow_Sea 0


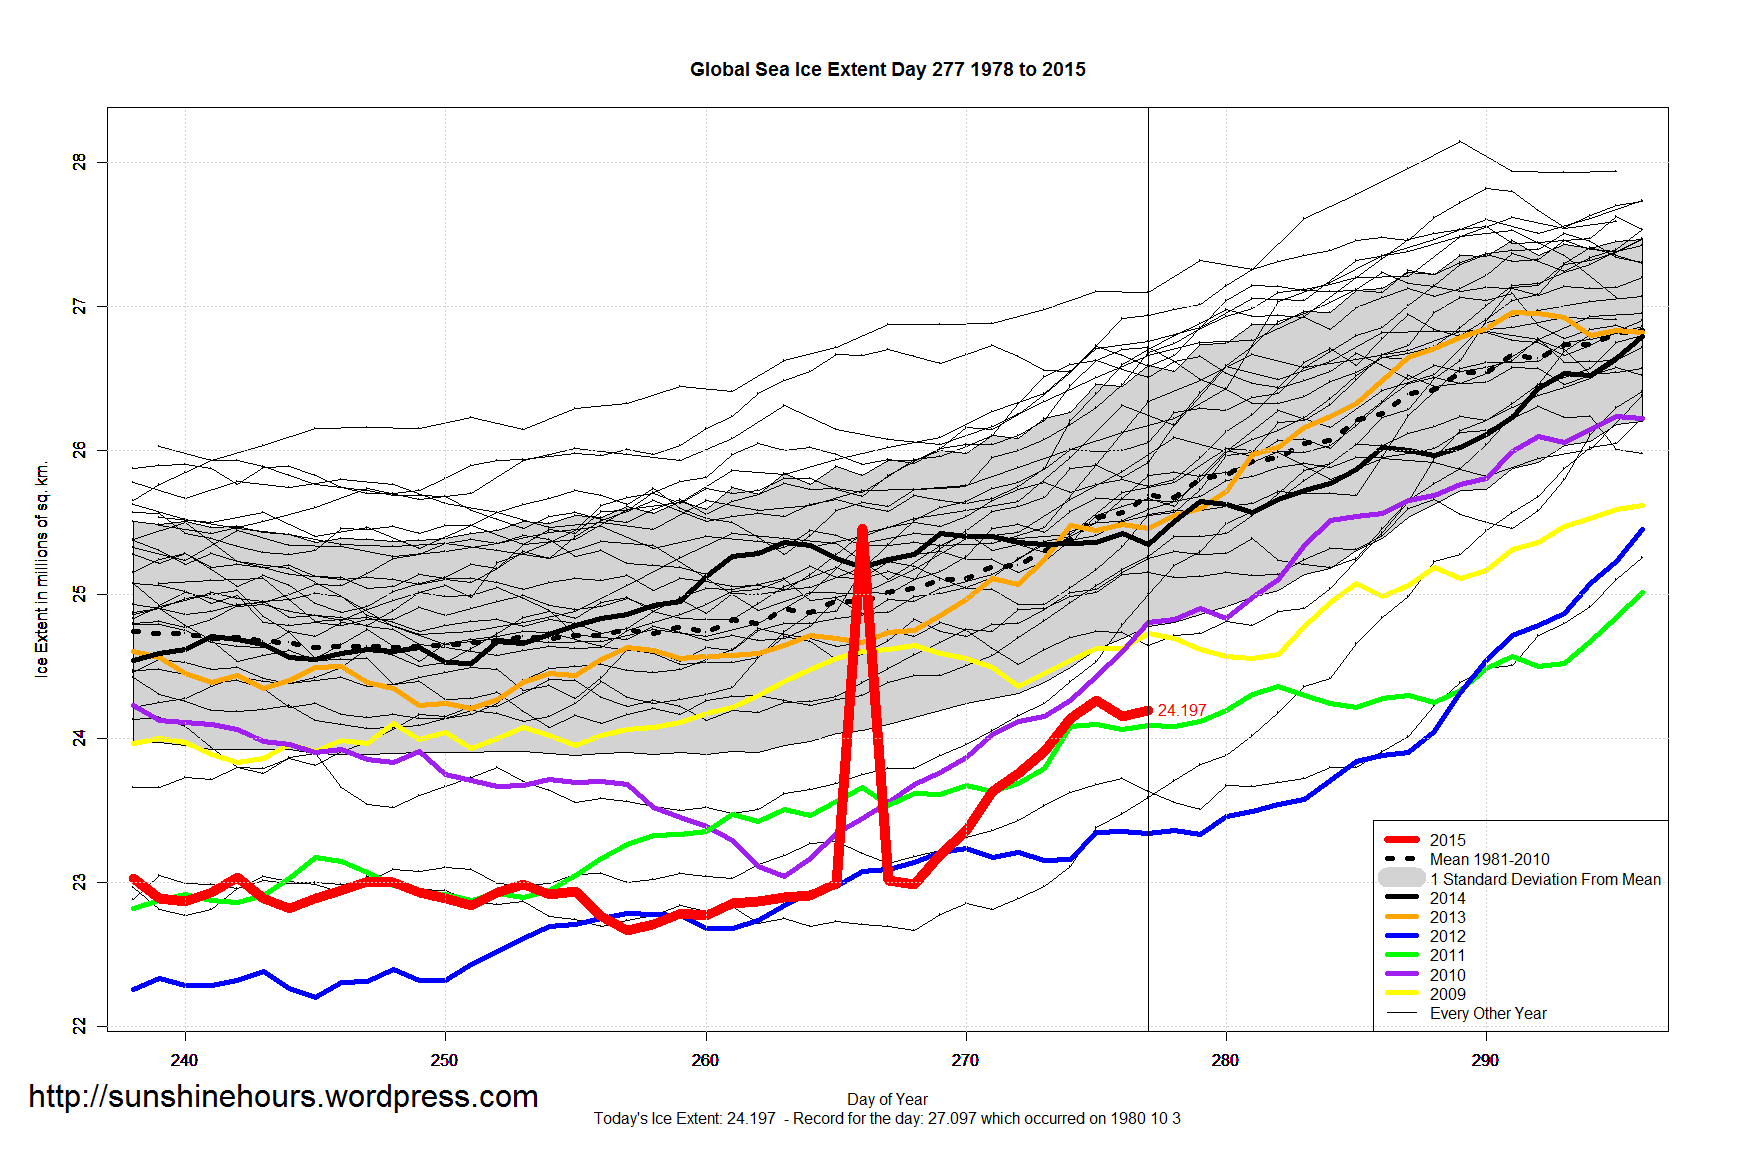
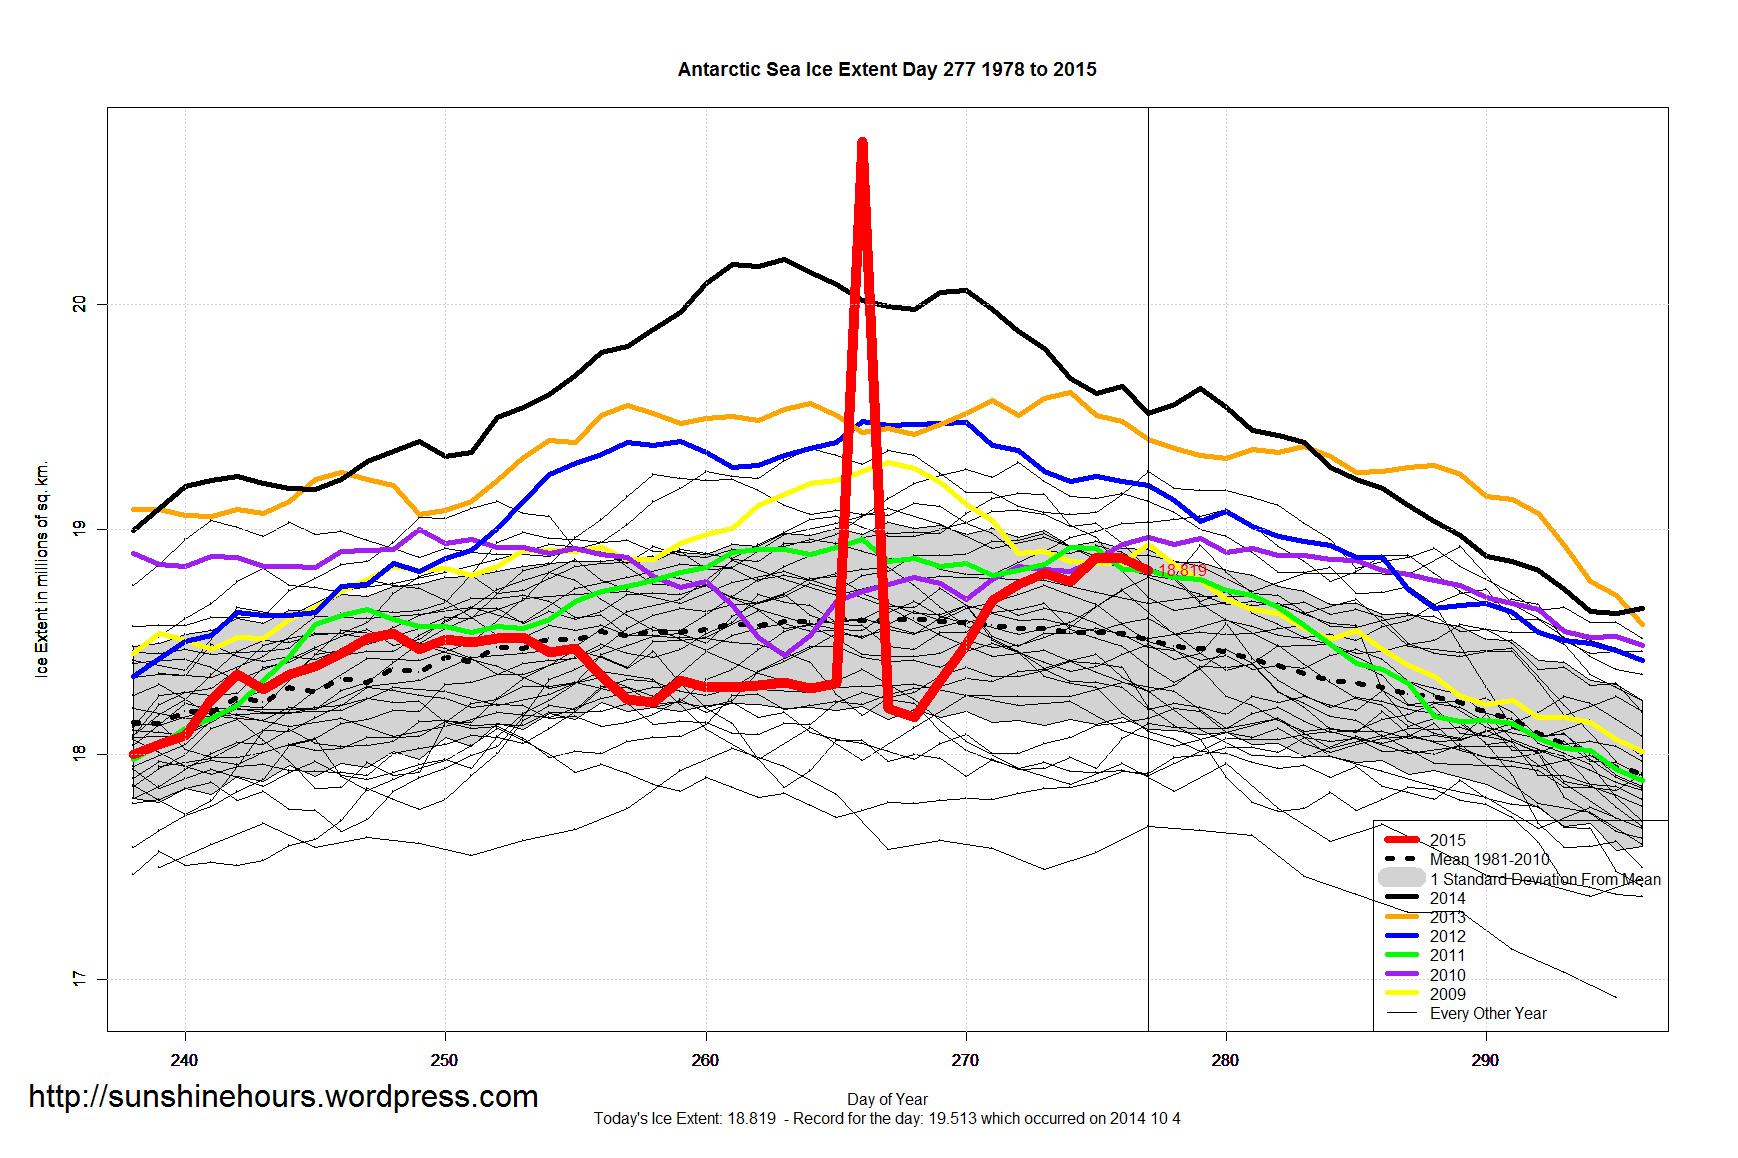
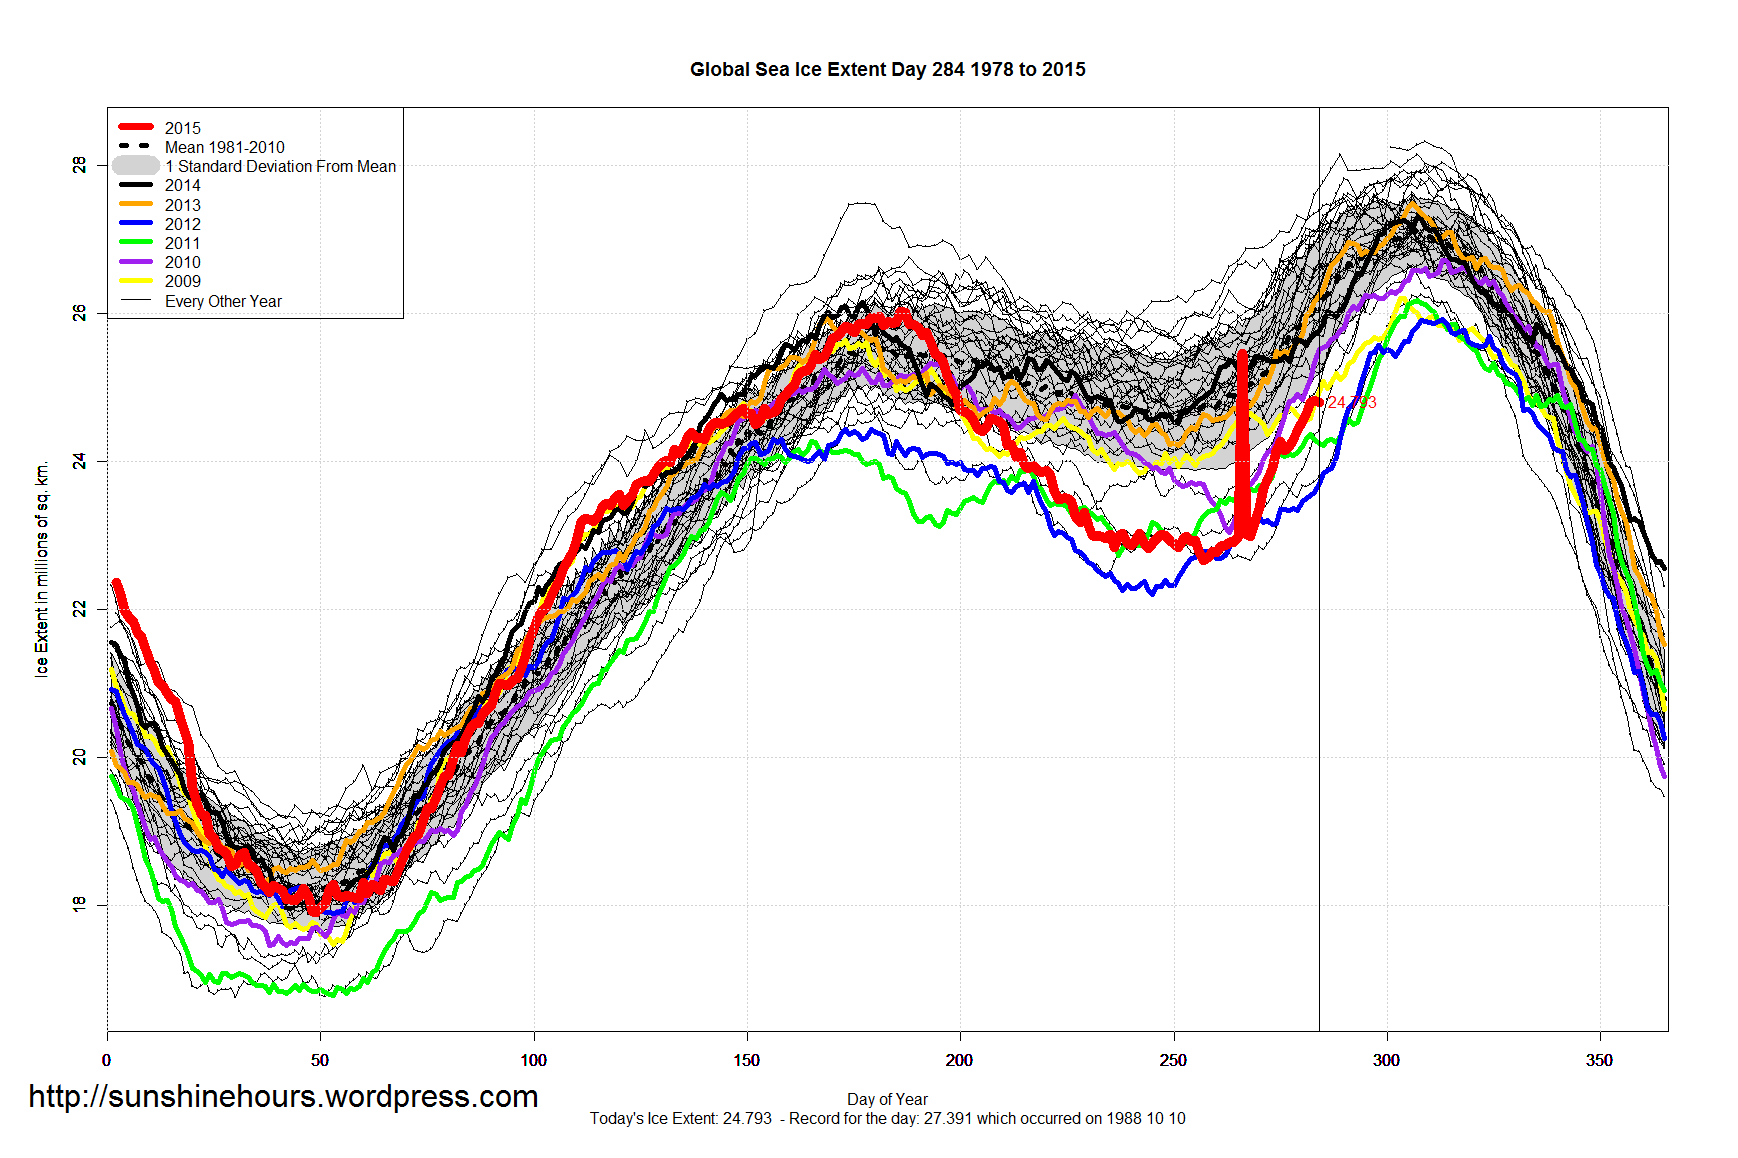
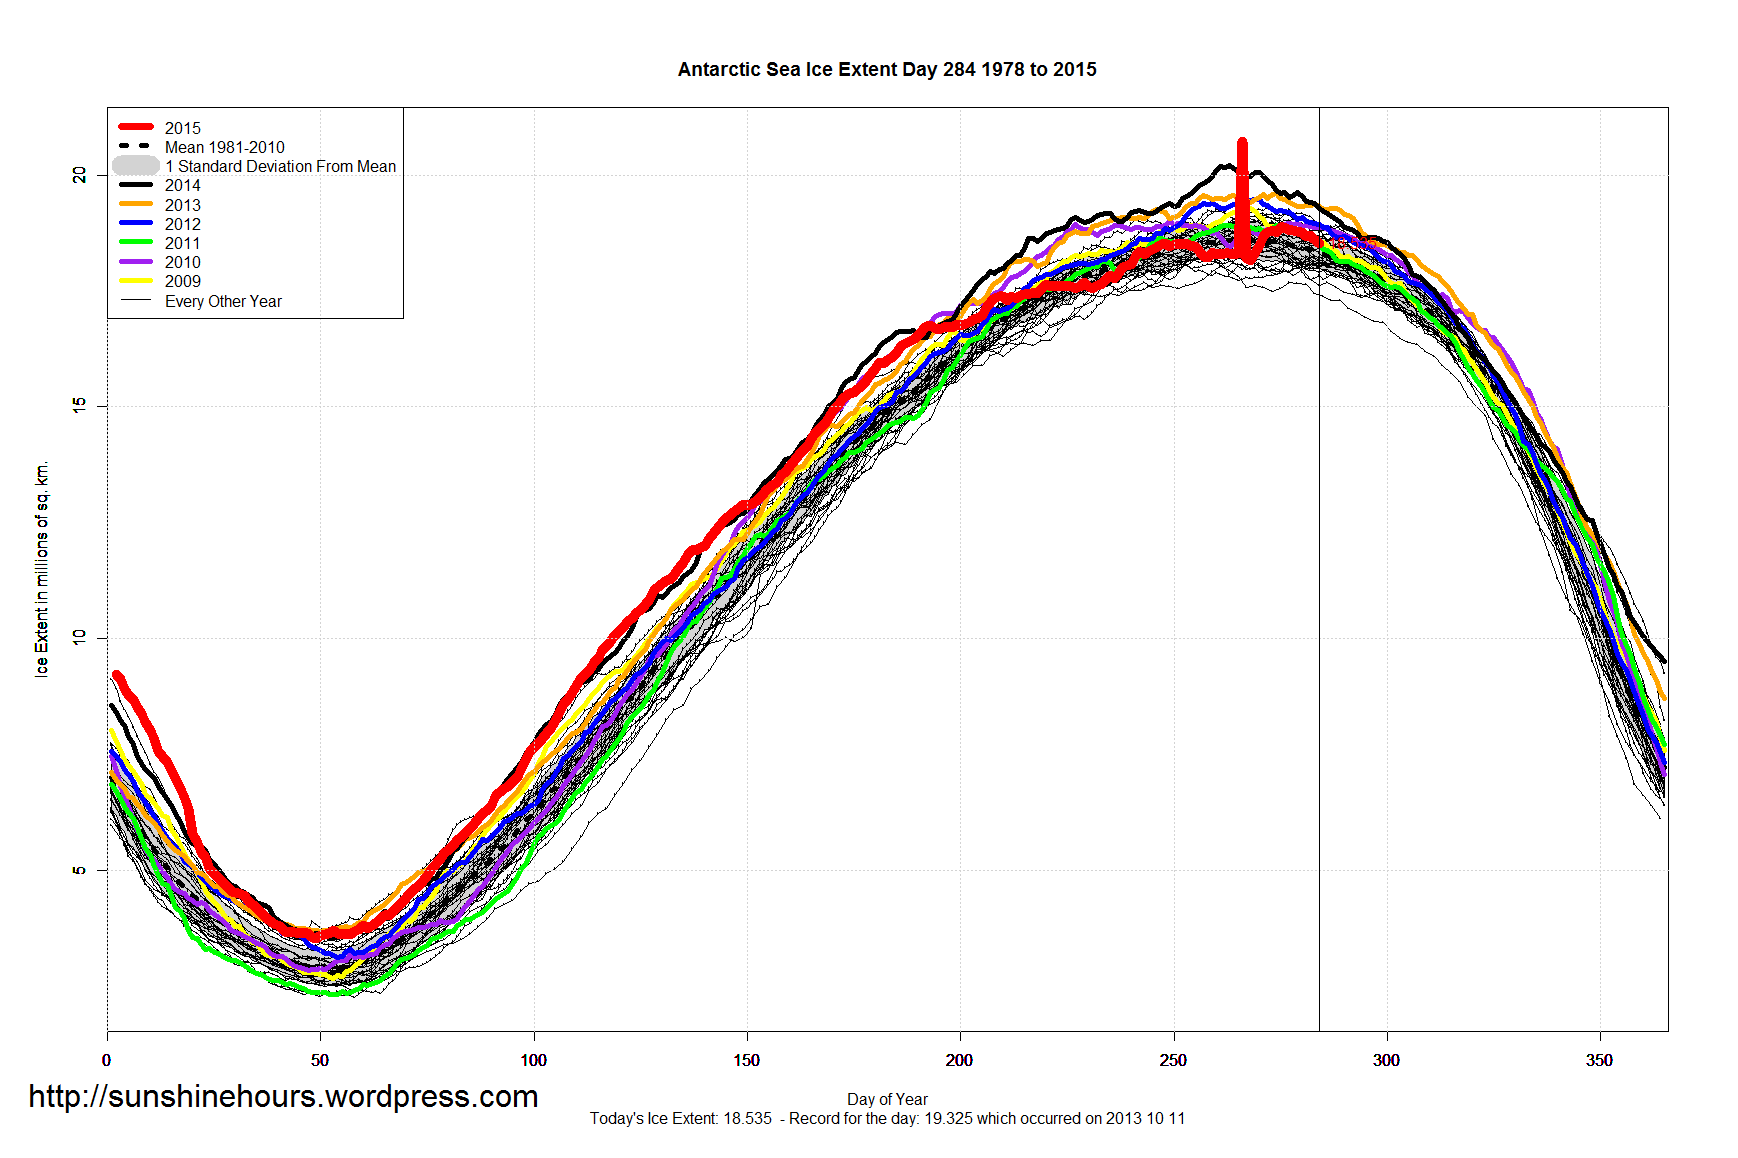
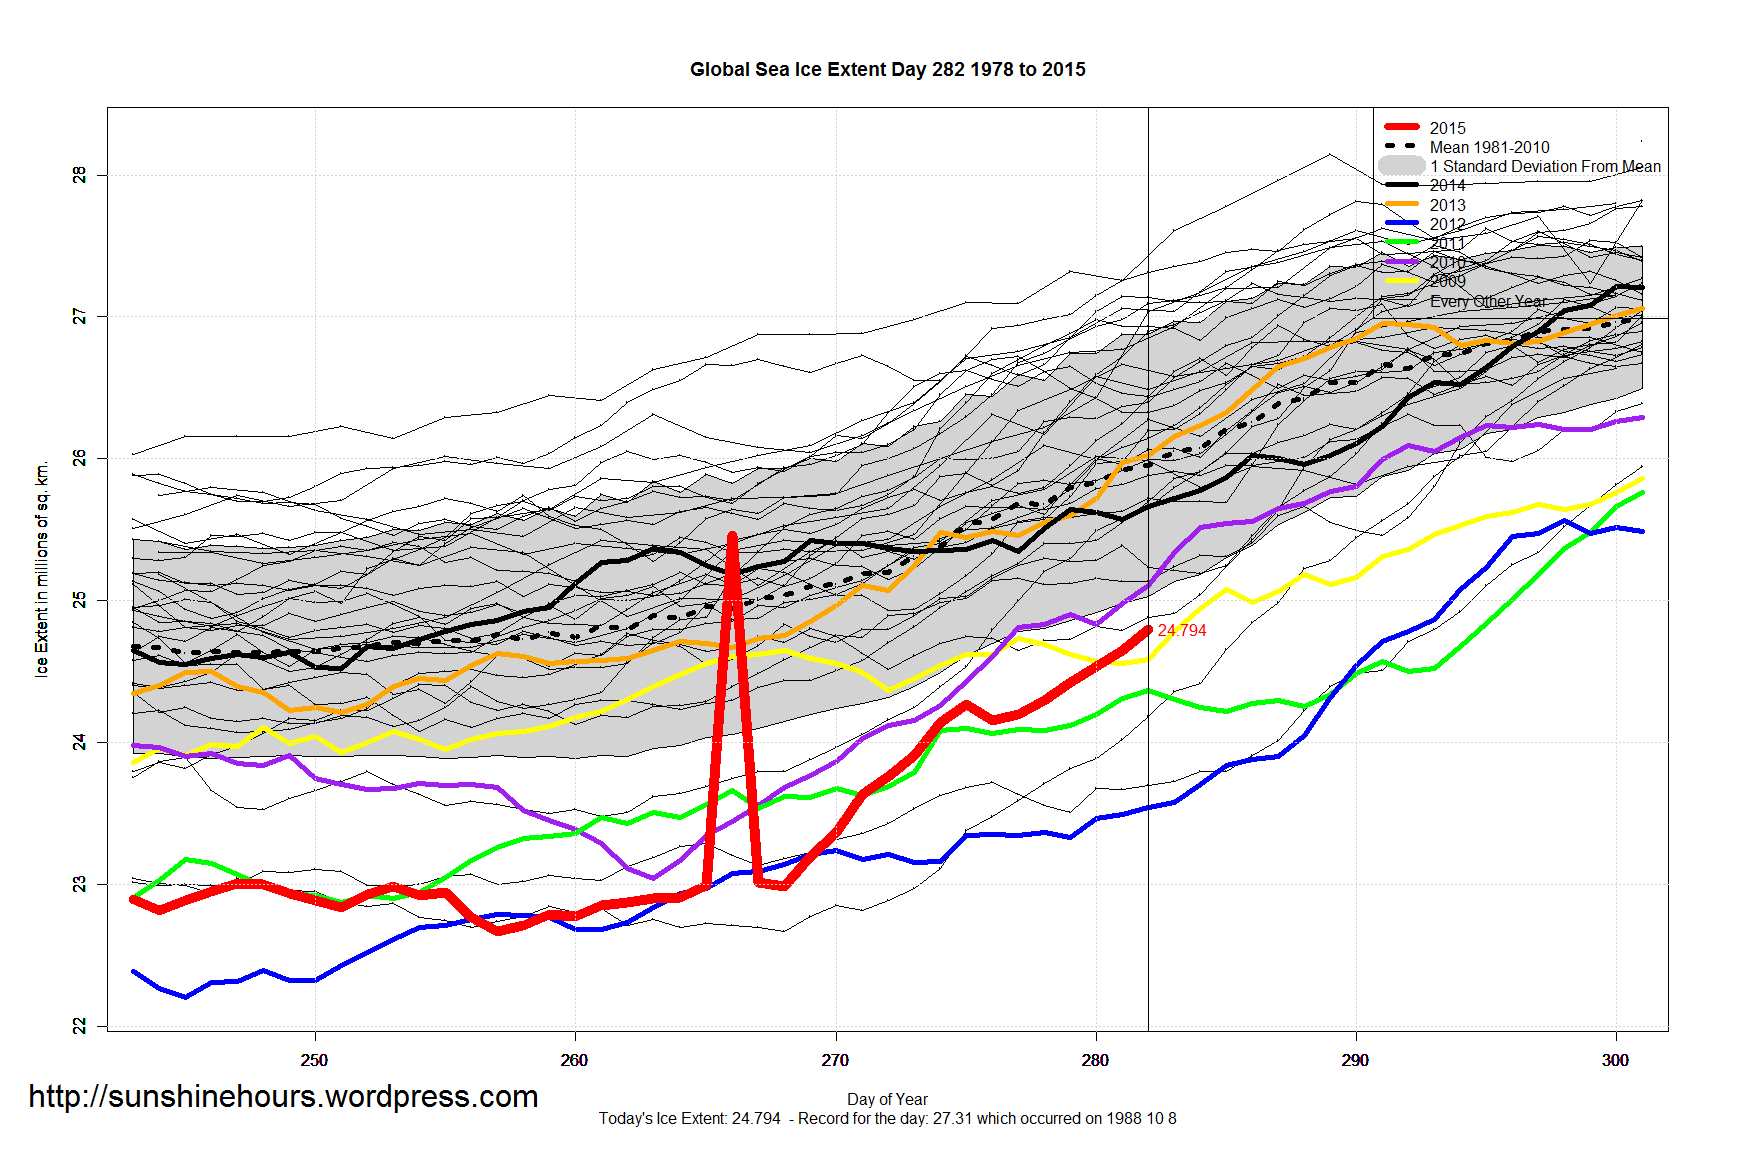
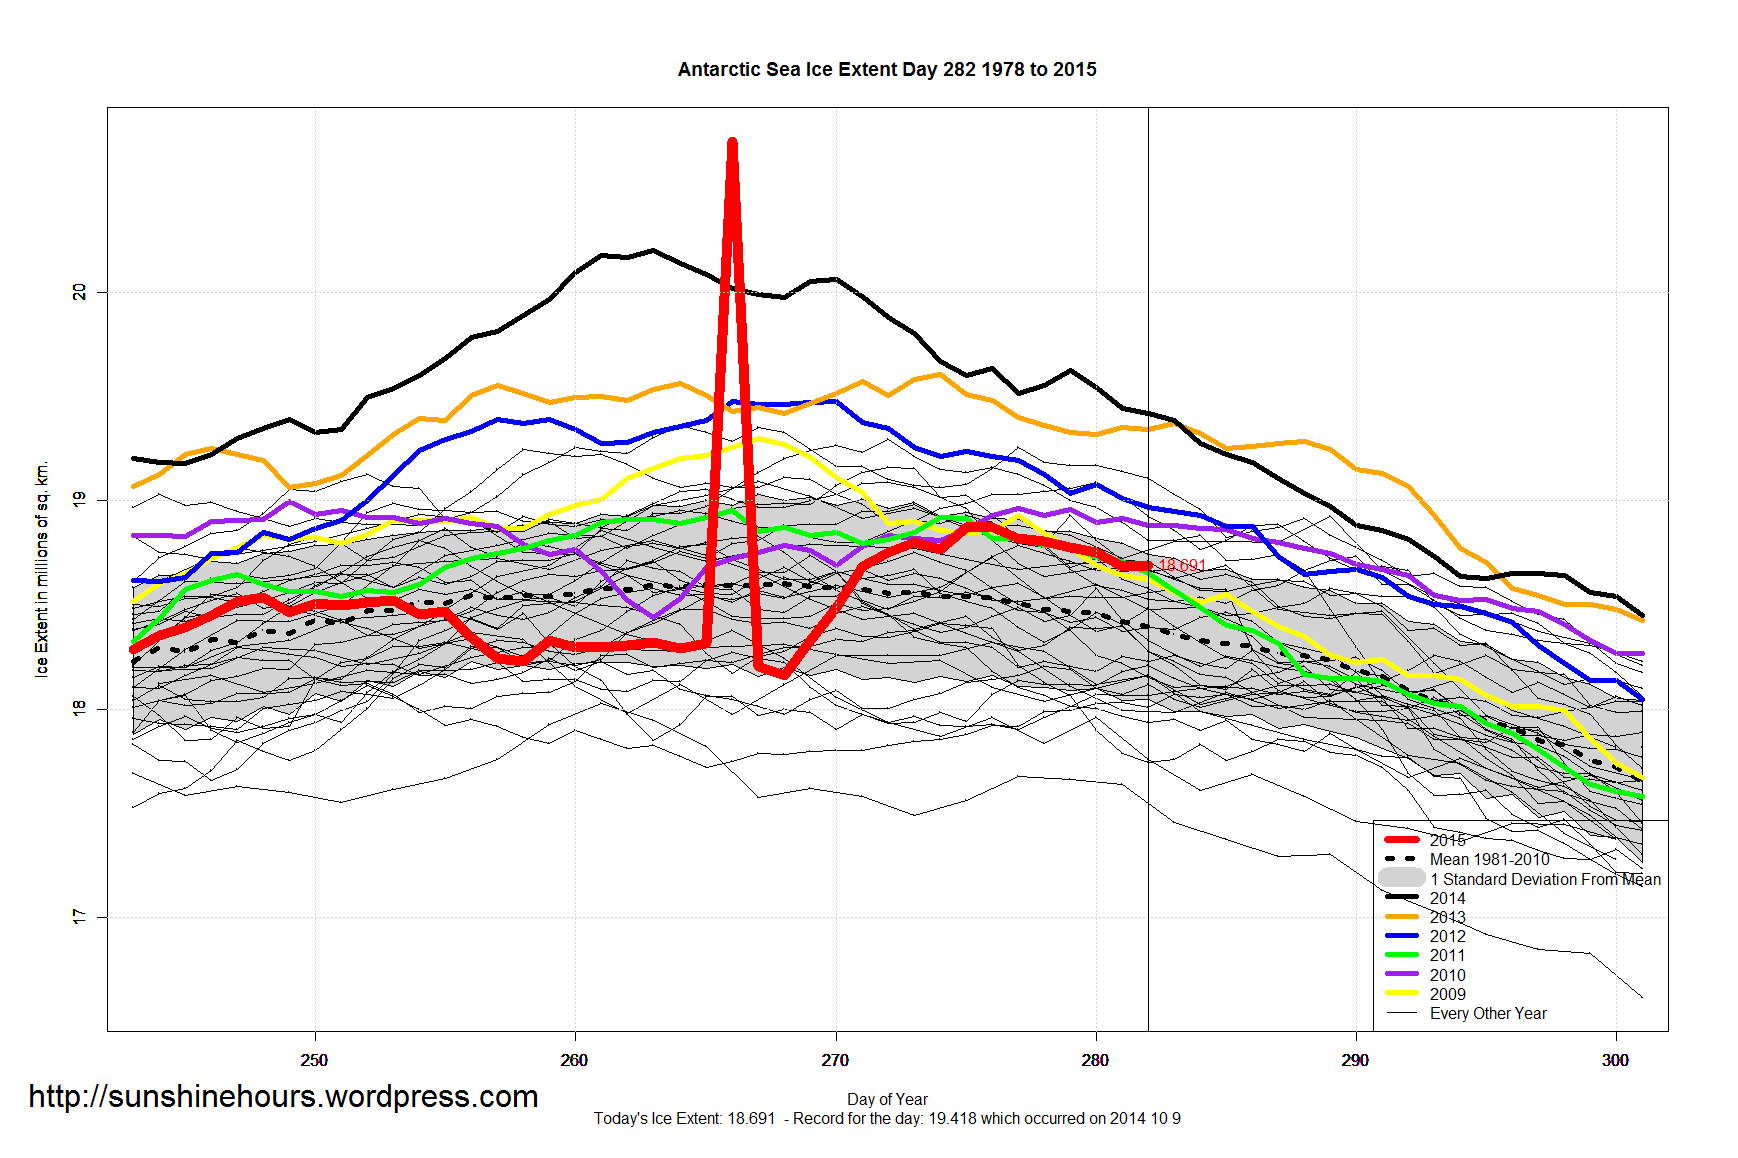
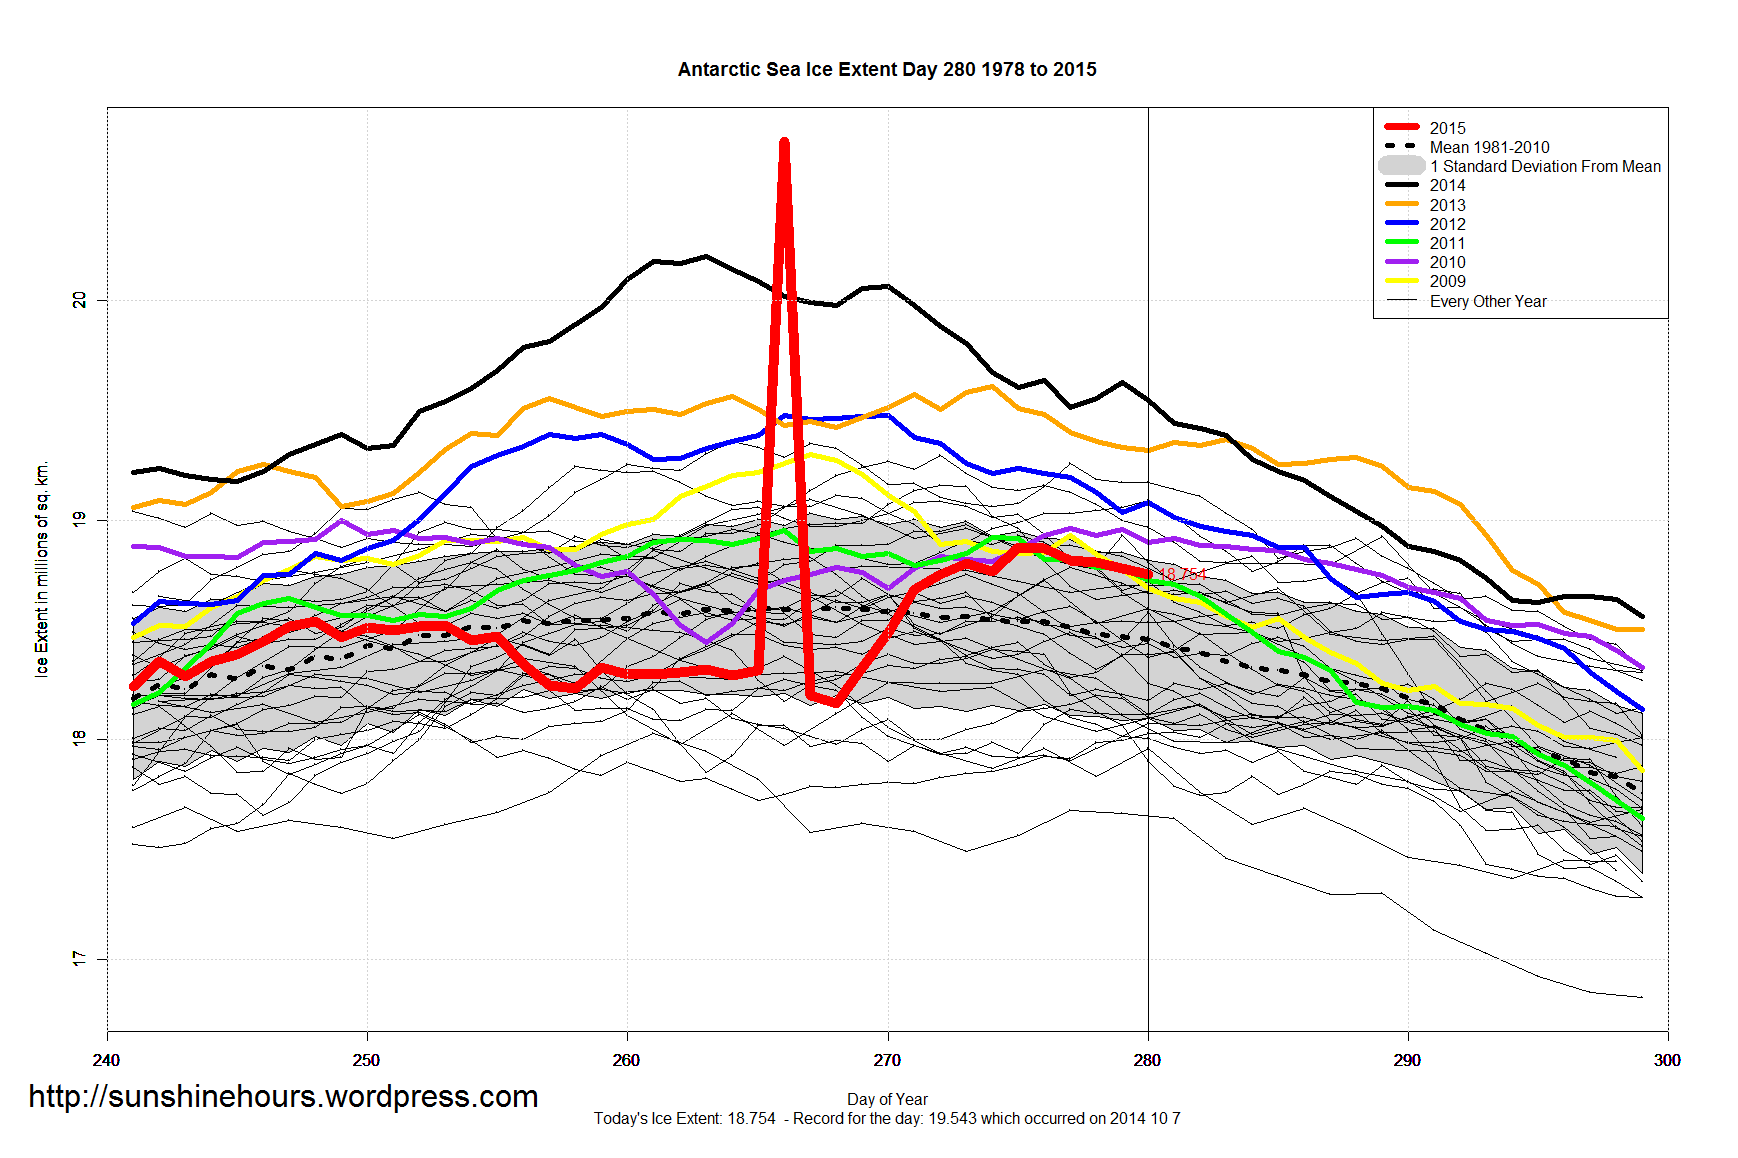
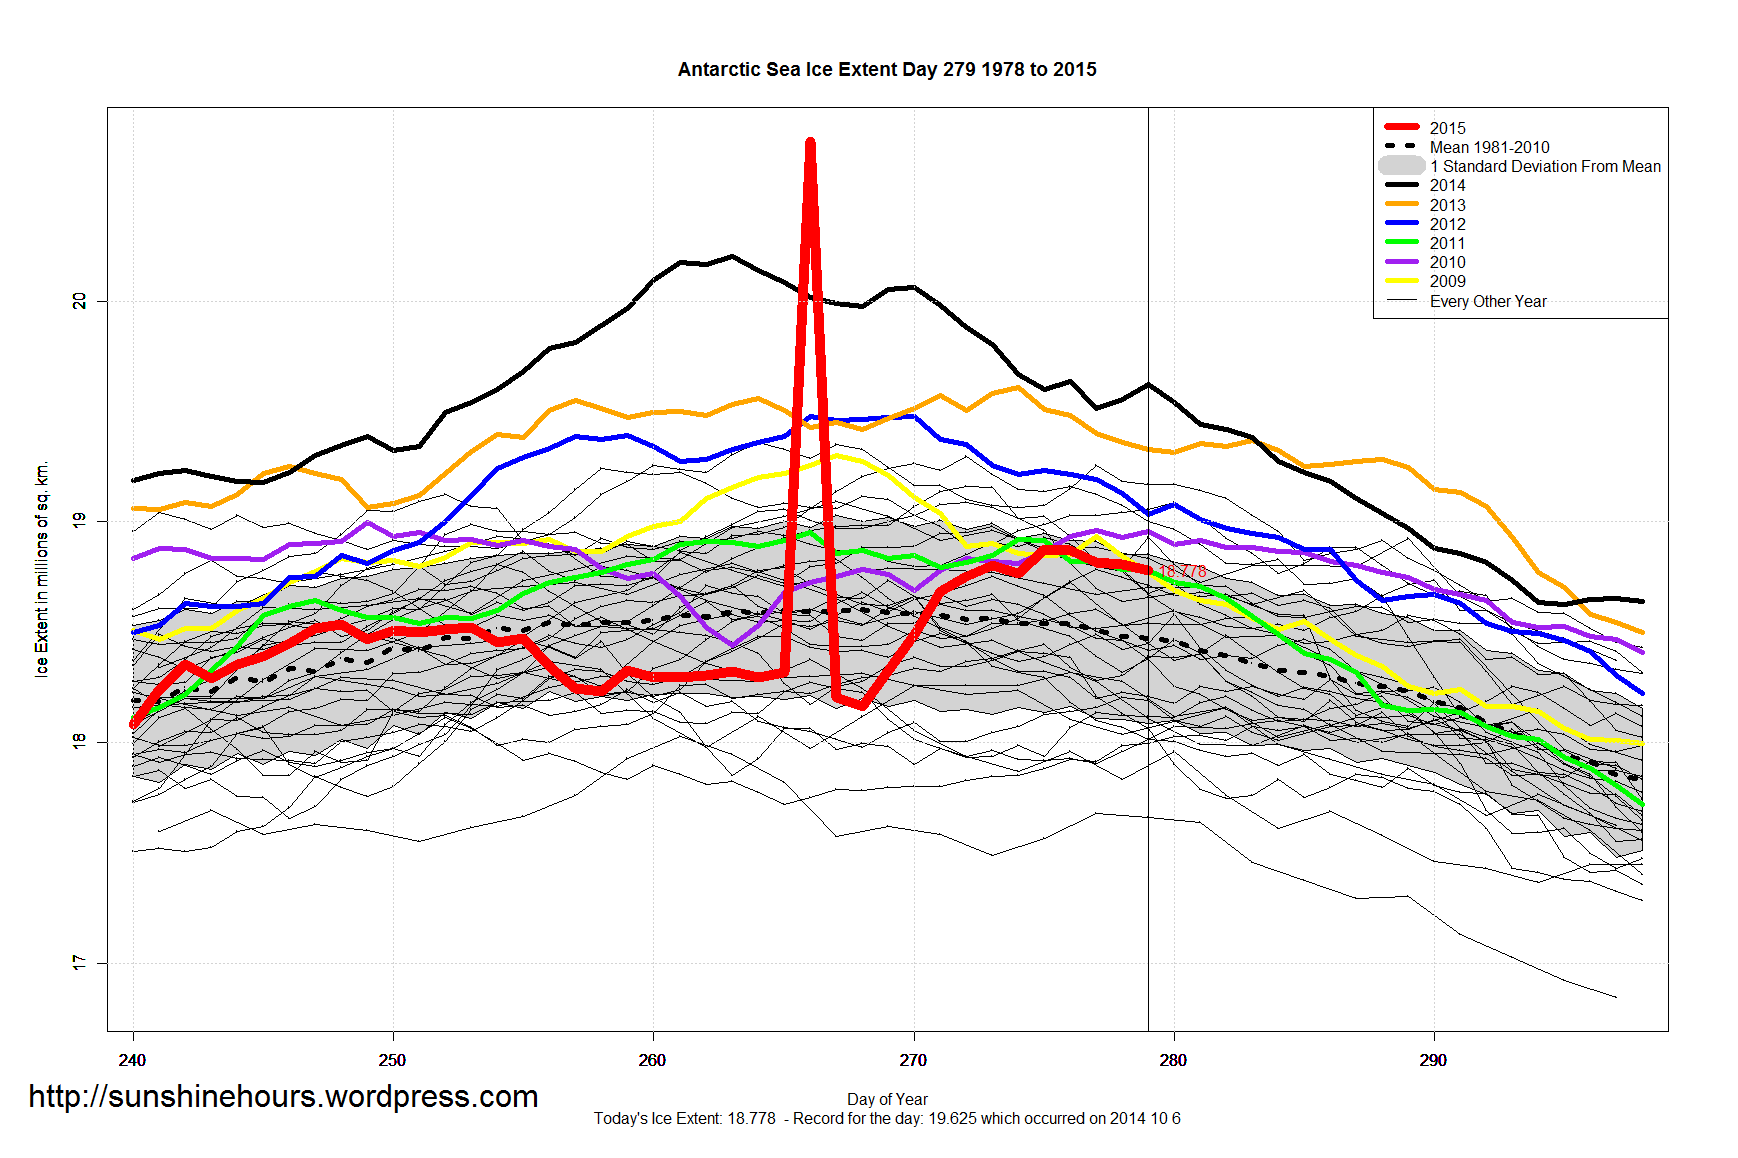
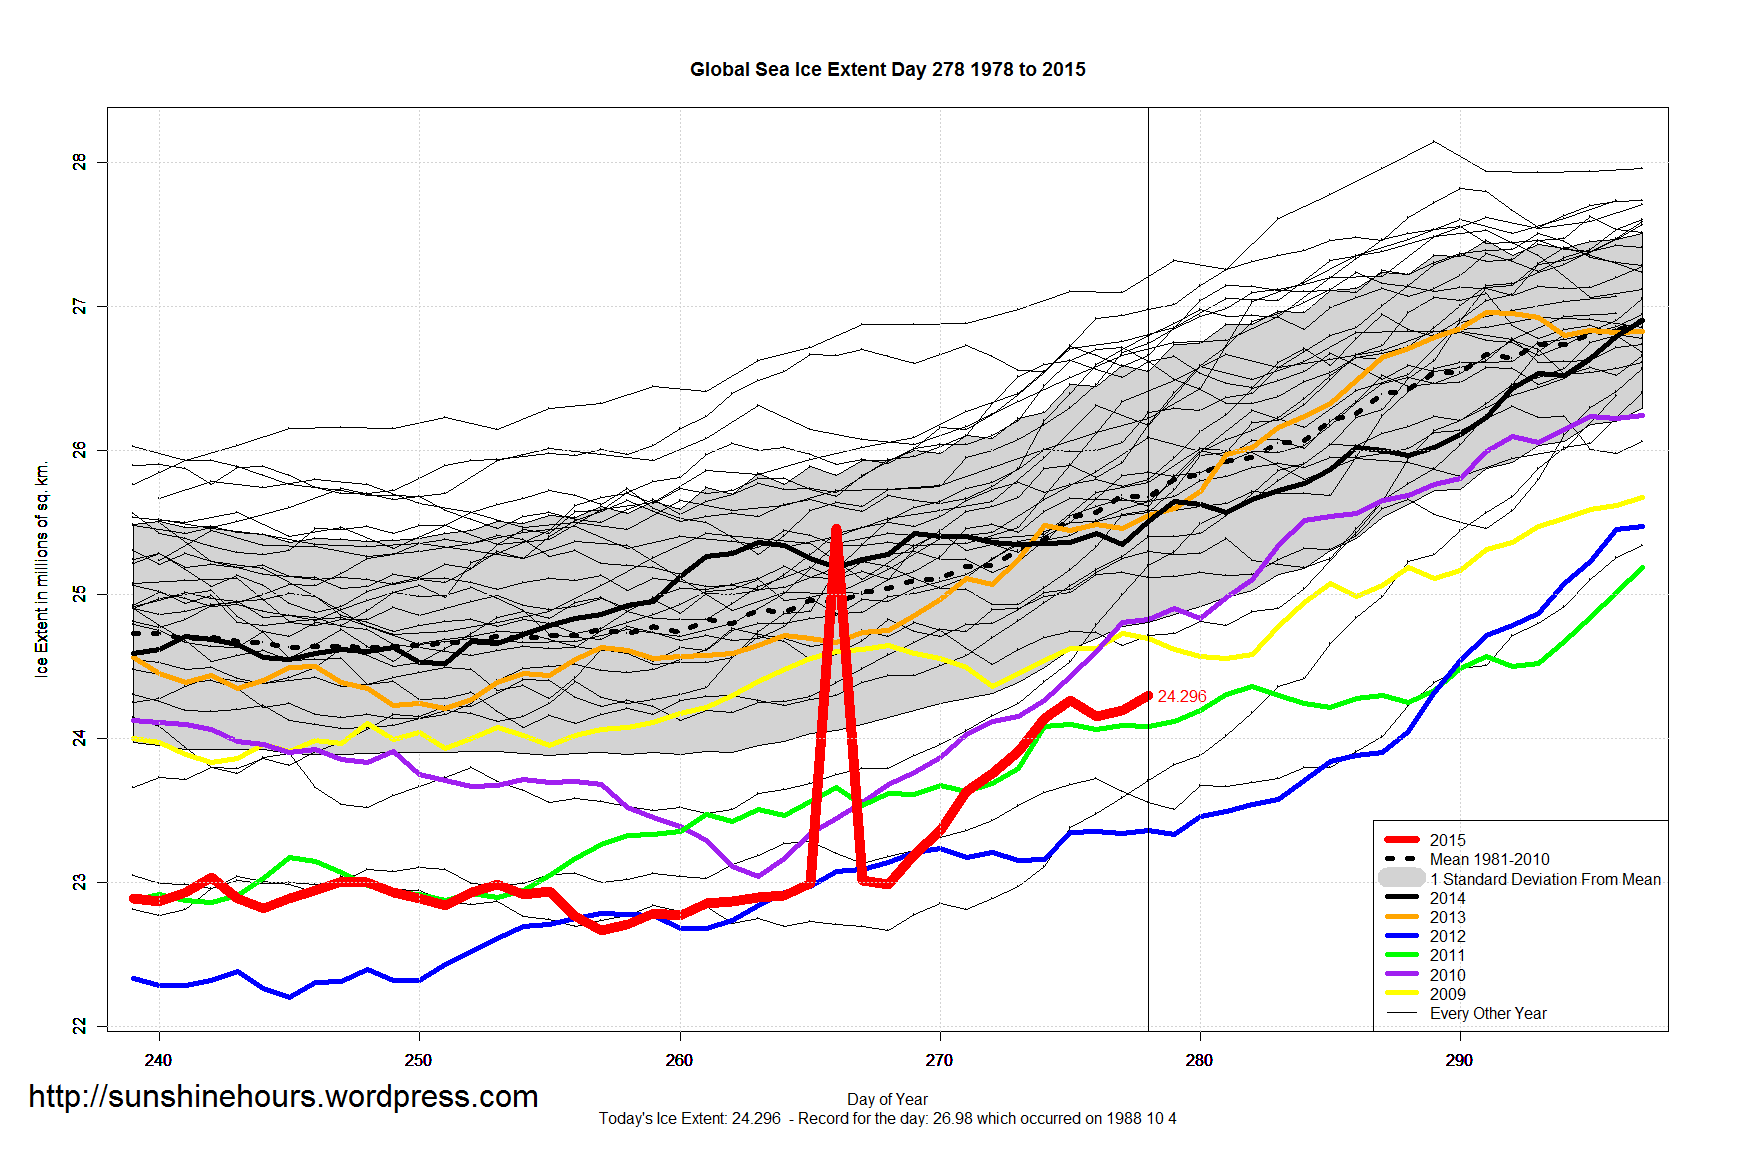
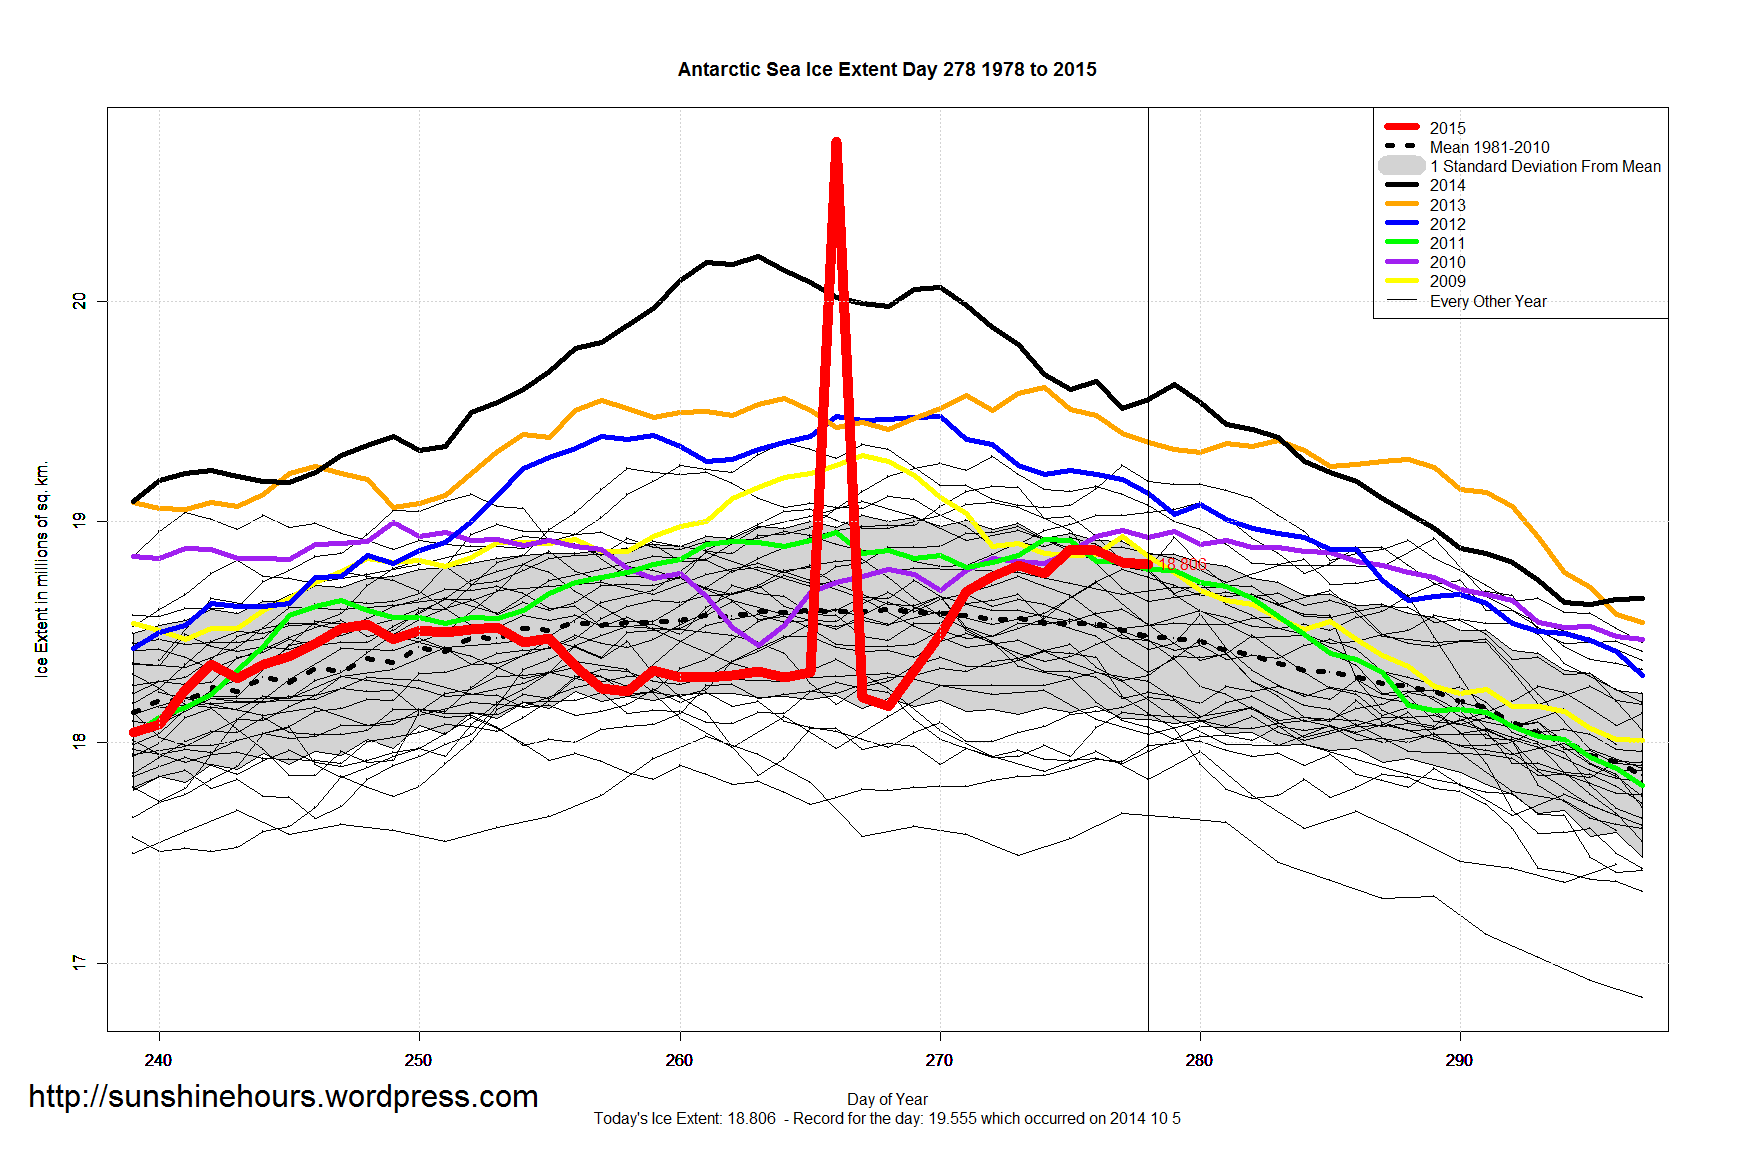
If Antarctica has reached max (and certainly I make no predictions this year)
| Year | Min | Max | dMax | dMin | Avg_Anomaly |
| 1979 | 2.915 | 18.368 | 256 | 48 | 0.04 |
| 1980 | 2.527 | 19.092 | 267 | 57 | -0.39 |
| 1981 | 2.695 | 18.86 | 261 | 51 | -0.21 |
| 1982 | 2.893 | 18.551 | 246 | 52 | -0.02 |
| 1983 | 2.847 | 18.811 | 263 | 55 | -0.25 |
| 1984 | 2.383 | 18.378 | 266 | 58 | -0.2 |
| 1985 | 2.602 | 18.933 | 254 | 50 | -0.04 |
| 1986 | 2.954 | 18.027 | 261 | 65 | -0.55 |
| 1987 | 3.016 | 18.524 | 258 | 52 | -0.24 |
| 1988 | 2.639 | 18.785 | 277 | 55 | -0.14 |
| 1989 | 2.723 | 18.274 | 266 | 51 | -0.23 |
| 1990 | 2.784 | 18.379 | 273 | 53 | -0.24 |
| 1991 | 2.554 | 18.671 | 273 | 58 | -0.11 |
| 1992 | 2.492 | 18.467 | 255 | 54 | -0.24 |
| 1993 | 2.281 | 18.71 | 263 | 50 | -0.23 |
| 1994 | 3.083 | 18.827 | 243 | 43 | 0.12 |
| 1995 | 3.33 | 18.736 | 269 | 55 | 0.15 |
| 1996 | 2.597 | 18.831 | 267 | 56 | 0.13 |
| 1997 | 2.264 | 18.792 | 265 | 58 | -0.26 |
| 1998 | 2.772 | 19.244 | 258 | 56 | 0.08 |
| 1999 | 2.707 | 18.981 | 273 | 51 | 0.11 |
| 2000 | 2.582 | 19.159 | 272 | 49 | 0.11 |
| 2001 | 3.441 | 18.494 | 271 | 50 | 0.02 |
| 2002 | 2.697 | 18.116 | 252 | 51 | -0.43 |
| 2003 | 3.626 | 18.68 | 268 | 48 | 0.32 |
| 2004 | 3.259 | 19.124 | 252 | 51 | 0.32 |
| 2005 | 2.804 | 19.295 | 272 | 49 | 0.04 |
| 2006 | 2.487 | 19.36 | 264 | 51 | -0.19 |
| 2007 | 2.723 | 19.086 | 272 | 50 | 0.03 |
| 2008 | 3.692 | 18.298 | 247 | 51 | 0.6 |
| 2009 | 2.671 | 19.299 | 267 | 53 | 0.39 |
| 2010 | 2.842 | 18.998 | 249 | 47 | 0.45 |
| 2011 | 2.319 | 18.954 | 266 | 53 | -0.15 |
| 2012 | 3.111 | 19.478 | 266 | 54 | 0.36 |
| 2013 | 3.679 | 19.608 | 274 | 50 | 0.87 |
| 2014 | 3.548 | 20.201 | 263 | 52 | 1.12 |
| 2015 (ignoring strange data) | 3.532 | 18.874 | 275 | 49 | |
| 2015 (using strange data) | 3.532 | 20.723 | 266 | 49 |