Antarctic Sea Ice Extent Sep 29 2014 – 1,376,000 sq km above the 1981-2010 mean. Data for Day 271. Data here.
188th daily record in 2014.


Antarctic Sea Ice Extent Sep 29 2014 – 1,376,000 sq km above the 1981-2010 mean. Data for Day 271. Data here.
188th daily record in 2014.
Arctic Sea Ice Extent Sep 28 2014 – -1,202,000 sq km below the 1981-2010 mean. Data for Day 270. Data here.


Antarctic Sea Ice Extent Sep 28 2014 – 1,431,000 sq km above the 1981-2010 mean. Data for Day 270. Data here.
8th day above 20 million sq km. Only 5,000 below day 269.


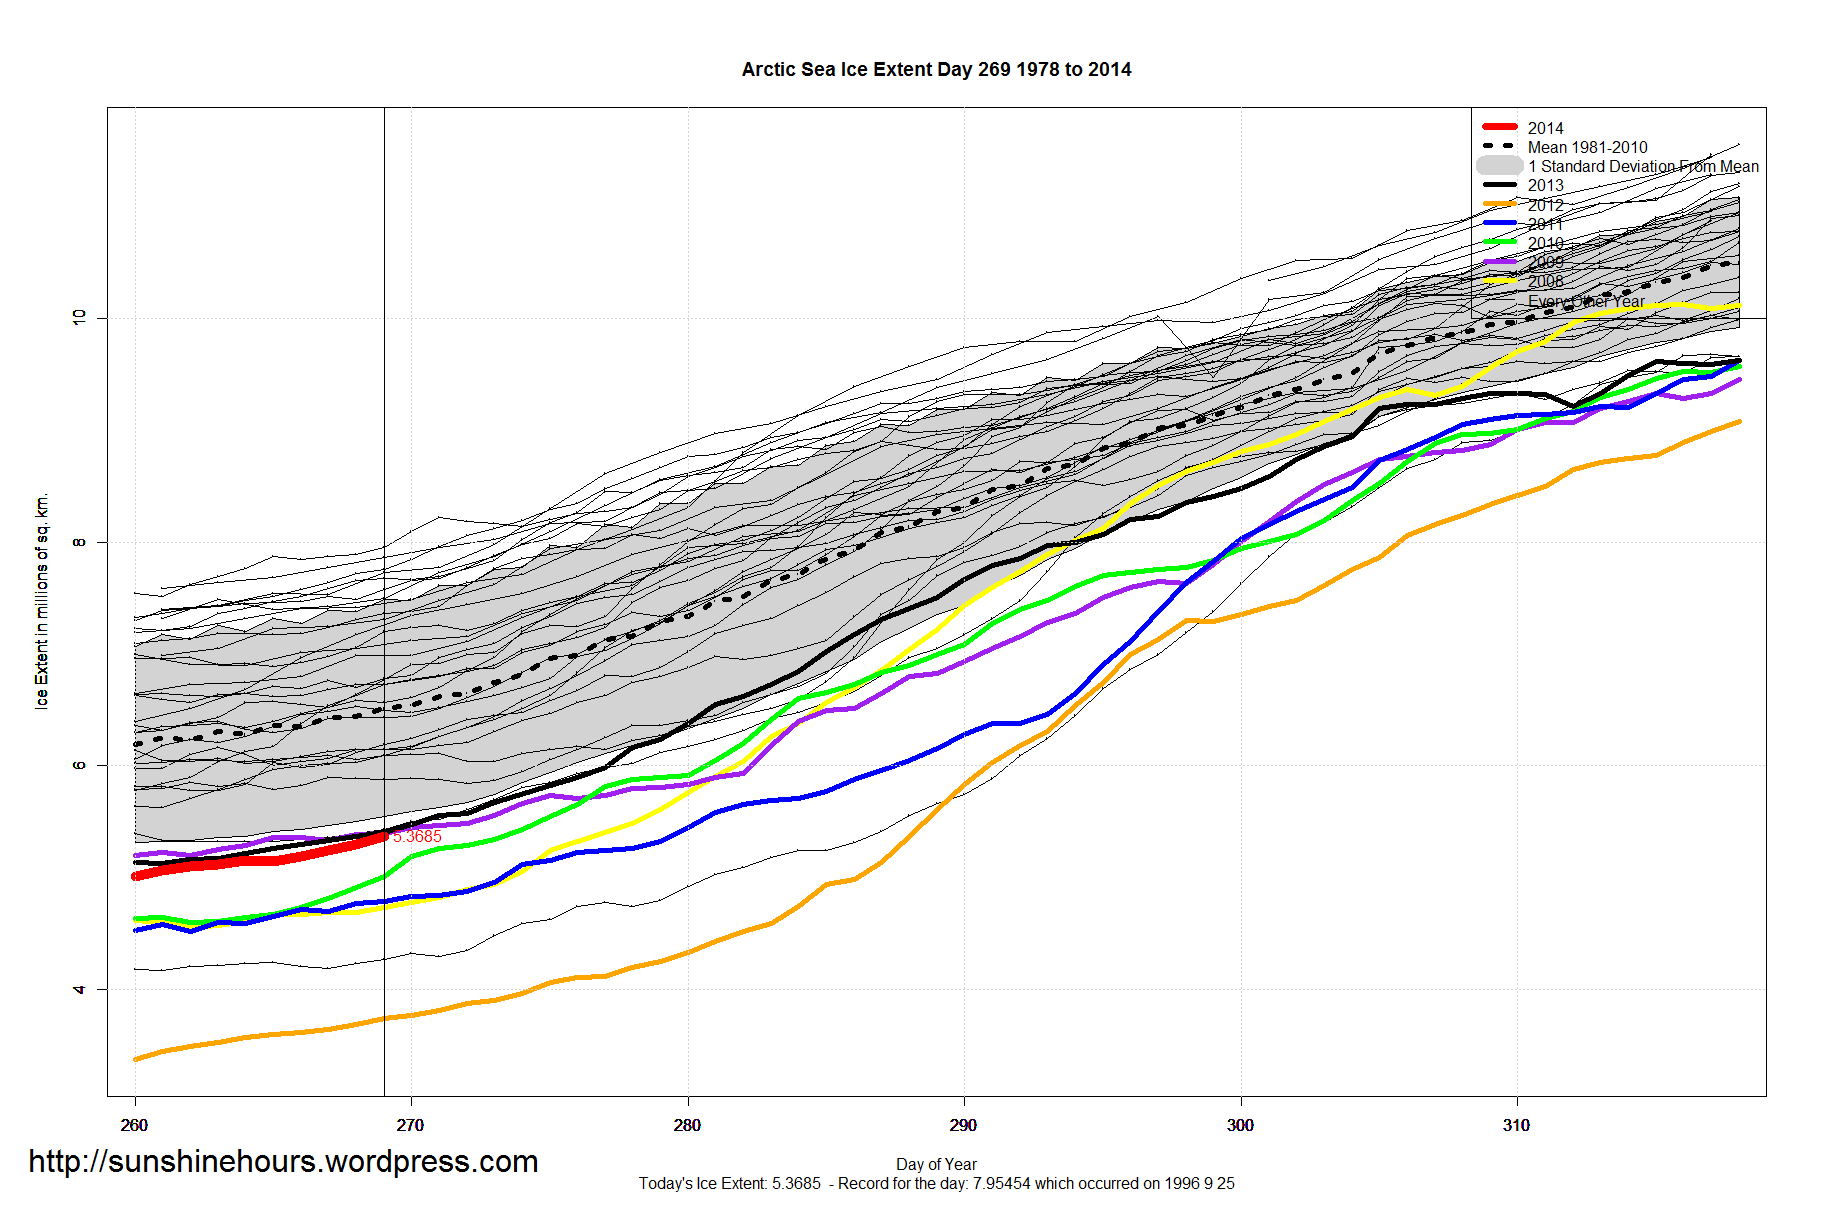
Arctic Sea Ice Extent Sep 27 2014 – -1,146,000 sq km below the 1981-2010 mean. Data for Day 269. Data here.

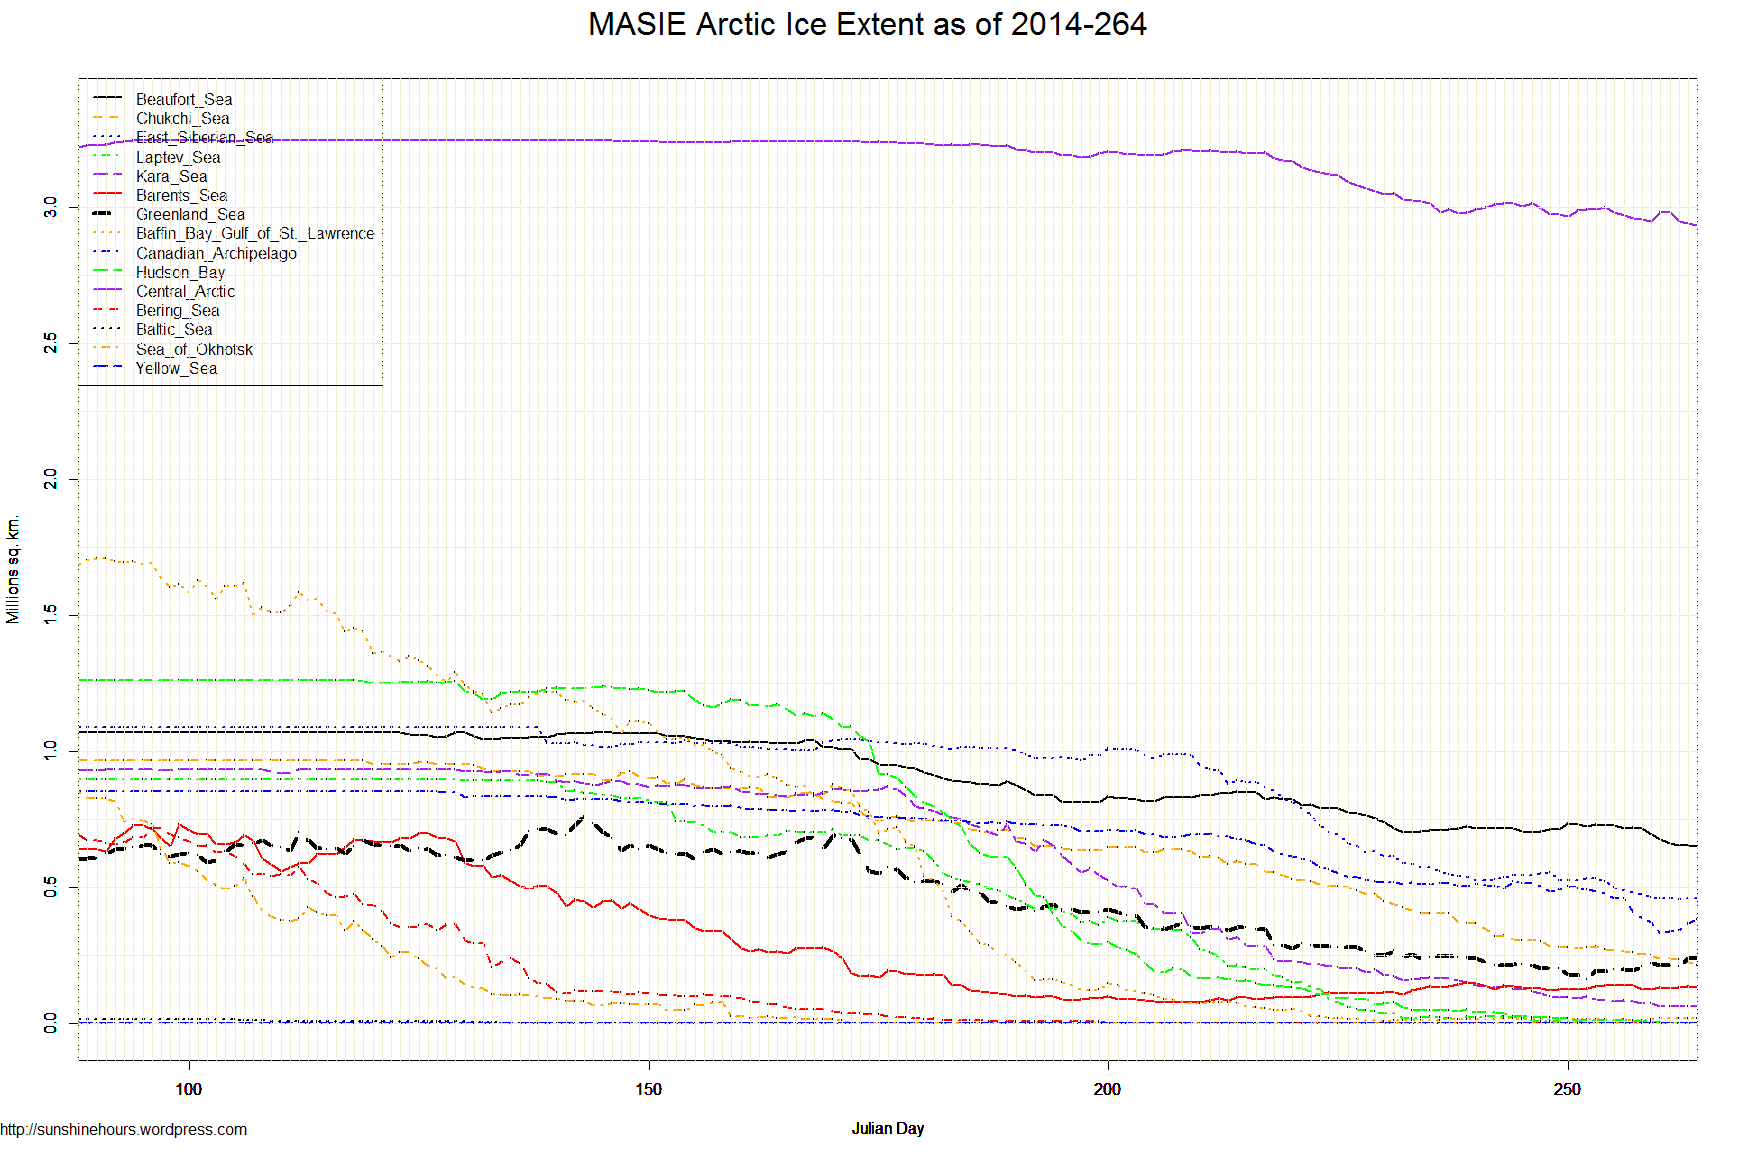
Sept 25 2014 MASIE Update – Still Rising
Data here. Click for bigger.
| Region | 180 days ago | End | Last 179 | Last 28 | Last 14 | Last 7 | Last 3 | Last 1 |
| Canadian Archipelago | 853,214 | 391,419 | -461,795 | -114,132 | -95,718 | 59,759 | 7,324 | -3,653 |
| Greenland Sea | 603,416 | 257,228 | -346,188 | 13,929 | 60,723 | 43,314 | 15,346 | -3,582 |
| Beaufort Sea | 1,070,445 | 661,660 | -408,785 | -61,549 | -71,575 | -16,805 | 8,374 | -2,906 |
| Hudson Bay | 1,260,903 | 1,448 | -1,259,455 | -49,997 | -11,337 | -2,686 | 586 | 0 |
| Bering Sea | 697,324 | 0 | -697,324 | 0 | 0 | 0 | 0 | 0 |
| Baltic Sea | 15,337 | 0 | -15,337 | 0 | 0 | 0 | 0 | 0 |
| Sea of Okhotsk | 853,240 | 0 | -853,240 | 0 | 0 | 0 | 0 | 0 |
| Yellow Sea | 0 | 0 | 0 | 0 | 0 | 0 | 0 | 0 |
| Laptev Sea | 897,845 | 1,348 | -896,496 | -23,778 | -446 | 461 | 263 | 263 |
| Baffin Bay Gulf of St. Lawrence | 1,688,530 | 29,244 | -1,659,286 | 14,800 | 14,808 | 10,960 | 11,595 | 1,568 |
| East Siberian Sea | 1,087,137 | 473,550 | -613,588 | -62,165 | -61,660 | 11,558 | 14,767 | 4,612 |
| Chukchi Sea | 966,006 | 248,893 | -717,114 | -120,926 | -33,303 | 7,775 | 33,138 | 4,866 |
| Barents Sea | 645,917 | 121,894 | -524,024 | -29,671 | -16,269 | -9,884 | -11,143 | 5,549 |
| Kara Sea | 933,859 | 65,747 | -868,113 | -84,949 | -23,099 | 4,013 | 1,817 | 9,465 |
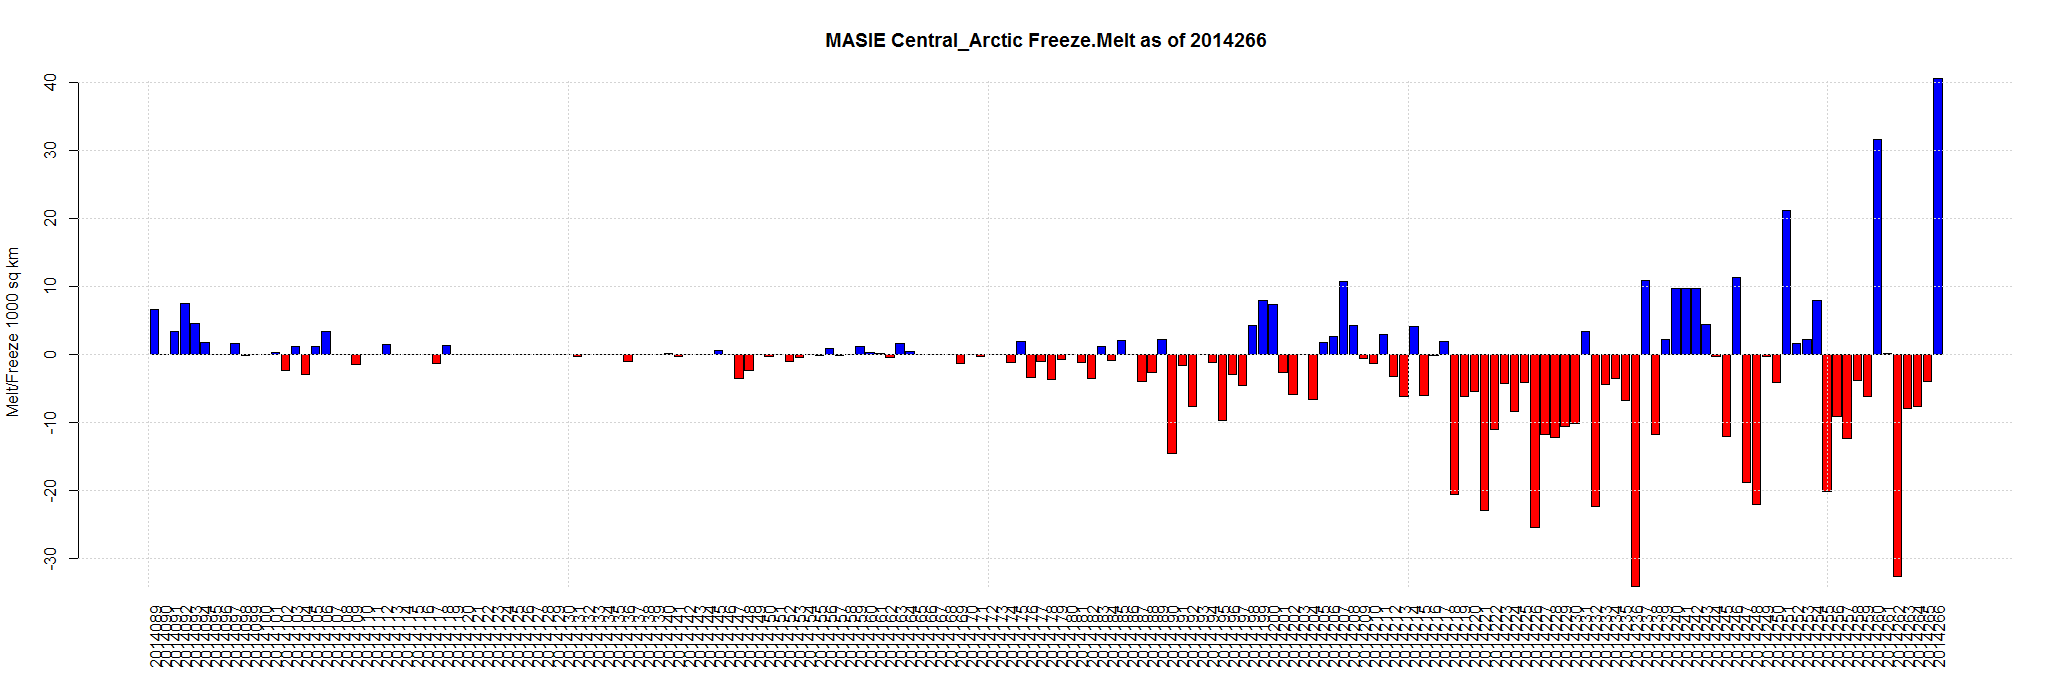
| Central Arctic | 3,221,921 | 2,986,587 | -235,335 | 4,853 | -7,065 | 4,792 | 52,757 | 16,274 |
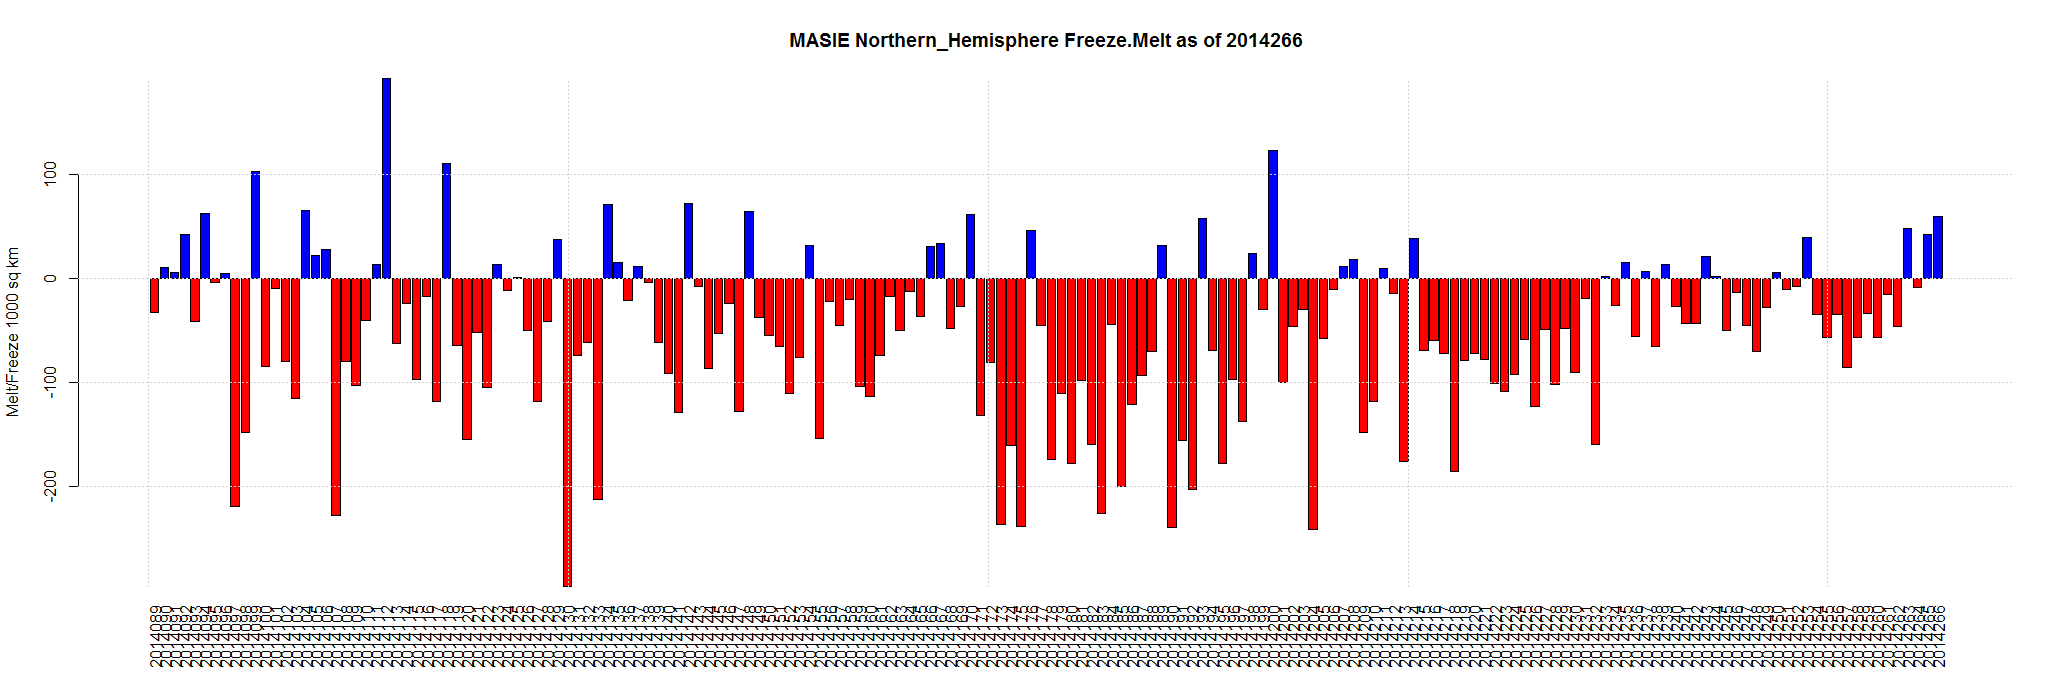
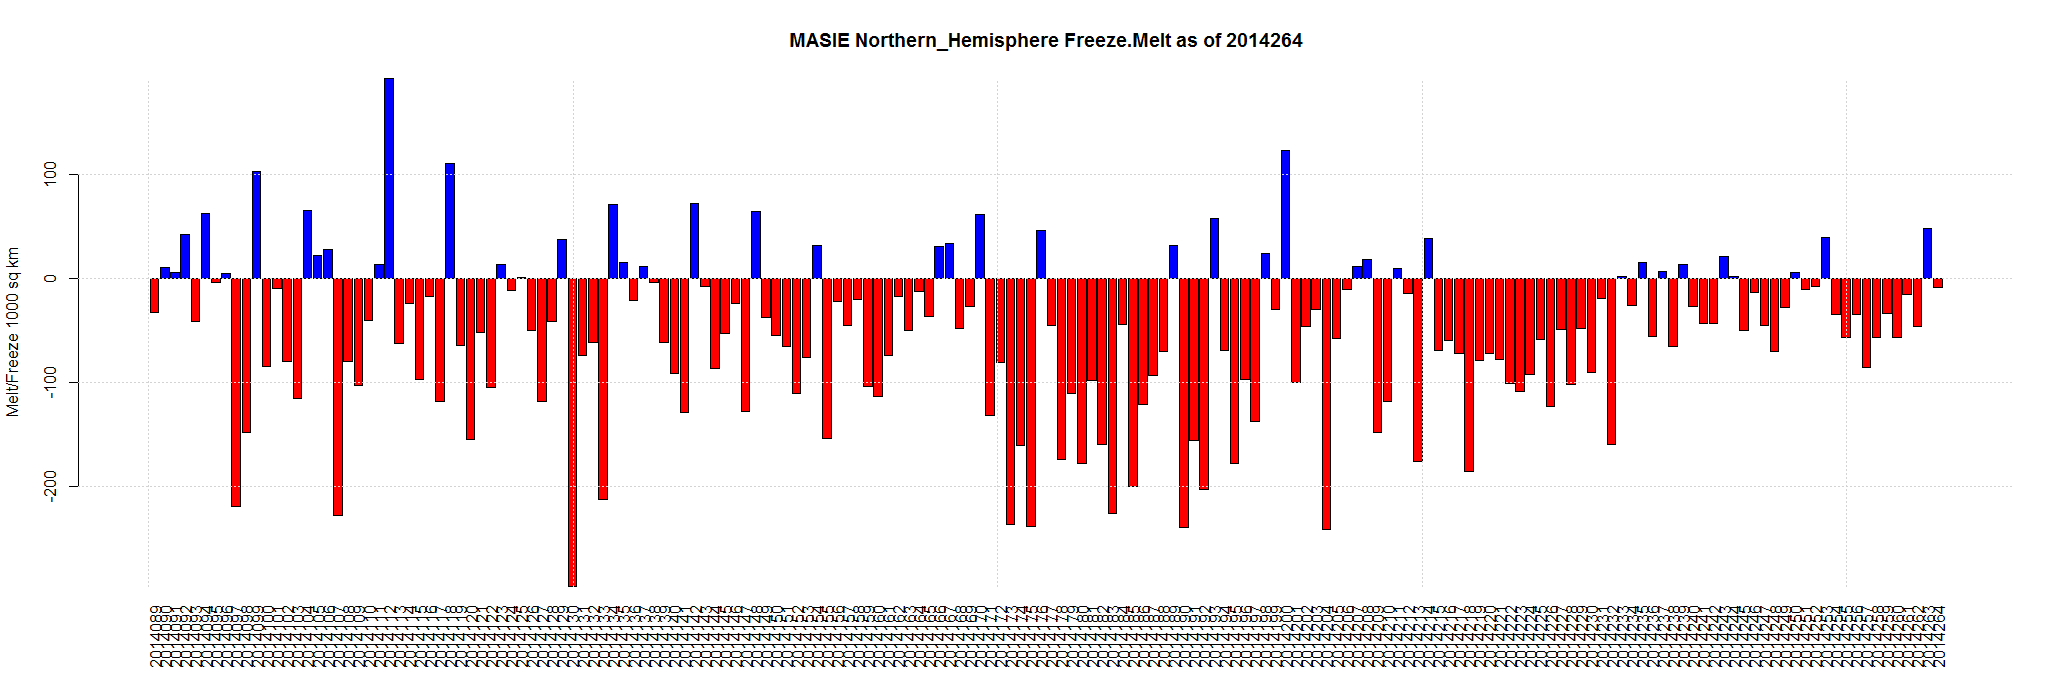
| Northern Hemisphere (Total) | 14,805,115 | 5,240,159 | -9,564,955 | -513,586 | -244,668 | 113,257 | 134,823 | 32,458 |
| NH (Average Loss per Day) | -53,139 | -18,342 | -17,476 | 16,180 | 44,941 | 32,458 |
Arctic Sea Ice Extent Sep 25 2014 – -1,190,000 sq km below the 1981-2010 mean. Data for Day 267. Data here.
52,000 sq km more.


Sept 24 2014 MASIE Update – Big Central Arctic Jump – And 59,000 Increase for NH
Data here. Click for bigger.
| Region | 179 days ago | End | Last 178 | Last 28 | Last 14 | Last 7 | Last 3 | Last 1 |
| Barents Sea | 645,917 | 116,345 | -529,572 | -27,312 | -13,720 | -10,009 | -20,938 | -16,579 |
| Kara Sea | 933,859 | 56,281 | -877,578 | -102,195 | -42,011 | -19,502 | -7,249 | -8,117 |
| Canadian Archipelago | 853,214 | 395,072 | -458,142 | -109,081 | -100,019 | 21,831 | 27,369 | -986 |
| Laptev Sea | 897,845 | 1,086 | -896,759 | -14,076 | -1,326 | 163 | -127 | 0 |
| Bering Sea | 697,324 | 0 | -697,324 | 0 | 0 | 0 | 0 | 0 |
| Baltic Sea | 15,337 | 0 | -15,337 | 0 | 0 | 0 | 0 | 0 |
| Sea of Okhotsk | 853,240 | 0 | -853,240 | 0 | 0 | 0 | 0 | 0 |
| Yellow Sea | 0 | 0 | 0 | 0 | 0 | 0 | 0 | 0 |
| Beaufort Sea | 1,070,445 | 664,565 | -405,880 | -52,797 | -62,181 | -30,762 | 7,663 | 579 |
| Hudson Bay | 1,260,903 | 1,448 | -1,259,455 | -43,828 | -10,054 | -5,916 | 586 | 586 |
| Baffin Bay Gulf of St. Lawrence | 1,688,530 | 27,676 | -1,660,855 | 10,762 | 13,240 | 13,051 | 9,431 | 6,368 |
| Greenland Sea | 603,416 | 260,810 | -342,606 | 17,374 | 98,791 | 40,362 | 19,526 | 7,097 |
| Chukchi Sea | 966,006 | 244,027 | -721,980 | -129,680 | -35,594 | -8,603 | 19,551 | 13,748 |
| East Siberian Sea | 1,087,137 | 468,937 | -618,200 | -72,229 | -63,501 | 3,776 | 8,765 | 16,540 |
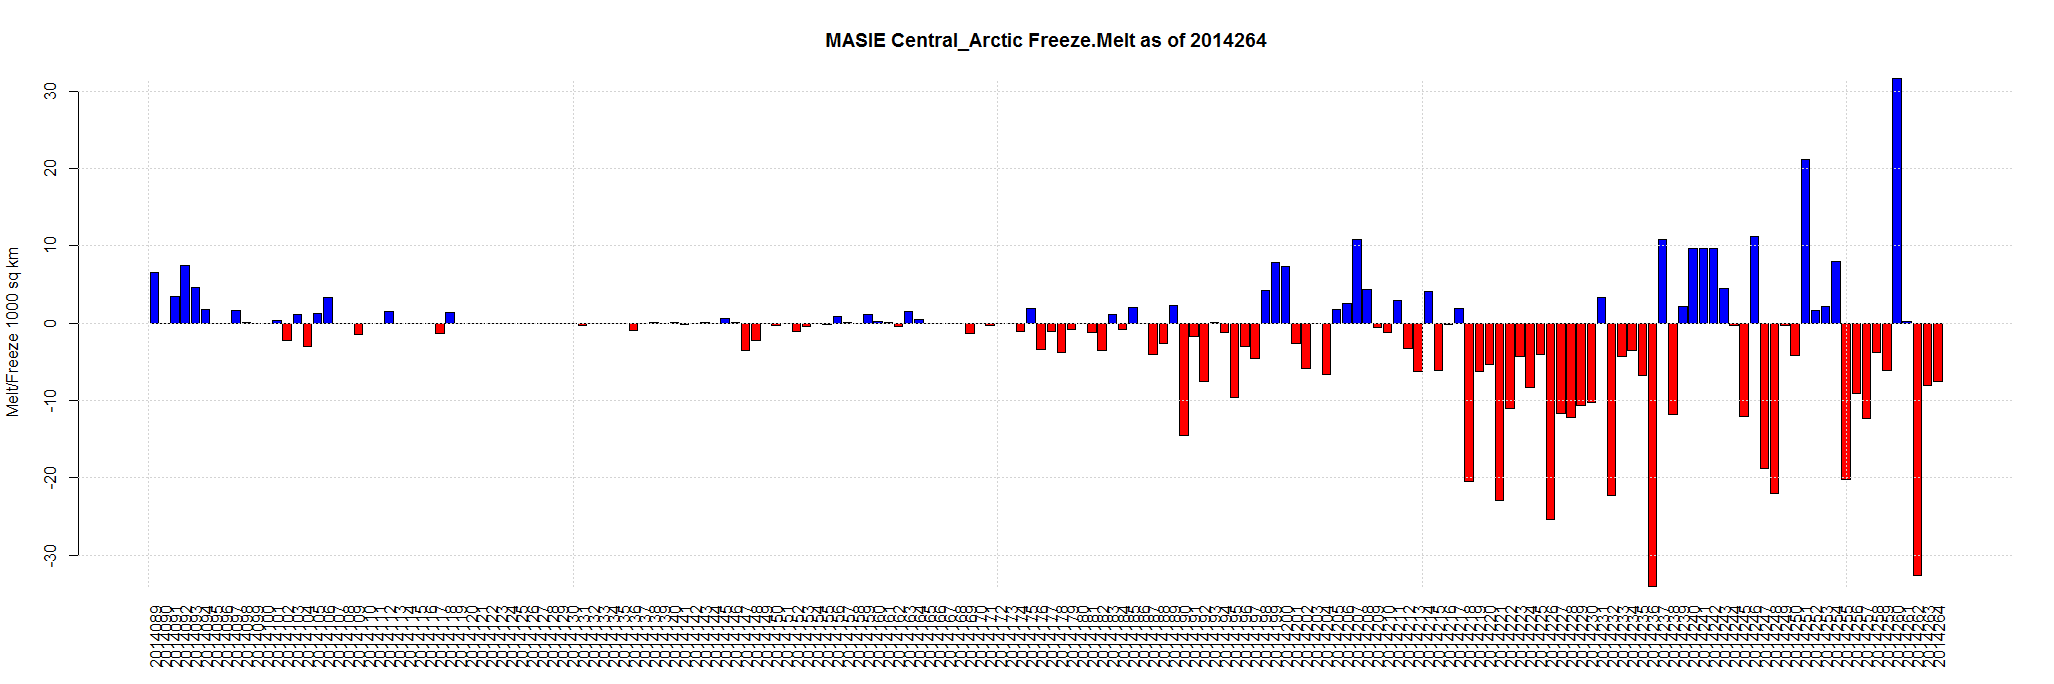
| Central Arctic | 3,221,921 | 2,970,312 | -251,609 | -9,276 | -21,203 | 20,144 | 28,926 | 40,503 |
| Northern Hemisphere (Total) | 14,805,115 | 5,207,701 | -9,597,413 | -532,339 | -237,308 | 24,535 | 93,503 | 59,738 |
| NH (Average Loss per Day) | -53,617 | -19,012 | -16,951 | 3,505 | 31,168 | 59,738 |
Arctic Sea Ice Extent Sep 24 2014 – -1,167,000 sq km below the 1981-2010 mean. Data for Day 266. Data here.


Arctic Sea Ice Extent Sep 23 2014 – -1,222,000 sq km below the 1981-2010 mean. Data for Day 265. Data here.


Sept 22 2014 MASIE Update – Still Melting
Data here. Click for bigger.
| Region | 177 days ago | End | Last 176 | Last 28 | Last 14 | Last 7 | Last 3 | Last 1 |
| Chukchi Sea | 966,006 | 215,755 | -750,251 | -189,098 | -65,776 | -45,164 | -24,438 | -8,721 |
| Central Arctic | 3,221,921 | 2,933,830 | -288,092 | -46,701 | -34,971 | -26,185 | -48,163 | -7,557 |
| Barents Sea | 645,917 | 133,036 | -512,881 | 1,457 | 8,337 | -6,531 | 5,064 | -4,247 |
| Beaufort Sea | 1,070,445 | 653,286 | -417,159 | -57,986 | -80,905 | -69,105 | -7,724 | -3,617 |
| East Siberian Sea | 1,087,137 | 458,783 | -628,355 | -101,278 | -68,758 | -25,010 | -3,003 | -1,390 |
| Baffin Bay Gulf of St. Lawrence | 1,688,530 | 17,649 | -1,670,881 | 7,407 | -361 | 6,496 | -612 | -596 |
| Laptev Sea | 897,845 | 1,086 | -896,759 | -20,338 | -4,999 | -946 | 91 | -127 |
| Hudson Bay | 1,260,903 | 862 | -1,260,041 | -48,876 | -19,487 | -6,174 | -860 | 0 |
| Bering Sea | 697,324 | 0 | -697,324 | 0 | 0 | 0 | 0 | 0 |
| Baltic Sea | 15,337 | 0 | -15,337 | 0 | 0 | 0 | 0 | 0 |
| Sea of Okhotsk | 853,240 | 0 | -853,240 | 0 | 0 | 0 | 0 | 0 |
| Yellow Sea | 0 | 0 | 0 | 0 | 0 | 0 | 0 | 0 |
| Kara Sea | 933,859 | 63,930 | -869,929 | -102,526 | -32,286 | -17,161 | 776 | 400 |
| Greenland Sea | 603,416 | 241,882 | -361,534 | -4,396 | 60,832 | 47,708 | 26,132 | 599 |
| Canadian Archipelago | 853,214 | 384,096 | -469,119 | -131,399 | -119,679 | -26,059 | 46,020 | 16,393 |
| Northern Hemisphere (Total) | 14,805,115 | 5,105,336 | -9,699,779 | -693,734 | -358,052 | -168,132 | -6,718 | -8,862 |
| NH (Average Loss per Day) | -54,801 | -24,776 | -25,575 | -24,019 | -2,239 | -8,862 |
