Arctic Sea Ice Extent is now melting at a relatively “normal” rate.
Arctic Sea Ice Extent is now melting at a relatively “normal” rate.
Update: Arctic/Antarctic have appeared. MASIE is still one day old.
Normally the NSIDC Sea Ice Data is posted on their site at 6:51am Pacific Time.
Some days it is late or isn’t updated until the next day.
The MASIE data gets updated about 7:17am Pacific. It was updated … but it the previous days data.
2014 Day 208 … Global Sea Ice is still normal. For this day, the lowest Global Sea Ice was in 2011 and 2014 is now 1,500,000 sq km higher than 2011.


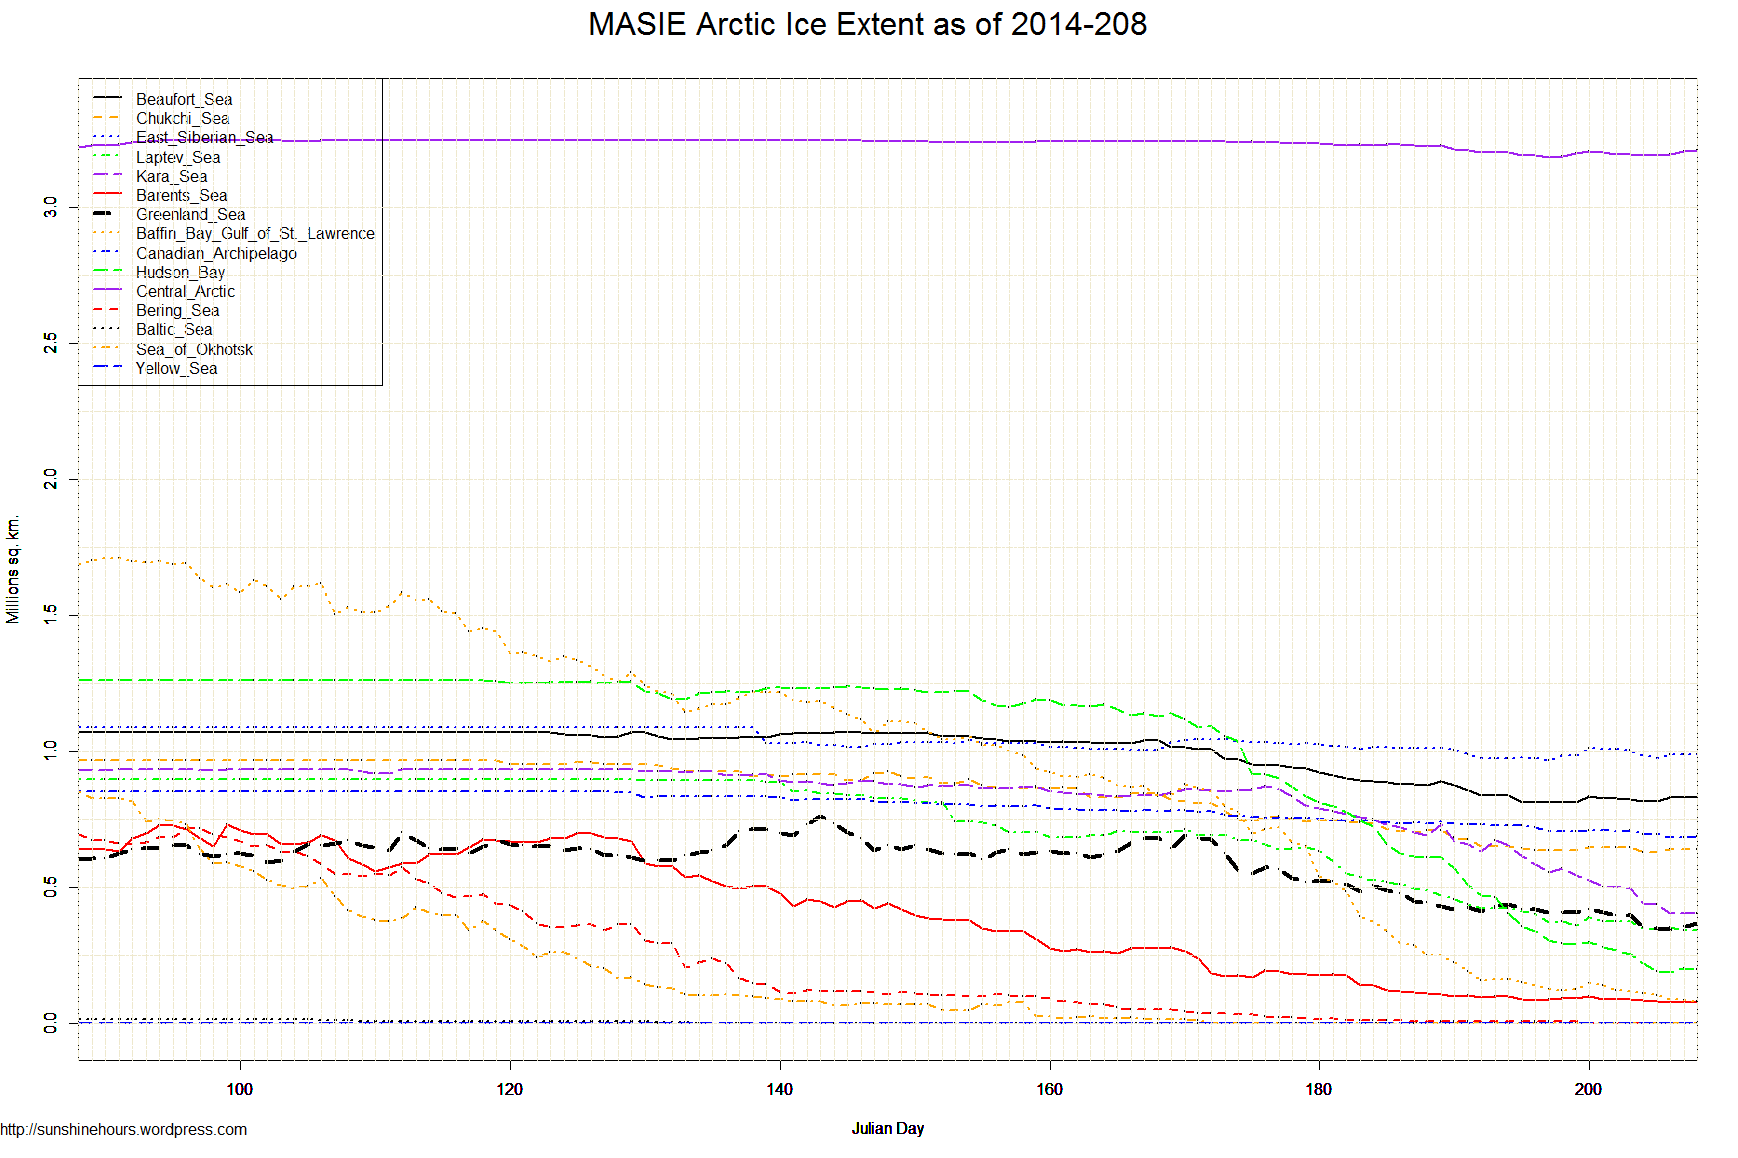
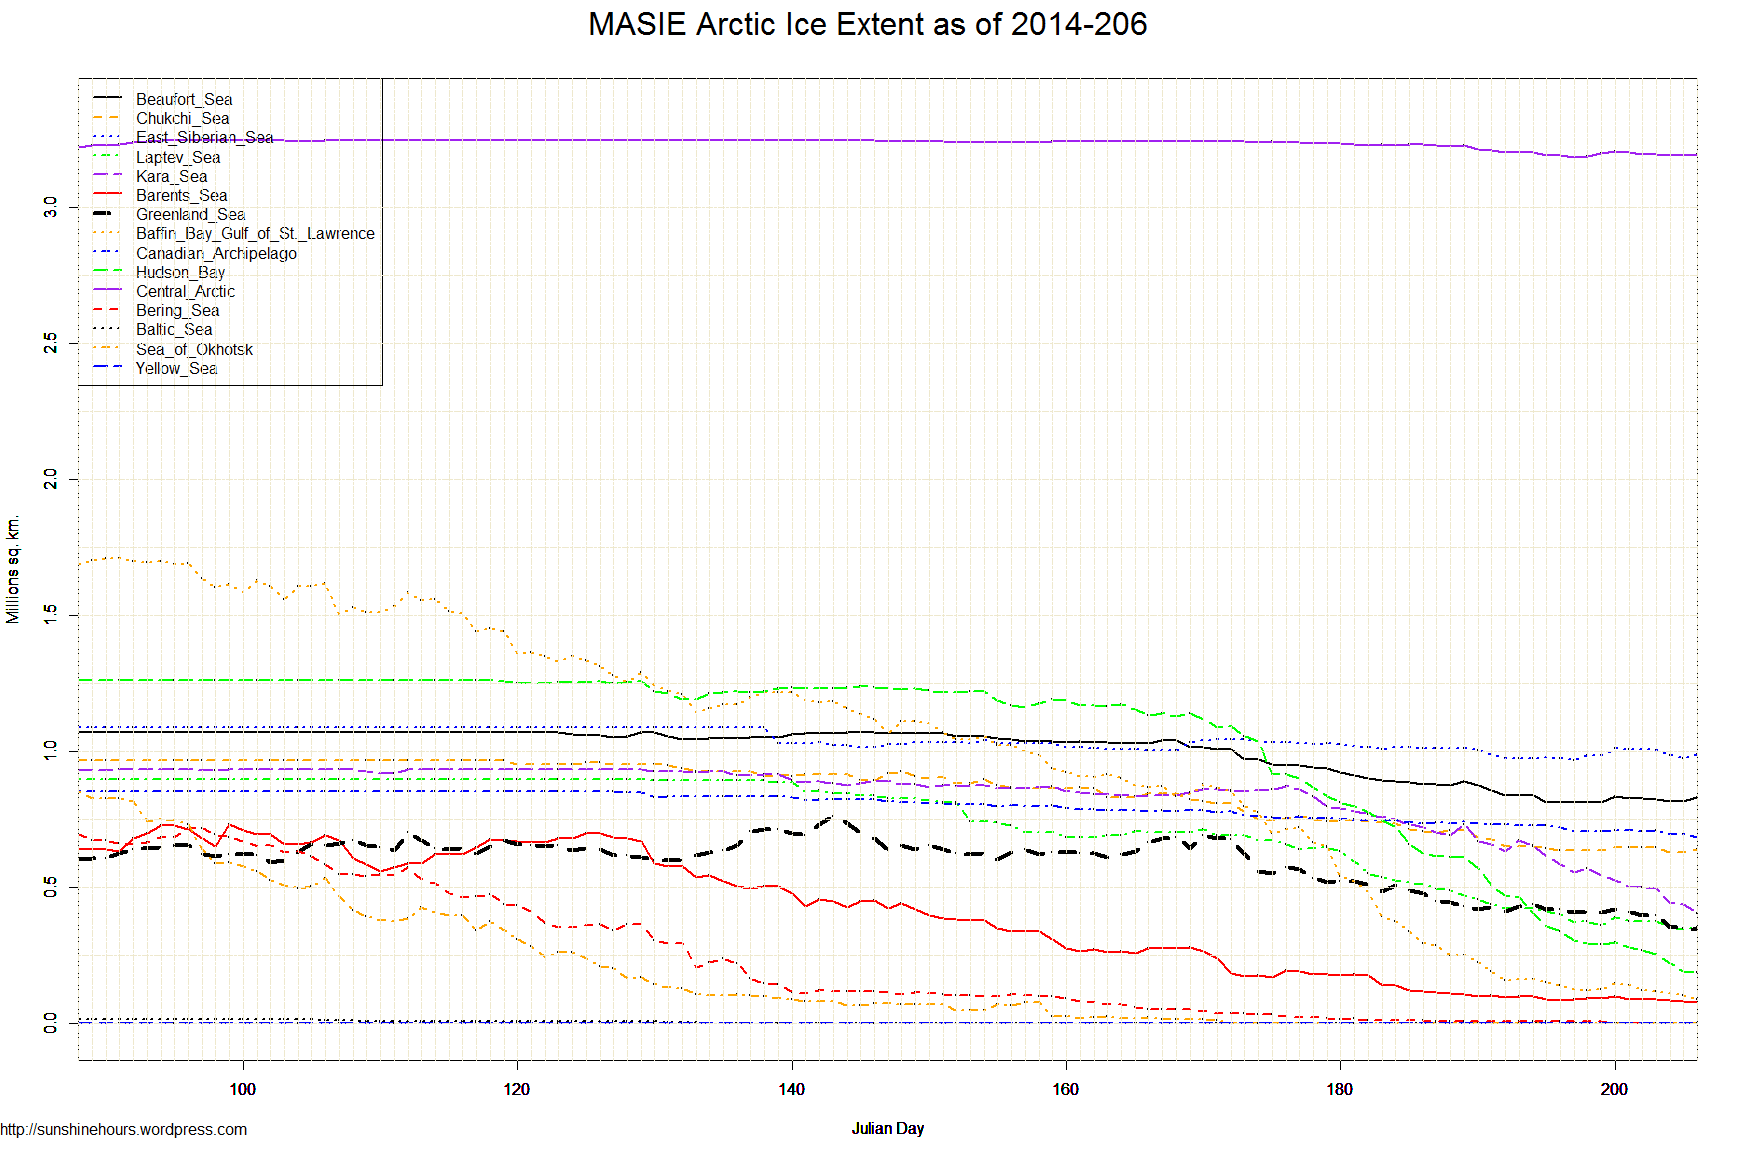
July 28 2014 MASIE Update
The top graph just shows the Central Arctic … and shows 4 days in a row of freezing. The Central Arctic has 3.2 million sq km out of 7.8 million sq km left for the whole Northern Hemisphere.
The 2nd graph shows 2 days of freezing for the whole Northern Hemisphere … about 30,000 sq km net total freezing. (When I use the term freezing I mean more ice. It could be wind moving the ice around too)
The graphs have different scales.
Data here. Click for bigger.


| Region | 121 days ago | End | Last 120 | Last 28 | Last 14 | Last 7 | Last 3 | Last 1 |
| Baffin Bay Gulf of St. Lawrence | 1,688,530 | 82,623 | -1,605,908 | -457,782 | -80,285 | -58,263 | -20,616 | -2,124 |
| Hudson Bay | 1,260,903 | 200,454 | -1,060,449 | -614,568 | -206,510 | -78,954 | 9,293 | -1,182 |
| Chukchi Sea | 966,006 | 641,806 | -324,200 | -103,665 | -9,047 | -5,570 | 13,239 | 0 |
| East Siberian Sea | 1,087,137 | 990,921 | -96,217 | -36,503 | 17,263 | -17,514 | 14,910 | 0 |
| Laptev Sea | 897,845 | 341,083 | -556,761 | -290,827 | -82,700 | -36,438 | -5,488 | 0 |
| Kara Sea | 933,859 | 404,649 | -529,211 | -387,393 | -250,763 | -97,913 | -33,492 | 0 |
| Barents Sea | 645,917 | 79,847 | -566,070 | -98,773 | -18,726 | -10,705 | -2,398 | 0 |
| Bering Sea | 697,324 | 15 | -697,308 | -15,501 | -8,643 | -1,323 | 0 | 0 |
| Baltic Sea | 15,337 | 0 | -15,337 | 0 | 0 | 0 | 0 | 0 |
| Sea of Okhotsk | 853,240 | 0 | -853,240 | 0 | 0 | 0 | 0 | 0 |
| Yellow Sea | 0 | 0 | 0 | 0 | 0 | 0 | 0 | 0 |
| Beaufort Sea | 1,070,445 | 832,532 | -237,913 | -92,230 | -8,058 | 6,114 | 14,784 | 782 |
| Canadian Archipelago | 853,214 | 687,588 | -165,626 | -63,792 | -41,190 | -21,383 | -6,888 | 3,914 |
| Central Arctic | 3,221,921 | 3,209,107 | -12,815 | -24,789 | 6,856 | 7,042 | 17,737 | 4,332 |
| Greenland Sea | 603,416 | 369,278 | -234,138 | -154,382 | -68,624 | -40,760 | 18,619 | 12,491 |
| Northern Hemisphere (Total) | 14,805,115 | 7,841,045 | -6,964,070 | -2,340,592 | -750,426 | -355,666 | 19,701 | 18,212 |
| NH (Average Loss per Day) | -57,554 | -83,593 | -53,602 | -50,809 | 6,567 | 18,212 |
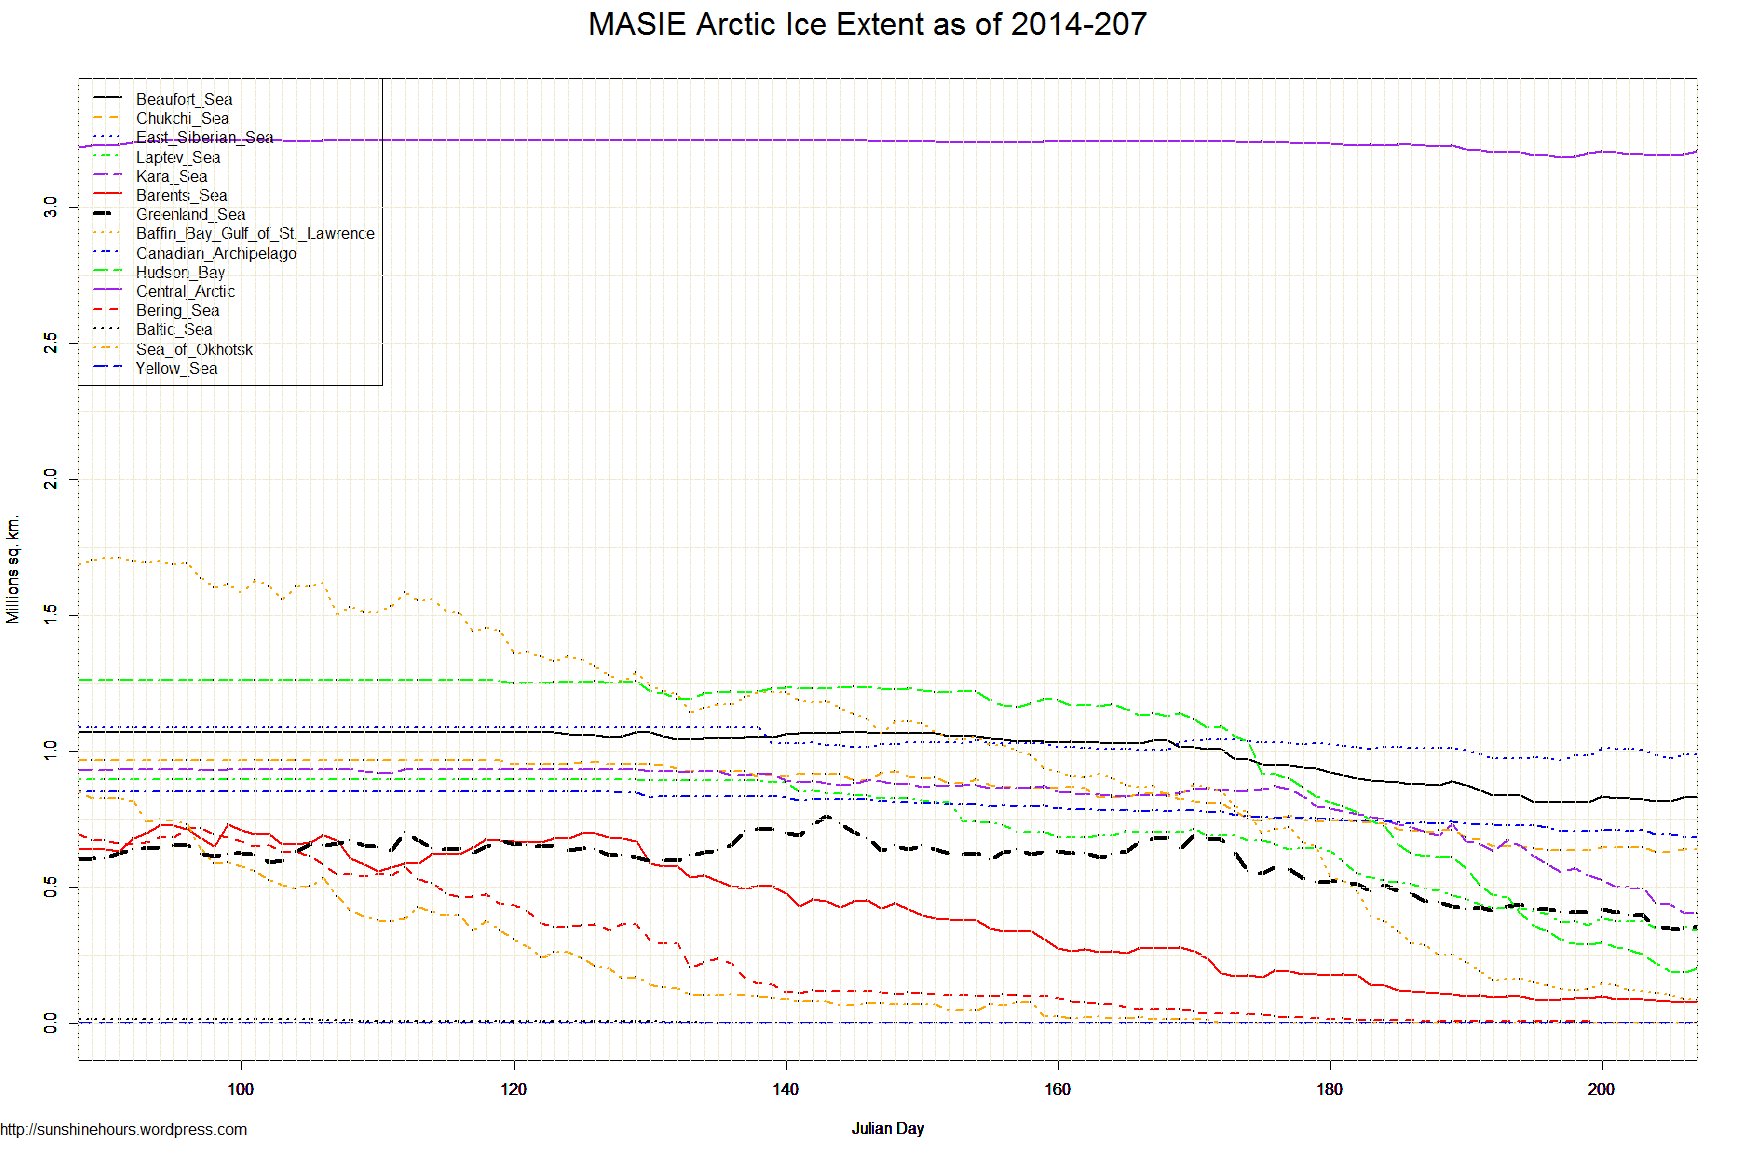
July 27 2014 MASIE Update – A Day of Freeze and Melt Ending Up 11,694 sq km Higher
Data here. The tiny blue bar at the far right is the net freeze for day 207.

| Region | 120 days ago | End | Last 119 | Last 28 | Last 14 | Last 7 | Last 3 | Last 1 |
| Laptev Sea | 897,845 | 341,083 | -556,761 | -306,590 | -80,671 | -49,872 | -7,452 | -12,035 |
| Baffin Bay Gulf of St. Lawrence | 1,688,530 | 84,746 | -1,603,784 | -566,356 | -78,169 | -61,810 | -26,933 | -4,648 |
| Canadian Archipelago | 853,214 | 683,675 | -169,540 | -72,204 | -45,104 | -26,511 | -11,039 | -1,766 |
| Kara Sea | 933,859 | 404,649 | -529,211 | -393,782 | -267,128 | -123,292 | -35,537 | -1,116 |
| Beaufort Sea | 1,070,445 | 831,750 | -238,695 | -108,217 | -8,839 | -4,891 | 15,282 | 0 |
| Chukchi Sea | 966,006 | 641,806 | -324,200 | -103,305 | -9,047 | -6,753 | 13,784 | 0 |
| East Siberian Sea | 1,087,137 | 990,921 | -96,217 | -37,414 | 17,263 | -22,088 | 4,073 | 0 |
| Barents Sea | 645,917 | 79,847 | -566,070 | -102,085 | -18,726 | -19,241 | -6,450 | 0 |
| Bering Sea | 697,324 | 15 | -697,308 | -19,927 | -8,643 | -772 | 0 | 0 |
| Baltic Sea | 15,337 | 0 | -15,337 | 0 | 0 | 0 | 0 | 0 |
| Sea of Okhotsk | 853,240 | 0 | -853,240 | 0 | 0 | 0 | 0 | 0 |
| Yellow Sea | 0 | 0 | 0 | 0 | 0 | 0 | 0 | 0 |
| Greenland Sea | 603,416 | 356,787 | -246,629 | -162,666 | -75,930 | -62,983 | 1,397 | 8,887 |
| Central Arctic | 3,221,921 | 3,204,775 | -17,146 | -29,121 | 1,360 | 122 | 15,135 | 10,794 |
| Hudson Bay | 1,260,903 | 201,636 | -1,059,268 | -634,988 | -264,187 | -95,448 | -18,124 | 11,578 |
| Northern Hemisphere (Total) | 14,805,115 | 7,822,833 | -6,982,282 | -2,537,040 | -837,820 | -473,539 | -55,865 | 11,694 |
| NH (Average Loss per Day) | -58,186 | -90,609 | -59,844 | -67,648 | -18,622 | 11,694 |
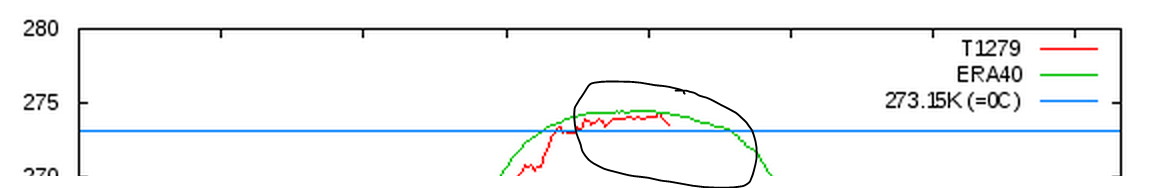
DMI says summer is almost over. And by summer I mean the short period when average temperature is above 0C.
Red is the temperature for 2014. Green is the mean for all previous years. Blue is the 0C line.
It could be the shortest arctic summer ever.
July 26 2014 MASIE Update – Melting and Freezing … resulting in a very small net melt of -10,205 sq km over the last day.
However the net melt over the last 3 days was pretty high. But almost the same as the last 7 days.
Data here.
| Region | 119 days ago | End | Last 118 | Last 28 | Last 14 | Last 7 | Last 3 | Last 1 |
| Kara Sea | 933,859 | 405,765 | -528,094 | -429,387 | -228,219 | -140,223 | -91,746 | -32,376 |
| Baffin Bay Gulf of St. Lawrence | 1,688,530 | 89,395 | -1,599,136 | -578,372 | -69,533 | -37,632 | -28,139 | -13,844 |
| Canadian Archipelago | 853,214 | 685,441 | -167,774 | -70,628 | -45,269 | -20,201 | -24,665 | -9,035 |
| Greenland Sea | 603,416 | 347,900 | -255,516 | -186,943 | -65,476 | -61,545 | -48,490 | -2,759 |
| Barents Sea | 645,917 | 79,847 | -566,070 | -102,676 | -16,457 | -14,165 | -10,705 | -2,398 |
| Hudson Bay | 1,260,903 | 190,058 | -1,070,845 | -679,341 | -279,459 | -99,954 | -63,224 | -1,103 |
| Bering Sea | 697,324 | 15 | -697,308 | -24,071 | -8,643 | -7,329 | -1,323 | 0 |
| Baltic Sea | 15,337 | 0 | -15,337 | 0 | 0 | 0 | 0 | 0 |
| Sea of Okhotsk | 853,240 | 0 | -853,240 | 0 | 0 | 0 | 0 | 0 |
| Yellow Sea | 0 | 0 | 0 | 0 | 0 | 0 | 0 | 0 |
| Central Arctic | 3,221,921 | 3,193,981 | -27,941 | -40,662 | -9,398 | -3,303 | -2,248 | 2,611 |
| Laptev Sea | 897,845 | 353,118 | -544,727 | -290,647 | -68,636 | -6,843 | -24,403 | 6,547 |
| Chukchi Sea | 966,006 | 641,806 | -324,200 | -109,851 | -9,047 | 3,585 | -5,570 | 13,239 |
| Beaufort Sea | 1,070,445 | 831,750 | -238,695 | -111,070 | -8,839 | 19,239 | 6,139 | 14,003 |
| East Siberian Sea | 1,087,137 | 990,921 | -96,217 | -35,106 | 17,263 | 6,655 | -15,058 | 14,910 |
| Northern Hemisphere (Total) | 14,805,115 | 7,811,139 | -6,993,976 | -2,659,139 | -791,713 | -361,718 | -309,432 | -10,205 |
| NH (Average Loss per Day) | -58,773 | -94,969 | -56,551 | -51,674 | -103,144 | -10,205 |
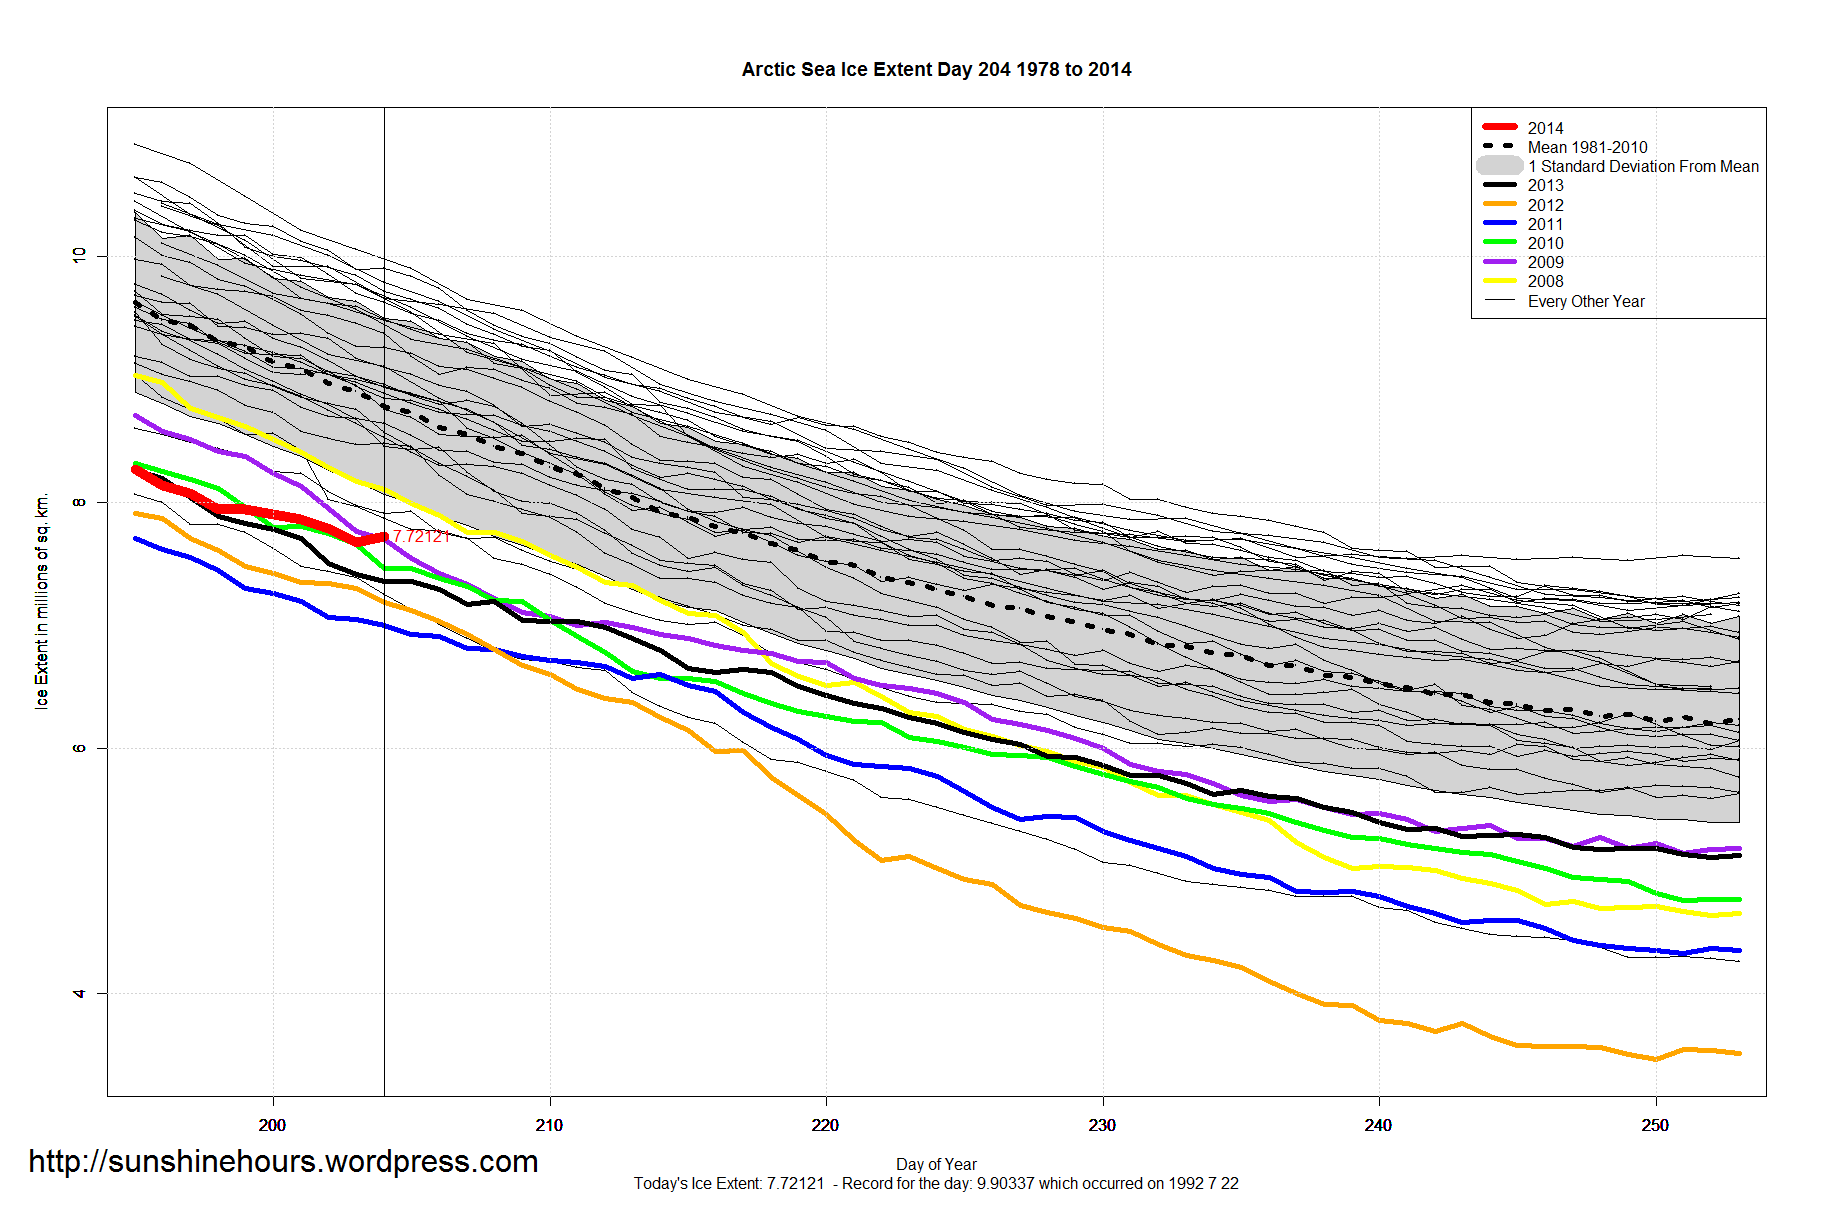
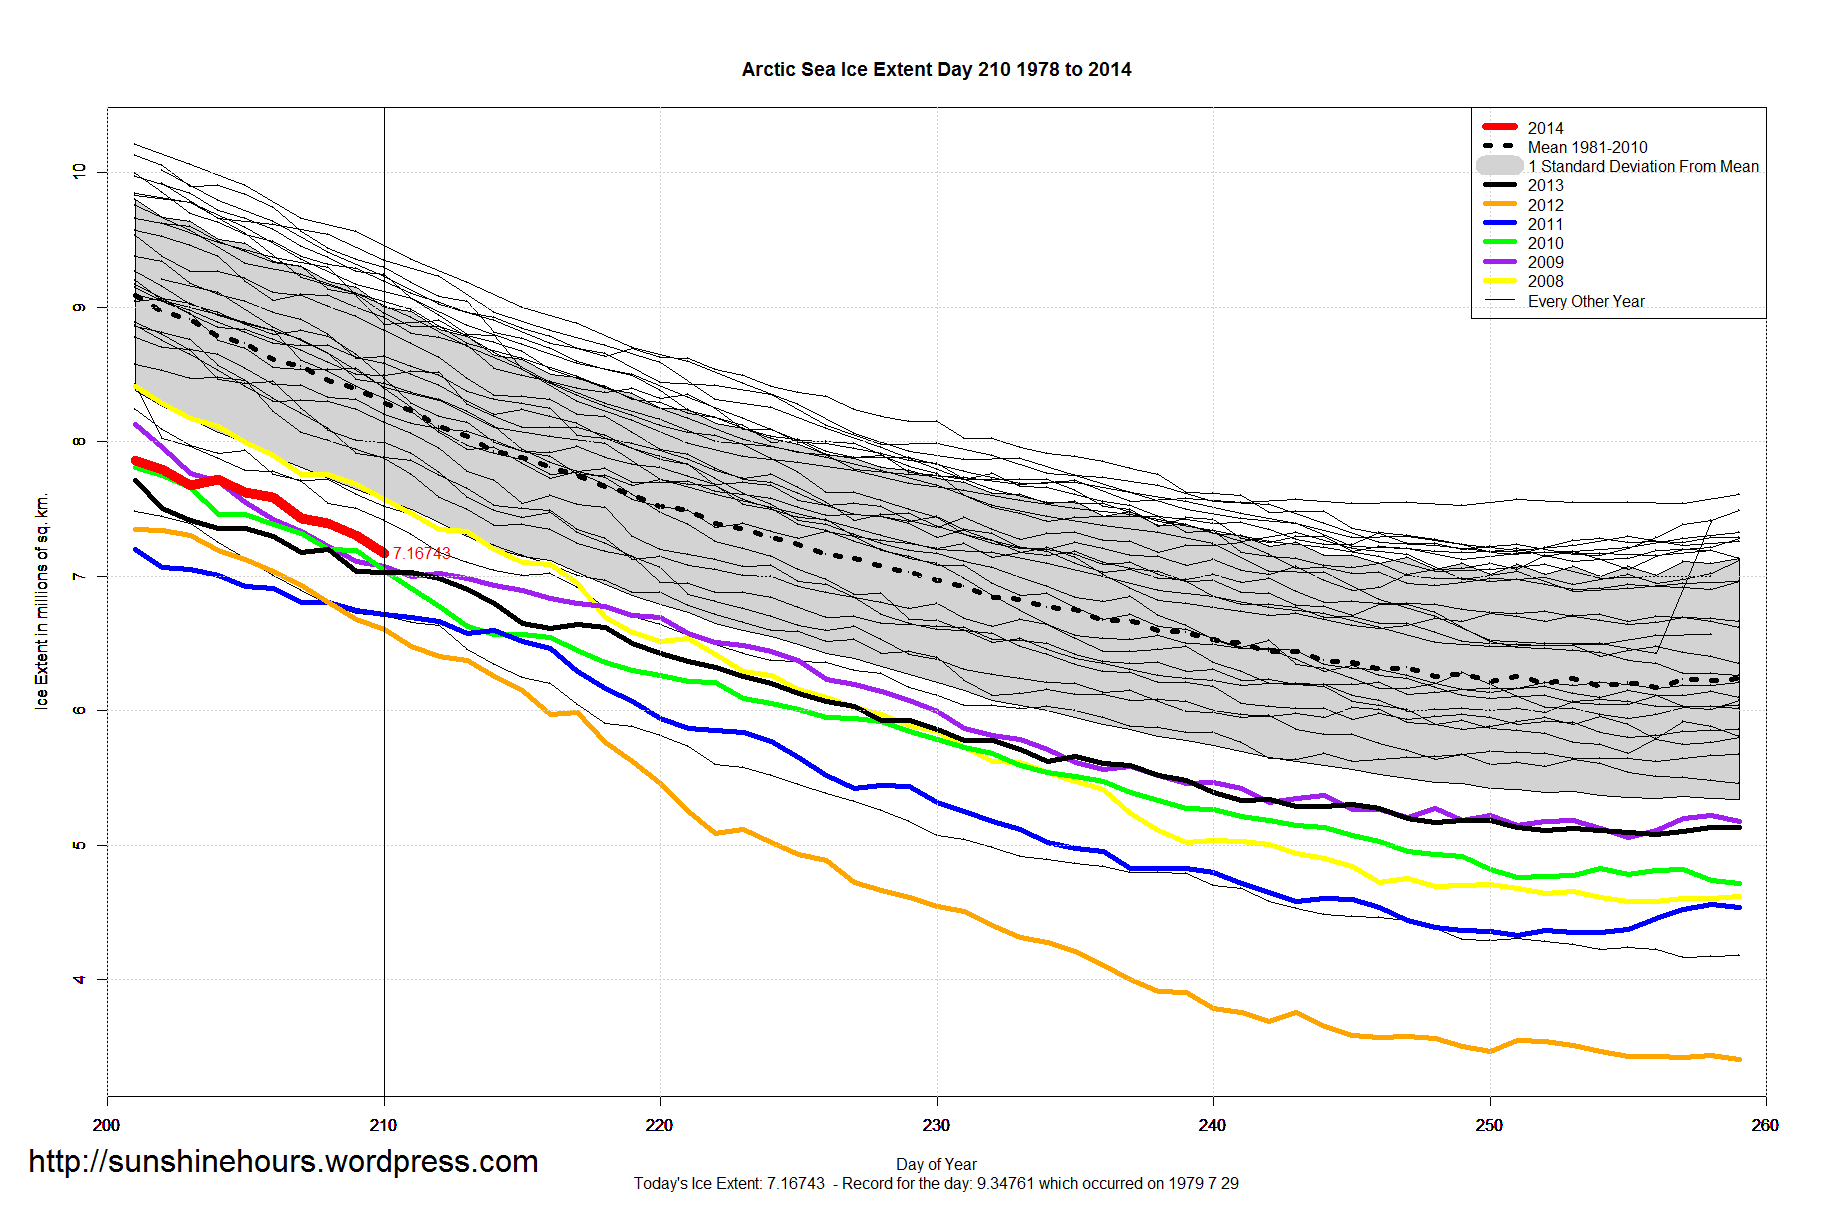
A new graph

Arctic Sea Ice Extent seems to be aiming to break the one standard deviation mark … maybe in 6 or 7 days.
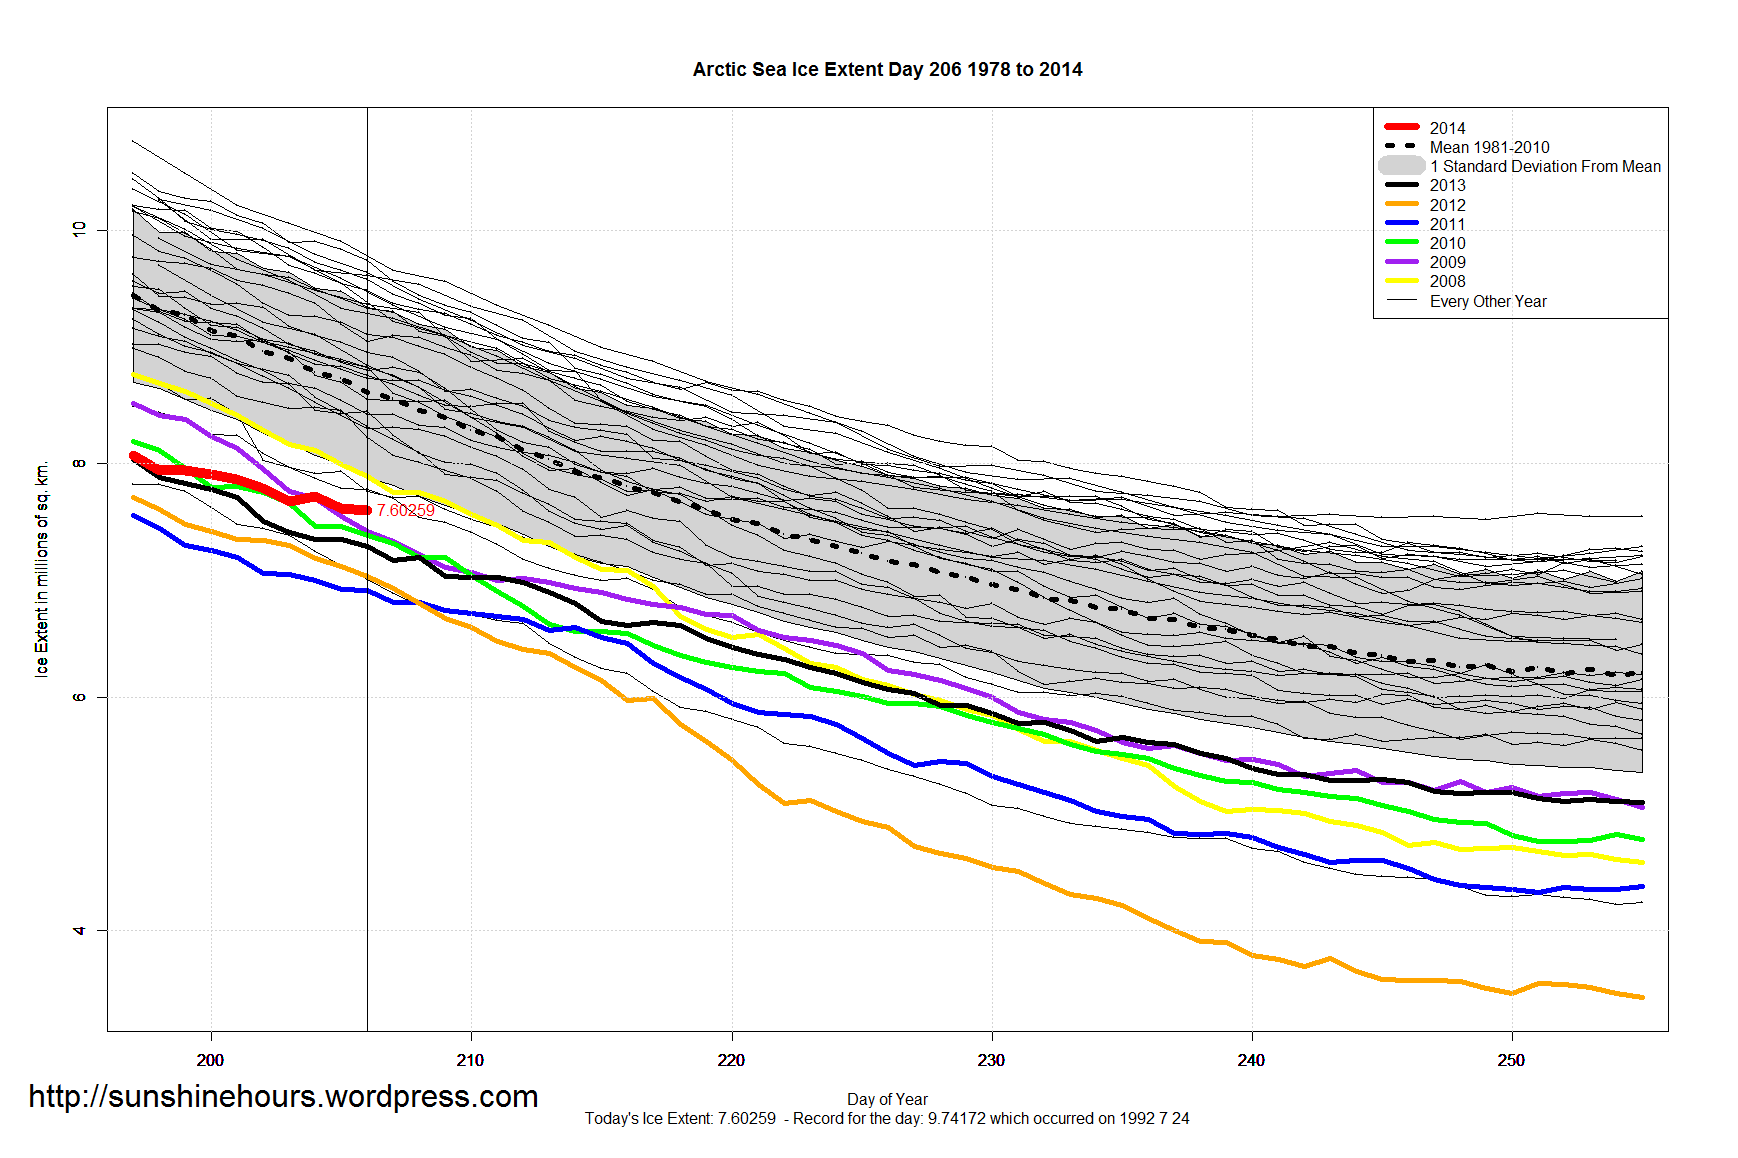
In 2011 Arctic Sea Ice Extent on day 205 was 6.9 million sq km. In 2014, on the same day, it is 7.7 million sq km. That is 800,000 sq km higher.

Arctic Sea Ice Extent rose 50,000 sq km. Not unprecedented. But not normal this time of year.