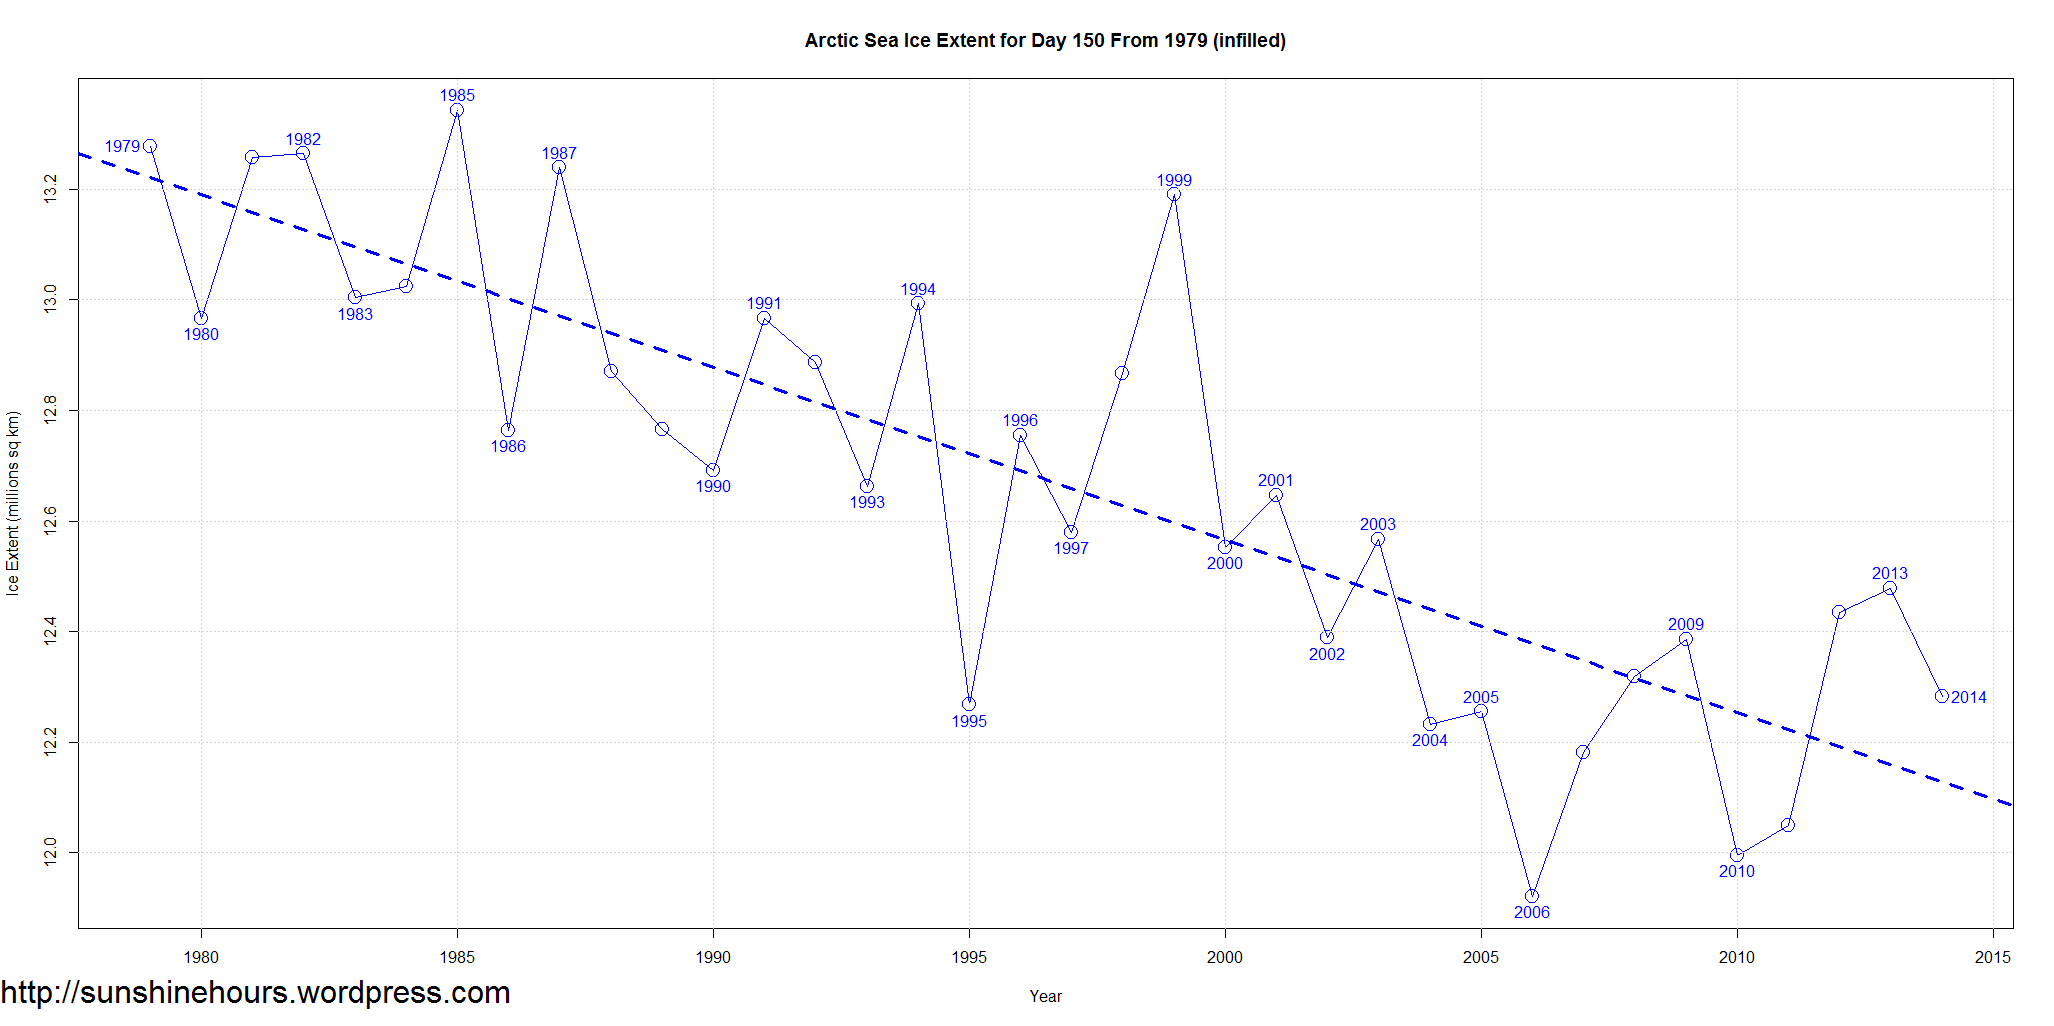
Yes there was an Arctic Sea Ice Extent Tipping Point.
It was 2006.
Arctic Sea Ice Extent For this Day from 1979
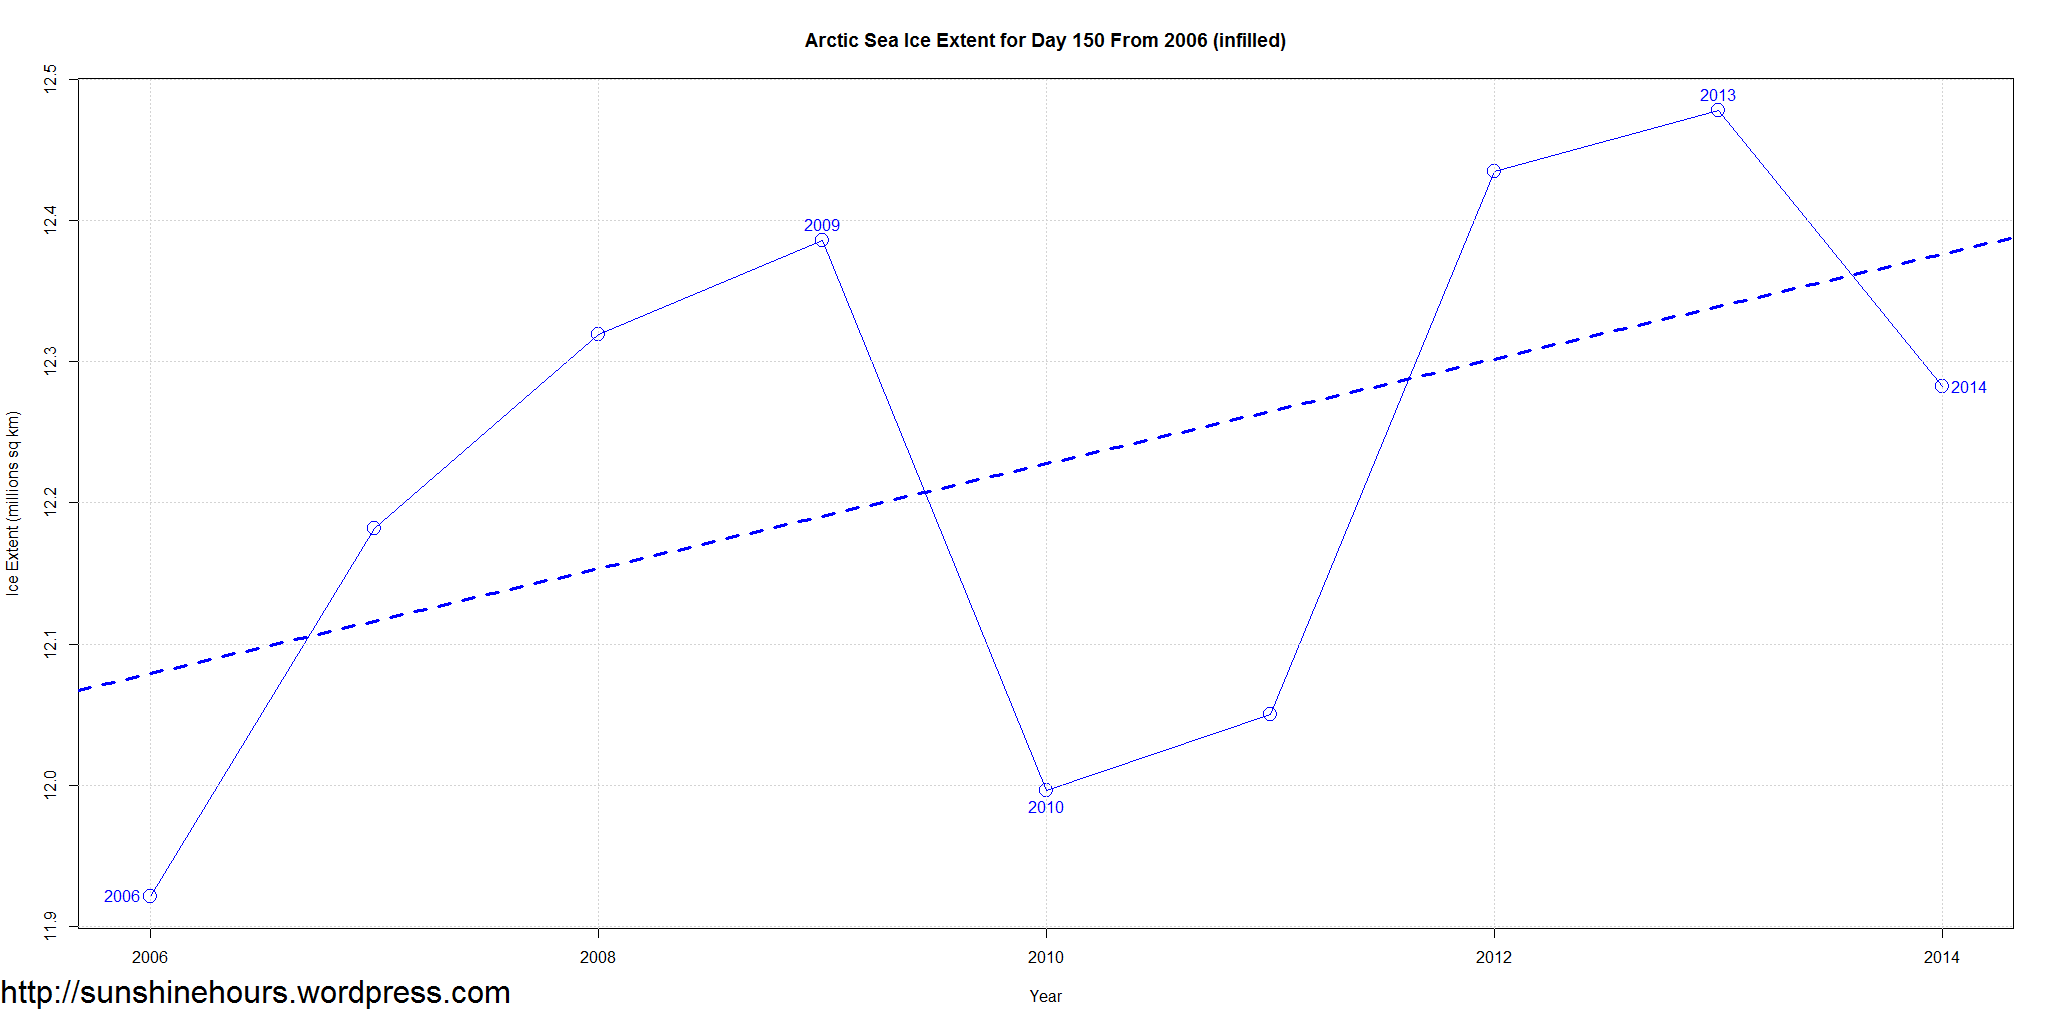
Arctic Sea Ice Extent For this Day from 2006
Yes there was an Arctic Sea Ice Extent Tipping Point.
It was 2006.
Arctic Sea Ice Extent For this Day from 1979
Arctic Sea Ice Extent For this Day from 2006
May 31 2014 MASIE Update
This is the gain/loss up to day 150. Negative = loss. Sorted with biggest loser in last 7 days at top. Northern Hemisphere is the grand total.
While melting resumed in many regions over the last one day, over the last 3 days daily melt was only -9,229 sq km per day.
The Greenland Sea continues to climb.
| Region | Start | End | Last 62 | Last 28 | Last 14 | Last 7 | Last 3 | Last 1 |
| Greenland Sea | 603,416 | 655,024 | 51,609 | 4,140 | -90 | -106,985 | 18,233 | 13,181 |
| Baffin Bay Gulf of St. Lawrence | 1,688,530 | 1,103,619 | -584,912 | -245,220 | -69,982 | -80,040 | 36,442 | -7,578 |
| Barents Sea | 645,917 | 397,108 | -248,810 | -267,741 | -108,359 | -50,858 | -27,296 | -23,217 |
| Laptev Sea | 897,845 | 818,855 | -78,990 | -78,990 | -74,487 | -25,700 | -10,619 | -7,430 |
| Canadian Archipelago | 853,214 | 810,271 | -42,943 | -42,943 | -23,912 | -15,090 | -4,928 | -3,406 |
| Kara Sea | 933,859 | 869,825 | -64,034 | -65,198 | -44,437 | -14,481 | -19,292 | -9,079 |
| Chukchi Sea | 966,006 | 903,001 | -63,005 | -49,419 | -23,794 | -11,676 | -15,364 | -6,480 |
| Sea of Okhotsk | 853,240 | 72,328 | -780,912 | -172,684 | -34,867 | -8,824 | -608 | 1,685 |
| Bering Sea | 697,324 | 110,295 | -587,029 | -259,246 | -112,201 | -7,340 | -4,777 | -5,541 |
| Central Arctic | 3,221,921 | 3,241,348 | 19,427 | -6,665 | -5,400 | -5,418 | -2,634 | -290 |
| Hudson Bay | 1,260,903 | 1,225,457 | -35,446 | -25,002 | 6,010 | -5,232 | -5,008 | -6,607 |
| Beaufort Sea | 1,070,445 | 1,066,643 | -3,802 | -3,802 | 16,656 | -495 | 539 | -280 |
| Baltic Sea | 15,337 | 0 | -15,337 | -8,219 | 0 | 0 | 0 | 0 |
| Yellow Sea | 0 | 0 | 0 | 0 | 0 | 0 | 0 | 0 |
| East Siberian Sea | 1,087,137 | 1,034,287 | -52,850 | -52,850 | -52,850 | 13,387 | 7,625 | 248 |
| Northern Hemisphere (Total) | 14,805,115 | 12,309,541 | -2,495,574 | -1,274,566 | -527,729 | -318,446 | -27,687 | -54,792 |
| NH (Average Loss per Day) | -39,612 | -45,520 | -37,695 | -45,492 | -9,229 | -54,792 |

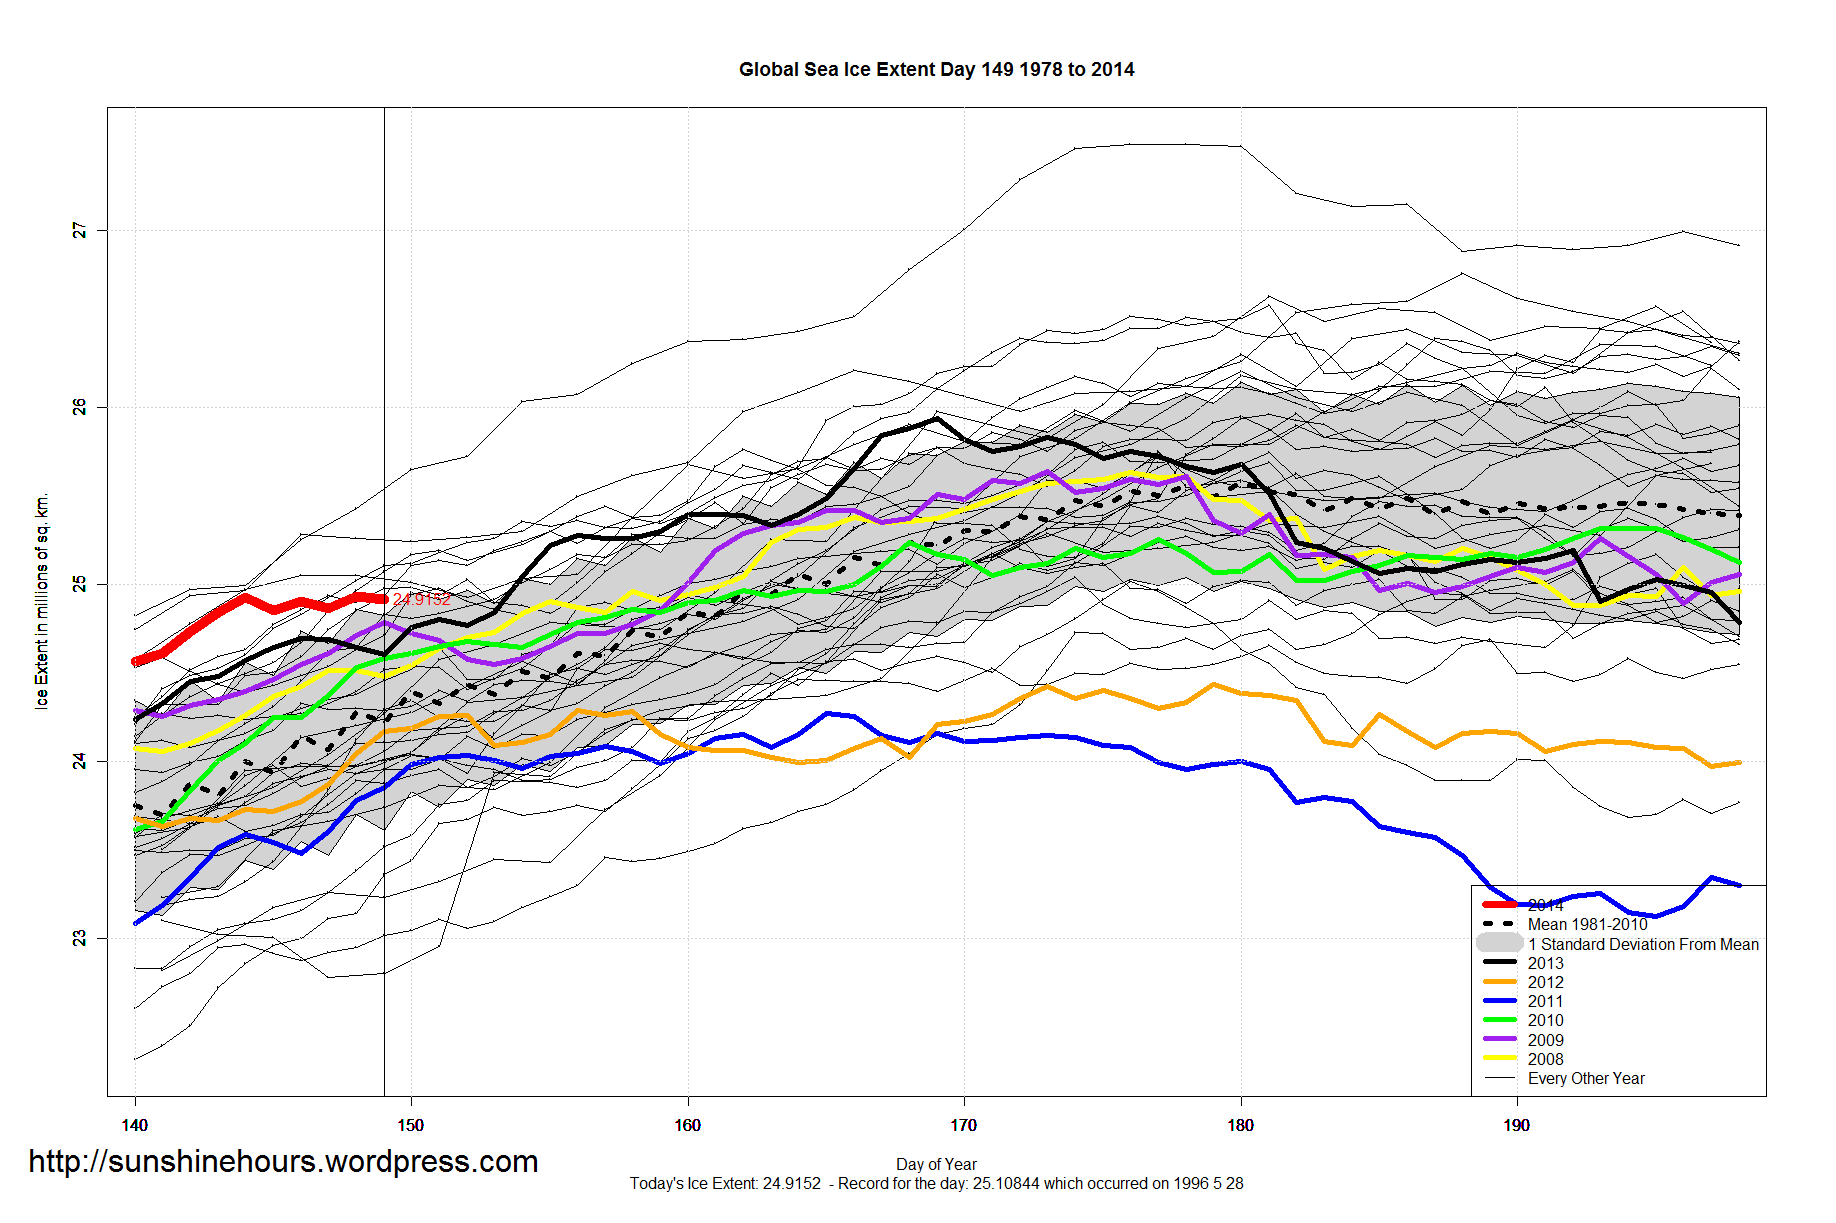
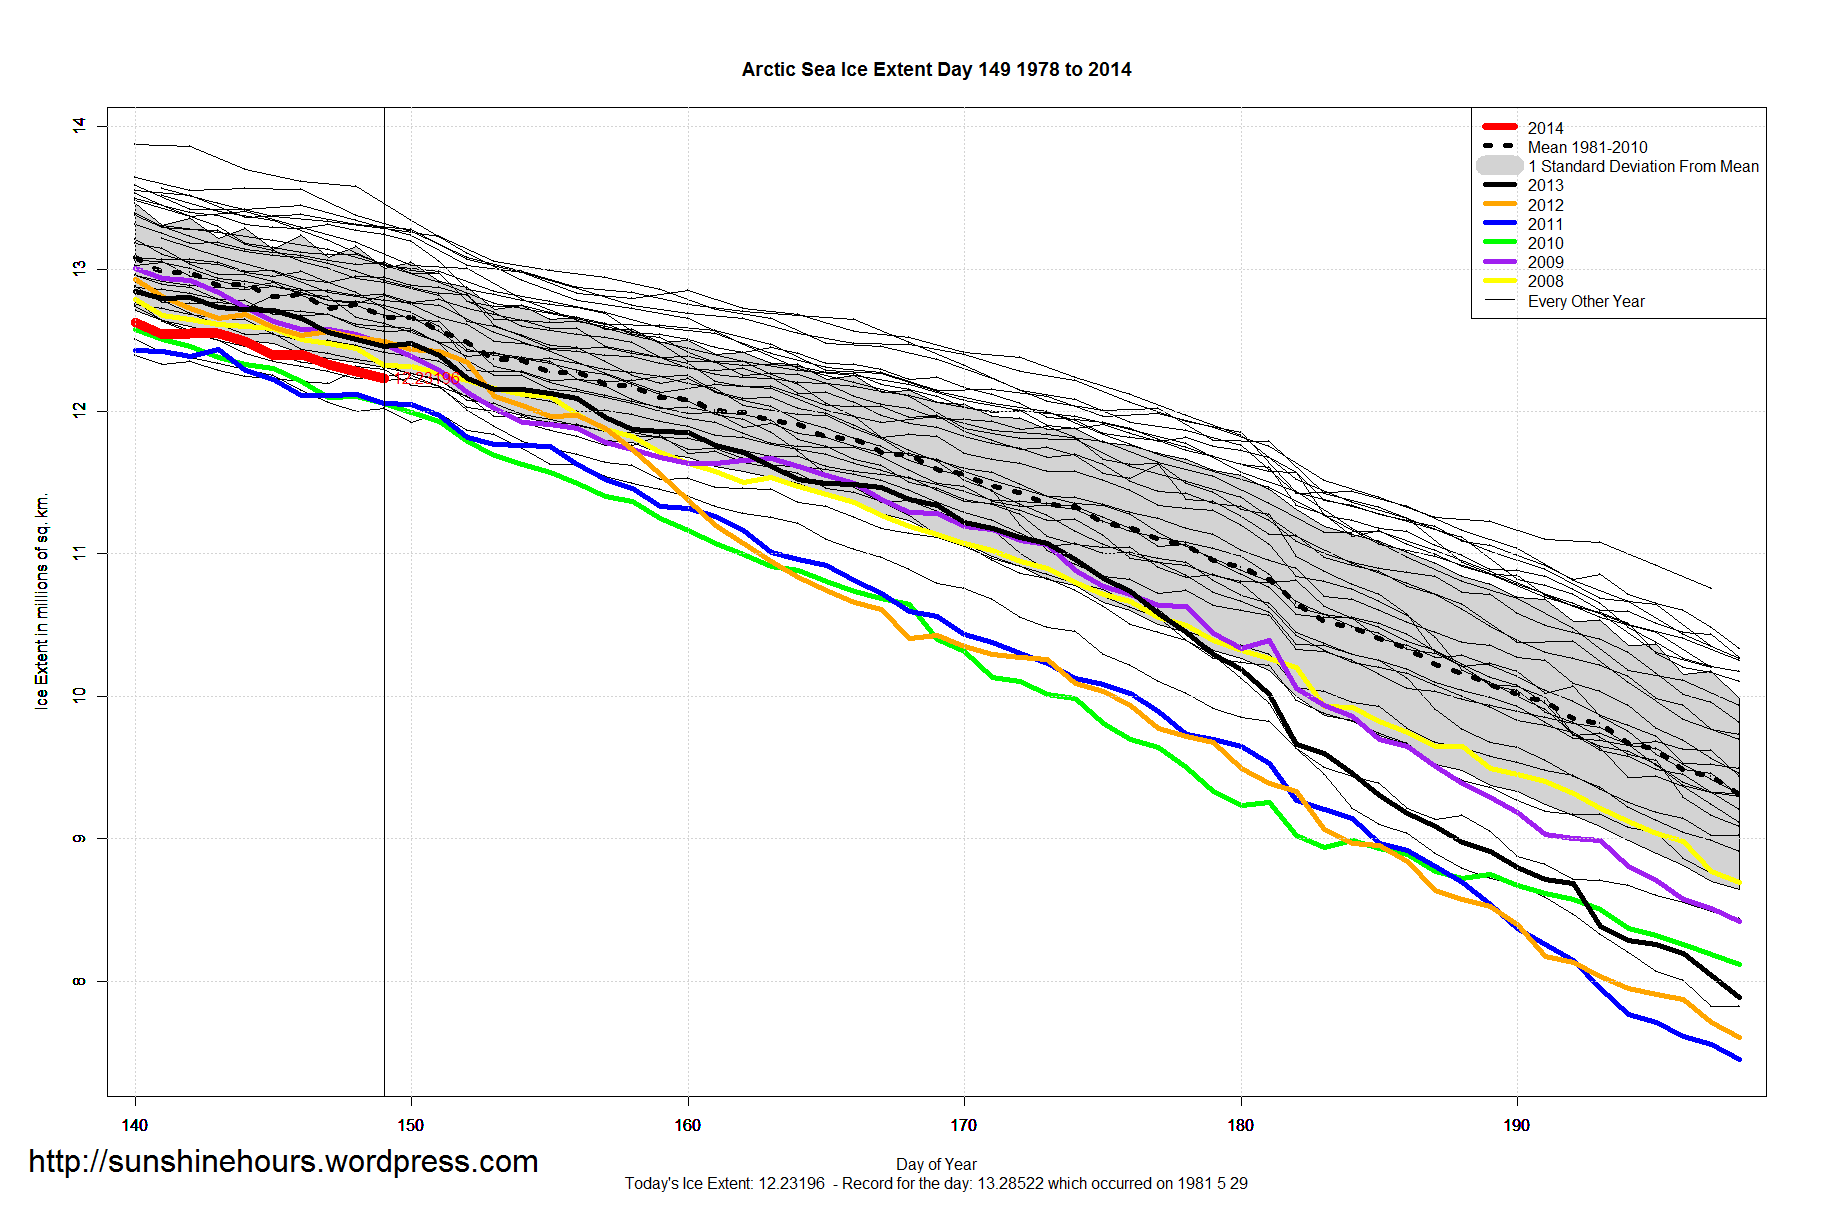
A quick update for sea ice extent for day 149 of 2014:
Graphs below. Click for bigger.

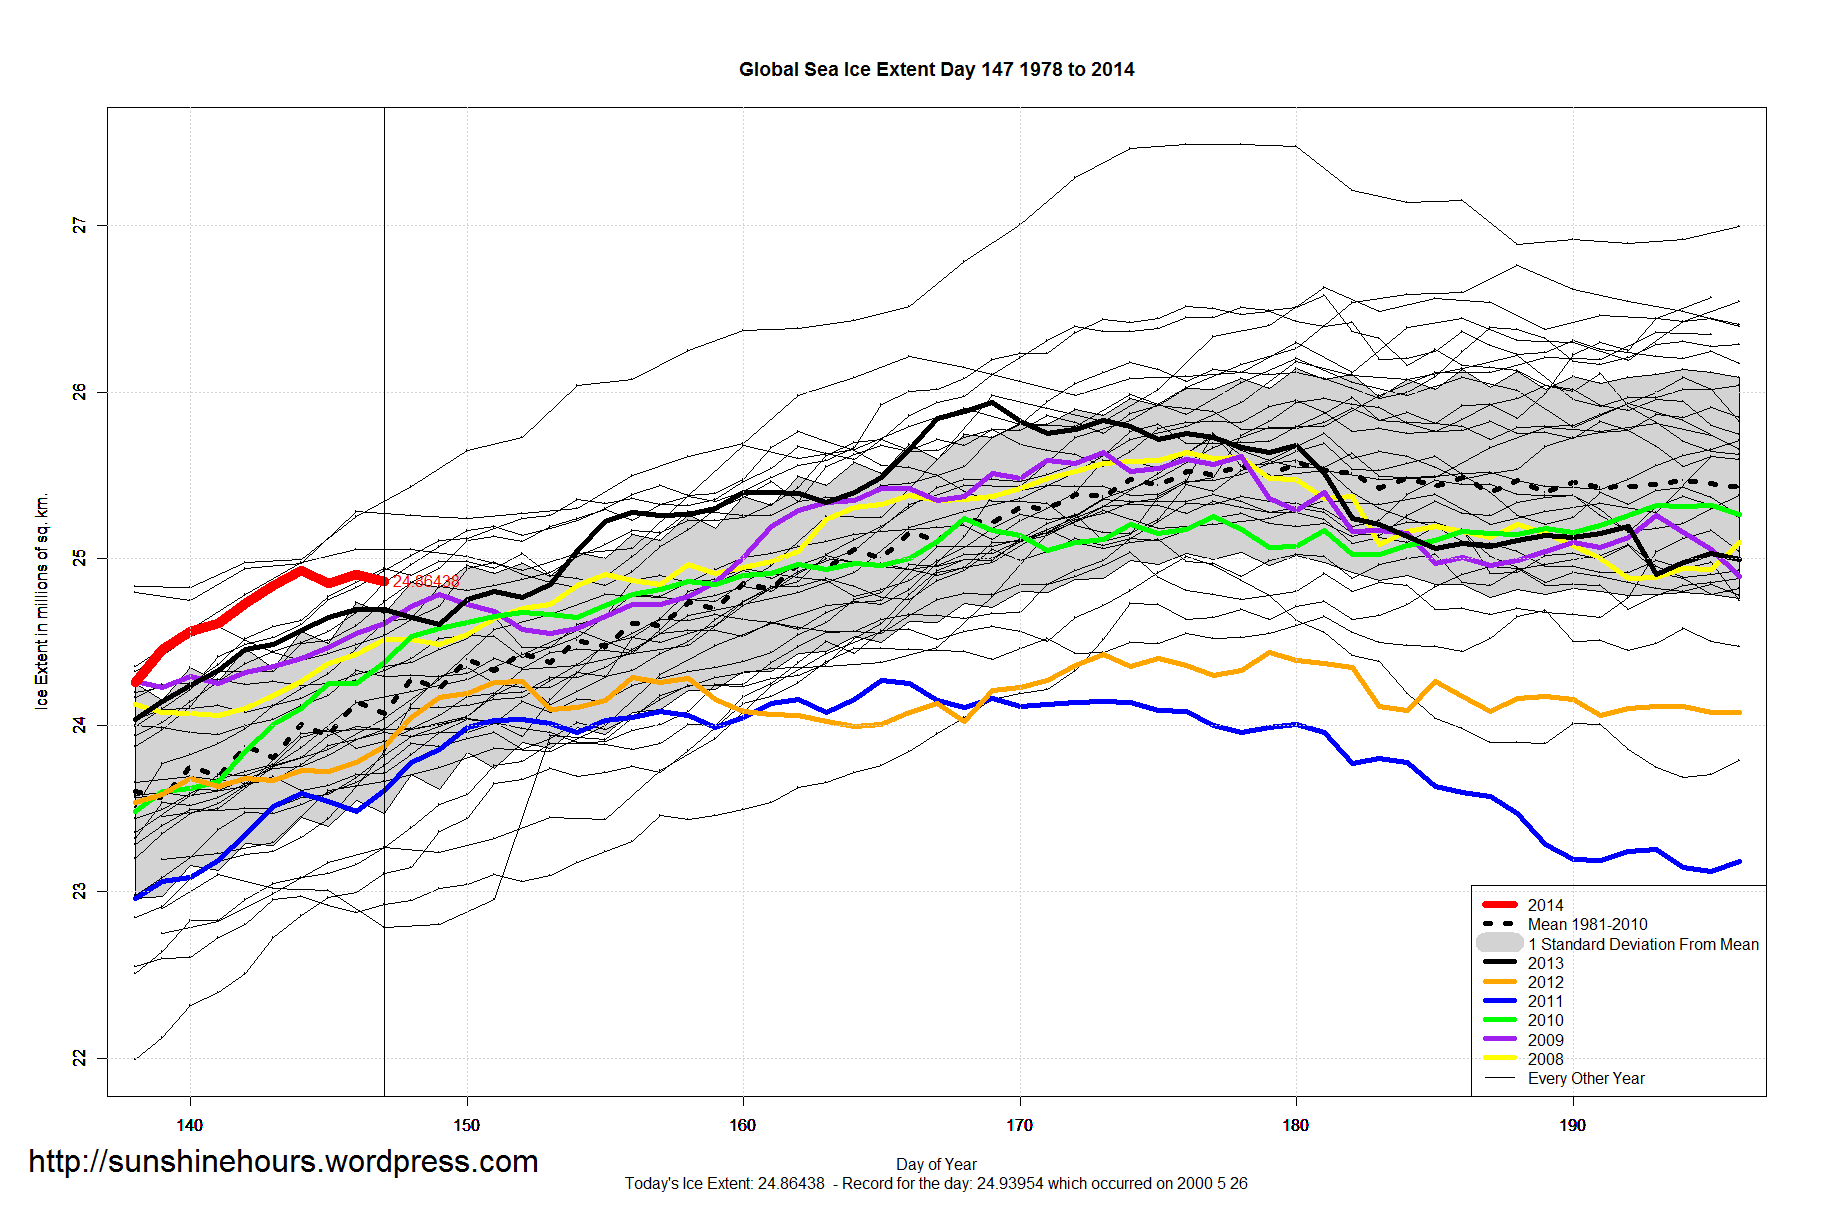
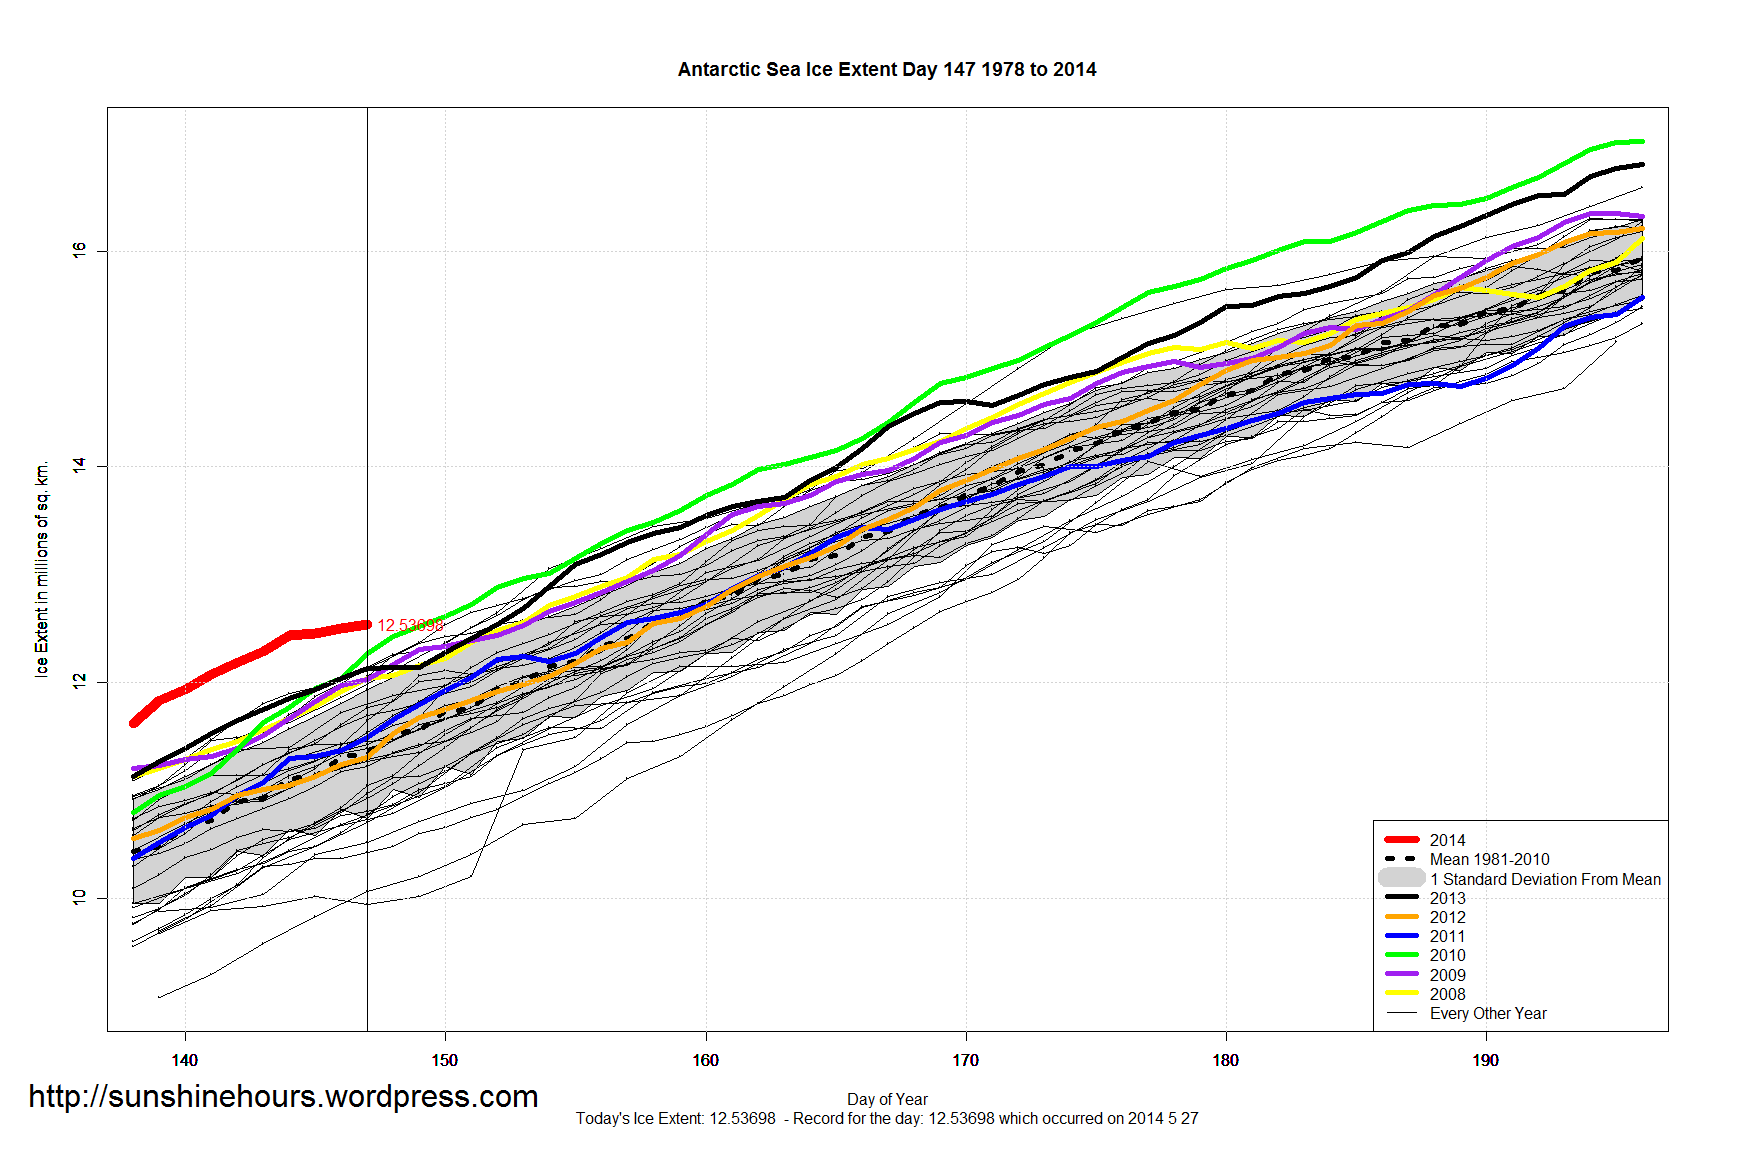
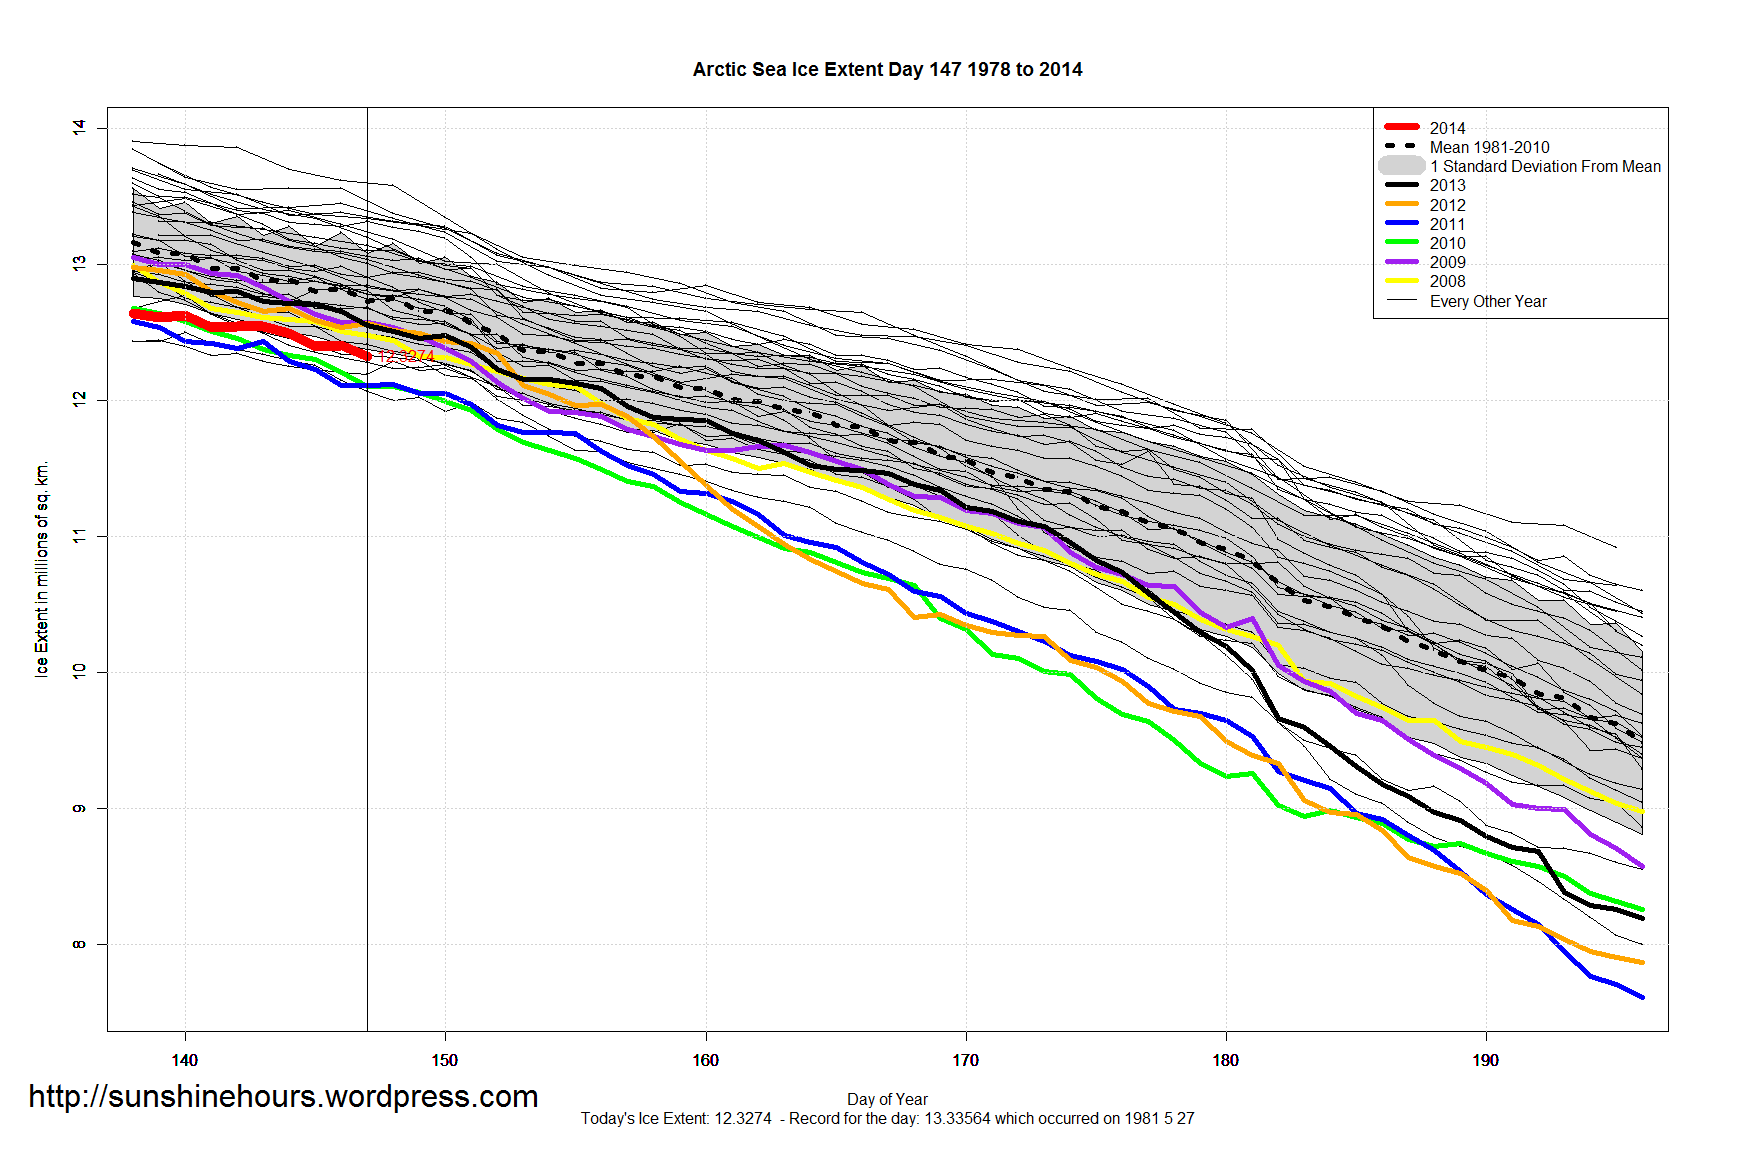
A quick update for sea ice extent for day 147 of 2014:
Graphs below. Click for bigger.
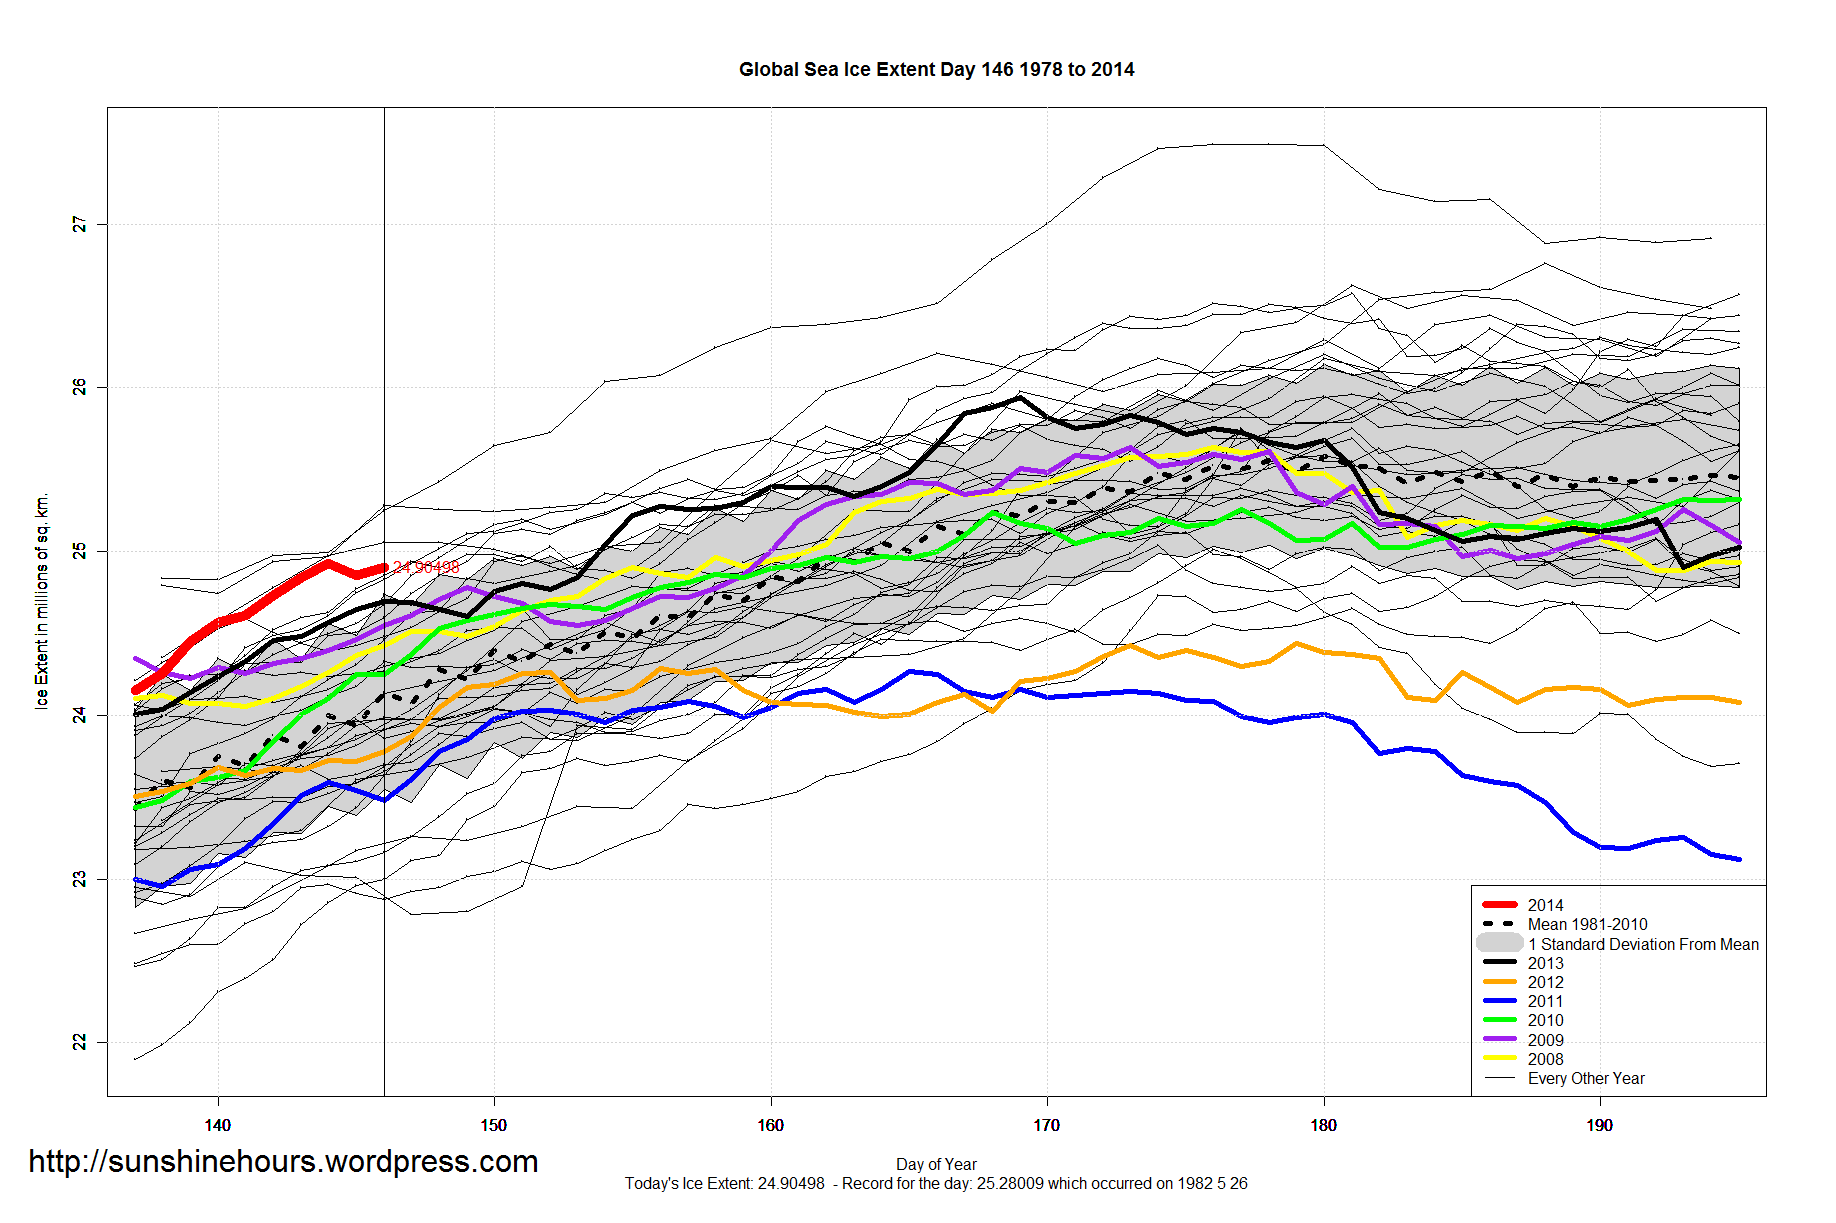
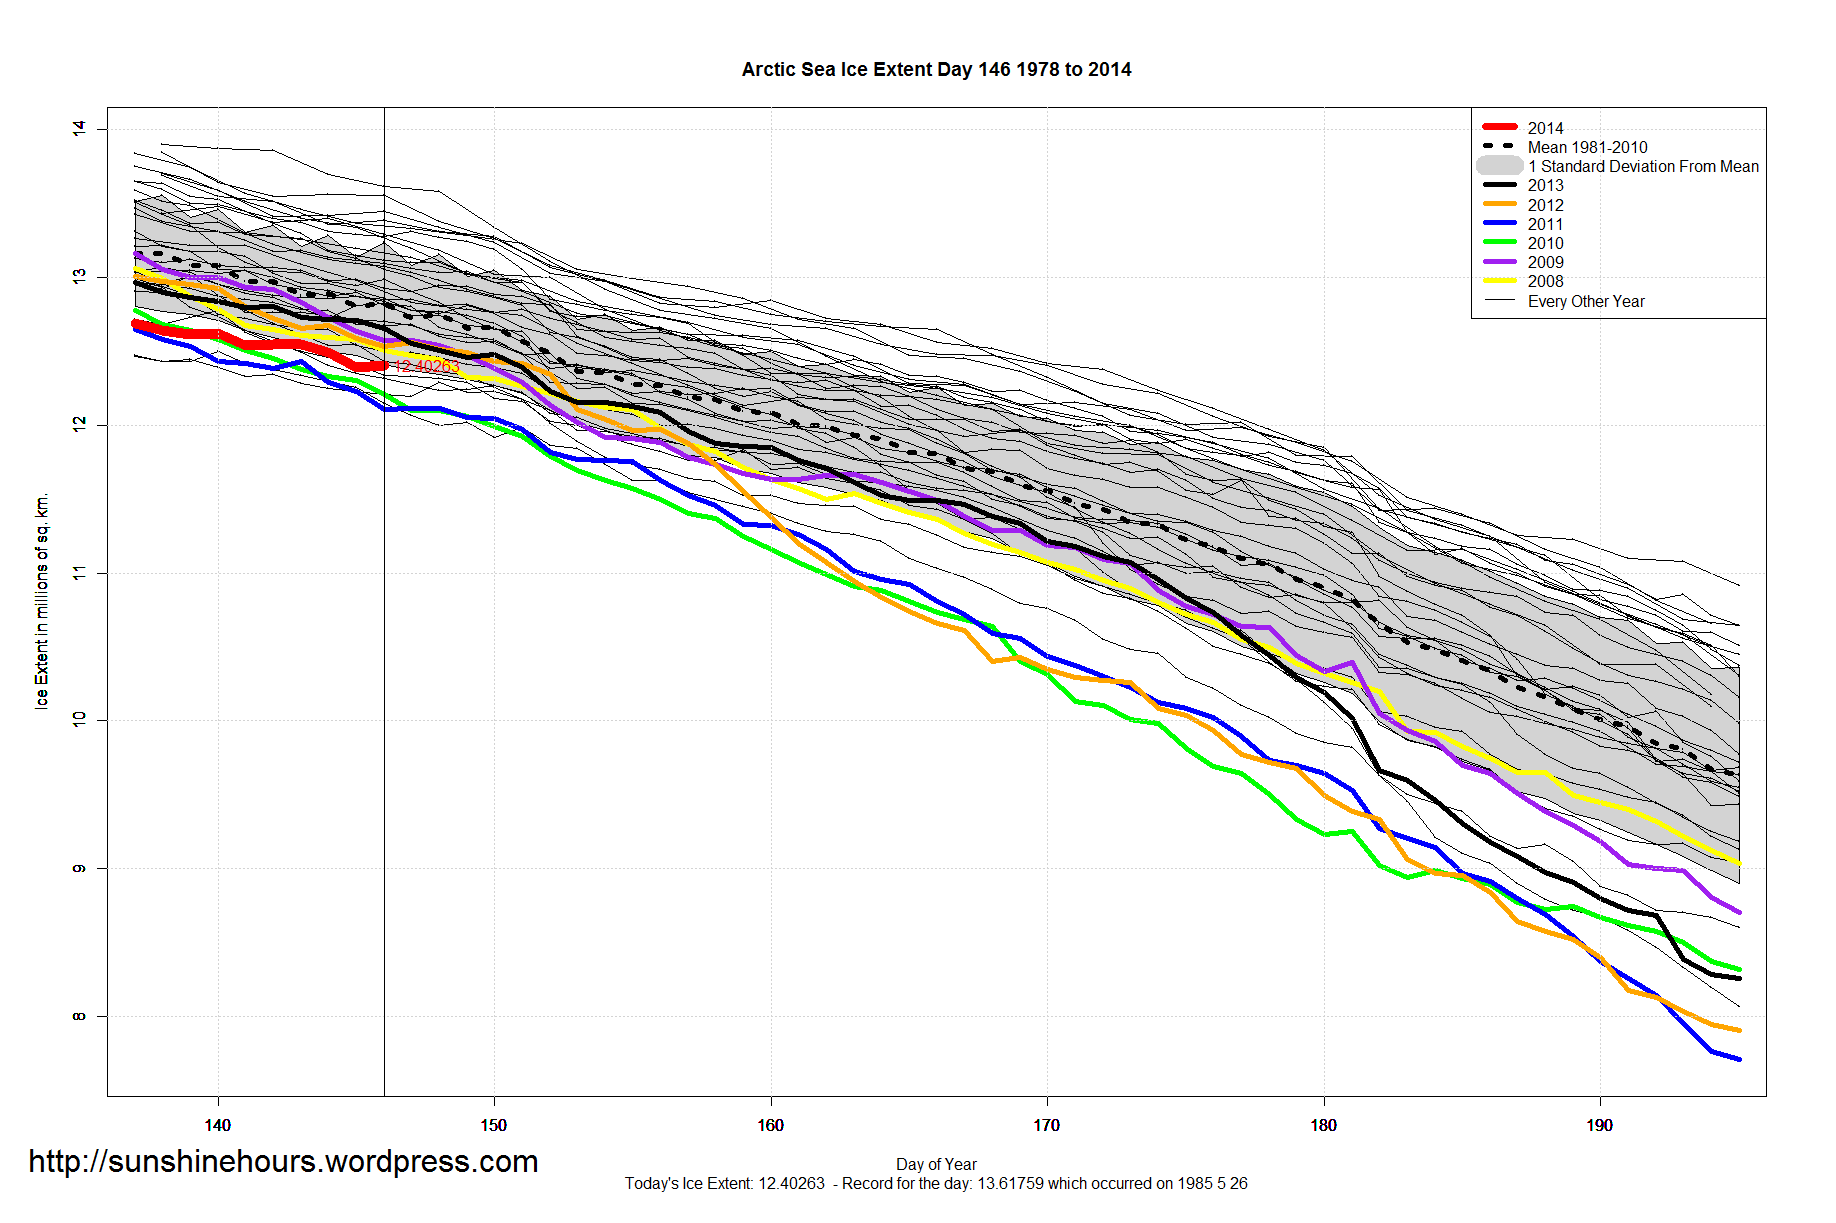
A quick update for sea ice extent for day 146 of 2014:
Graphs below. Click for bigger.

May 25 2014 MASIE Update
This is the gain/loss up to day 144. Negative = loss. Sorted with biggest loser in last 7 days at top. Northern Hemisphere is the grand total.
I’ve added a “NH (Average Loss per Day)” line to the bottom of the table. The interesting figure is that even though a lot of ice melted over the last 1 day, very little melted over the last 3 days: -7,232/day
| Region | Start | End | Last 56 | Last 28 | Last 14 | Last 7 | Last 3 | Last 1 |
| Barents Sea | 645,917 | 426,330 | -219,587 | -197,492 | -161,324 | -69,343 | -5,468 | -21,635 |
| East Siberian Sea | 1,087,137 | 1,020,900 | -66,237 | -66,237 | -66,237 | -66,237 | -9,601 | 0 |
| Bering Sea | 697,324 | 116,770 | -580,554 | -348,719 | -187,839 | -50,274 | 4,780 | -866 |
| Laptev Sea | 897,845 | 844,555 | -53,290 | -53,290 | -48,104 | -48,787 | -8,963 | 0 |
| Baffin Bay Gulf of St. Lawrence | 1,688,530 | 1,159,590 | -528,941 | -348,384 | -82,592 | -40,205 | -29,385 | -24,069 |
| Sea of Okhotsk | 853,240 | 68,004 | -785,236 | -330,041 | -74,417 | -36,163 | -13,934 | -13,148 |
| Kara Sea | 933,859 | 877,476 | -56,383 | -57,547 | -49,337 | -35,799 | -9,626 | -6,829 |
| Chukchi Sea | 966,006 | 914,677 | -51,329 | -51,329 | -38,707 | -14,015 | -2,244 | 0 |
| Canadian Archipelago | 853,214 | 823,129 | -30,085 | -30,085 | -9,967 | -10,396 | 1,002 | -2,232 |
| Baltic Sea | 15,337 | 0 | -15,337 | -8,172 | -8,065 | 0 | 0 | 0 |
| Yellow Sea | 0 | 0 | 0 | 0 | 0 | 0 | 0 | 0 |
| Central Arctic | 3,221,921 | 3,246,766 | 24,844 | -1,247 | -1,247 | 18 | 72 | 0 |
| Beaufort Sea | 1,070,445 | 1,069,505 | -940 | -940 | -940 | 16,478 | 4,165 | 2,367 |
| Hudson Bay | 1,260,903 | 1,235,572 | -25,331 | -25,331 | 15,864 | 18,058 | 3,072 | 4,883 |
| Greenland Sea | 603,416 | 736,975 | 133,559 | 94,070 | 136,343 | 29,406 | 44,112 | -25,034 |
| Northern Hemisphere (Total) | 14,805,115 | 12,541,745 | -2,263,370 | -1,425,454 | -576,650 | -306,971 | -21,697 | -86,242 |
| NH (Average Loss per Day) | -39,708 | -50,909 | -41,189 | -43,853 | -7,232 | -86,242 |

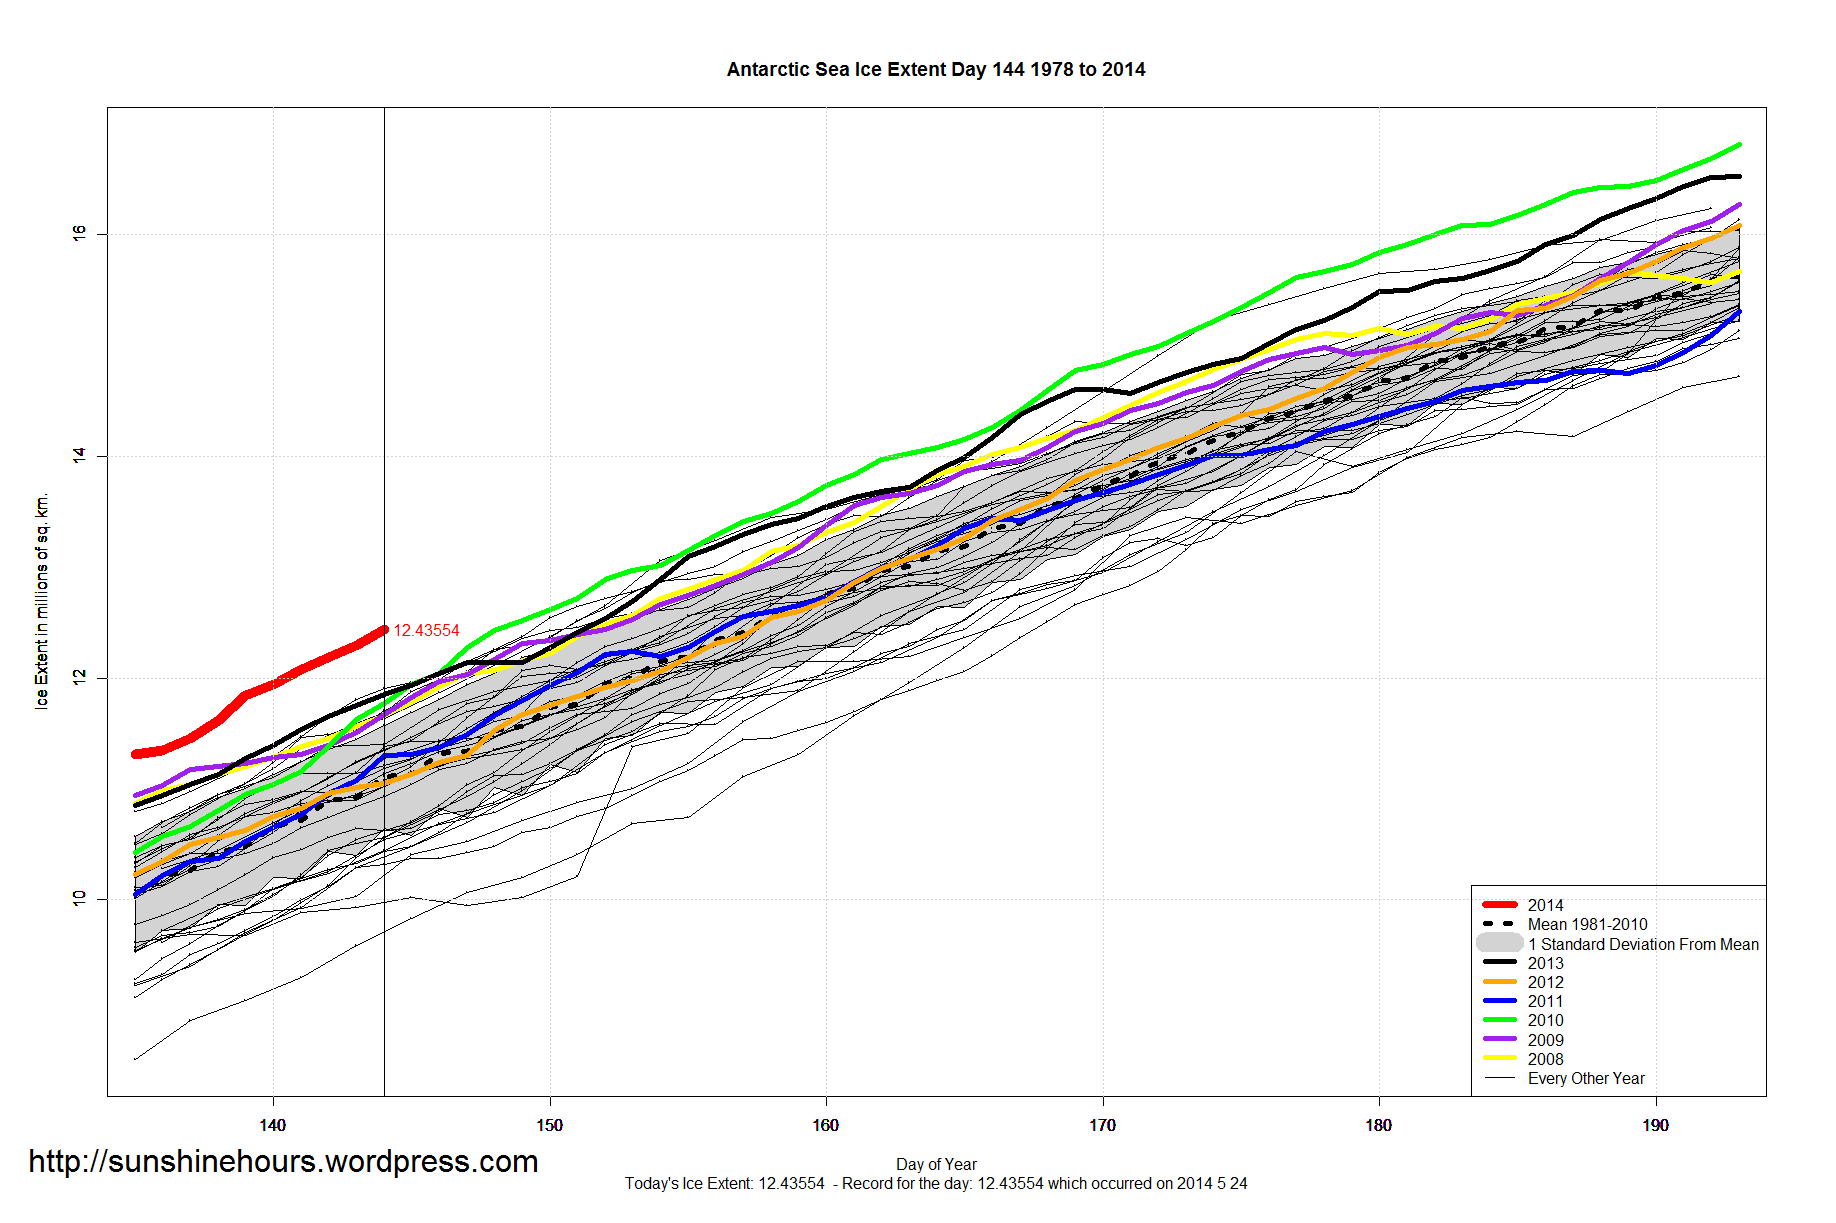
A quick update for sea ice extent for day 144 of 2014:
Graphs below. Click for bigger.


May 23 2014 MASIE Update
This is the gain/loss up to day 42. Negative = loss. Sorted with biggest loser in last 7 days at top. Northern Hemisphere is the grand total.
Over the last day Arctic Sea Ice actually rose 71,918 sq km.
Greenland Sea is actually 128,906 higher than it was 54 days ago. Central Arctic is a little higher than 54 days ago.
| Region | Start | End | Last 54 | Last 28 | Last 14 | Last 7 | Last 3 | Last 1 |
| Bering Sea | 697,324 | 123,222 | -574,102 | -393,550 | -241,699 | -115,261 | -22,203 | 11,232 |
| Barents Sea | 645,917 | 457,488 | -188,429 | -163,976 | -223,226 | -63,857 | -48,336 | 25,690 |
| East Siberian Sea | 1,087,137 | 1,032,550 | -54,587 | -54,587 | -54,587 | -54,587 | 4,155 | 2,049 |
| Kara Sea | 933,859 | 888,854 | -45,006 | -46,170 | -46,170 | -39,891 | -27,783 | 1,751 |
| Laptev Sea | 897,845 | 856,855 | -40,990 | -40,990 | -40,990 | -36,487 | -28,395 | 3,337 |
| Sea of Okhotsk | 853,240 | 79,942 | -773,298 | -330,572 | -86,154 | -23,851 | -13,813 | -1,996 |
| Canadian Archipelago | 853,214 | 823,902 | -29,312 | -29,312 | -24,790 | -10,281 | -9,624 | 1,774 |
| Chukchi Sea | 966,006 | 916,921 | -49,085 | -49,085 | -35,691 | -9,874 | 2,459 | 0 |
| Central Arctic | 3,221,921 | 3,246,693 | 24,772 | -1,320 | -1,320 | -1,049 | -126 | 0 |
| Baltic Sea | 15,337 | 0 | -15,337 | -8,356 | -9,170 | 0 | 0 | 0 |
| Yellow Sea | 0 | 0 | 0 | 0 | 0 | 0 | 0 | 0 |
| Baffin Bay Gulf of St. Lawrence | 1,688,530 | 1,179,599 | -508,931 | -380,919 | -75,117 | 5,981 | -36,203 | -9,376 |
| Hudson Bay | 1,260,903 | 1,230,482 | -30,422 | -30,422 | -24,442 | 13,734 | -825 | -2,019 |
| Beaufort Sea | 1,070,445 | 1,065,340 | -5,105 | -5,105 | 8,745 | 15,352 | 12,764 | 0 |
| Greenland Sea | 603,416 | 732,322 | 128,906 | 88,573 | 113,953 | 97,131 | 19,995 | 39,459 |
| Northern Hemisphere (Total) | 14,805,115 | 12,635,360 | -2,169,755 | -1,446,806 | -741,488 | -223,244 | -147,953 | 71,918 |
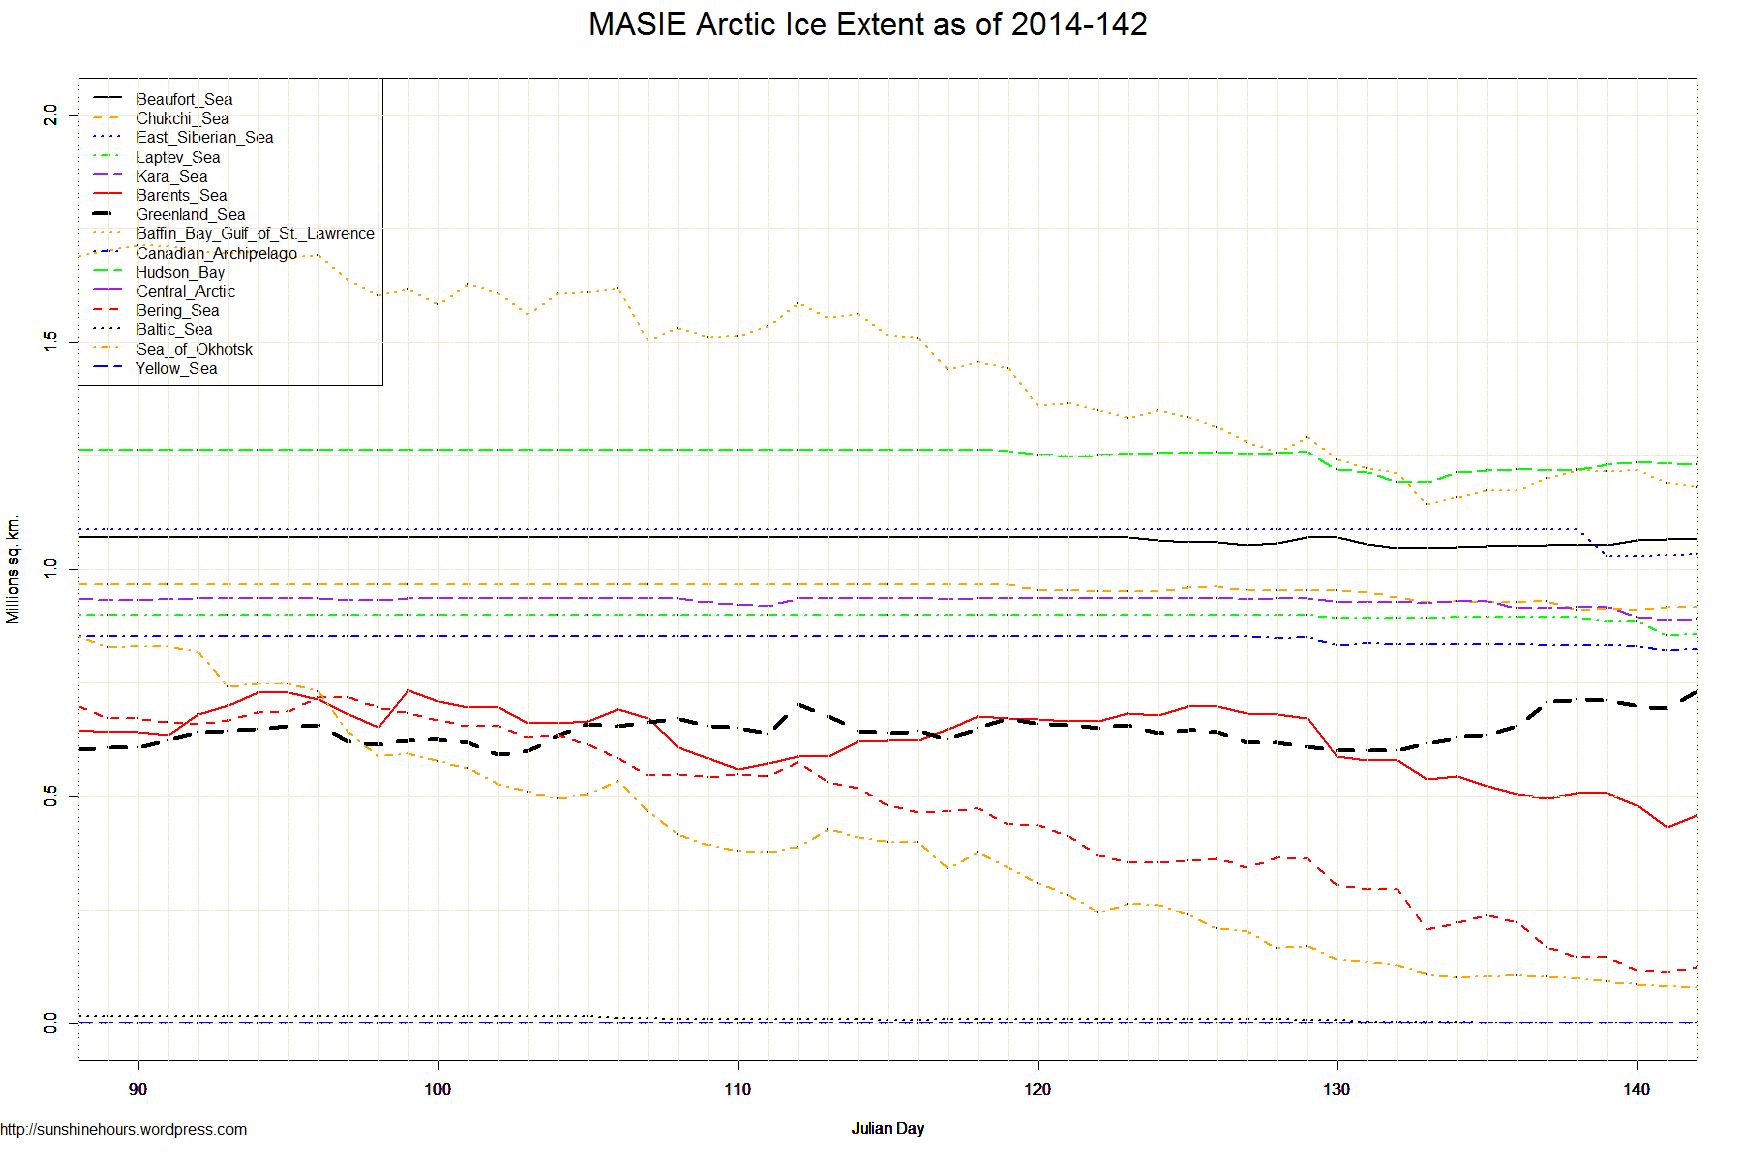
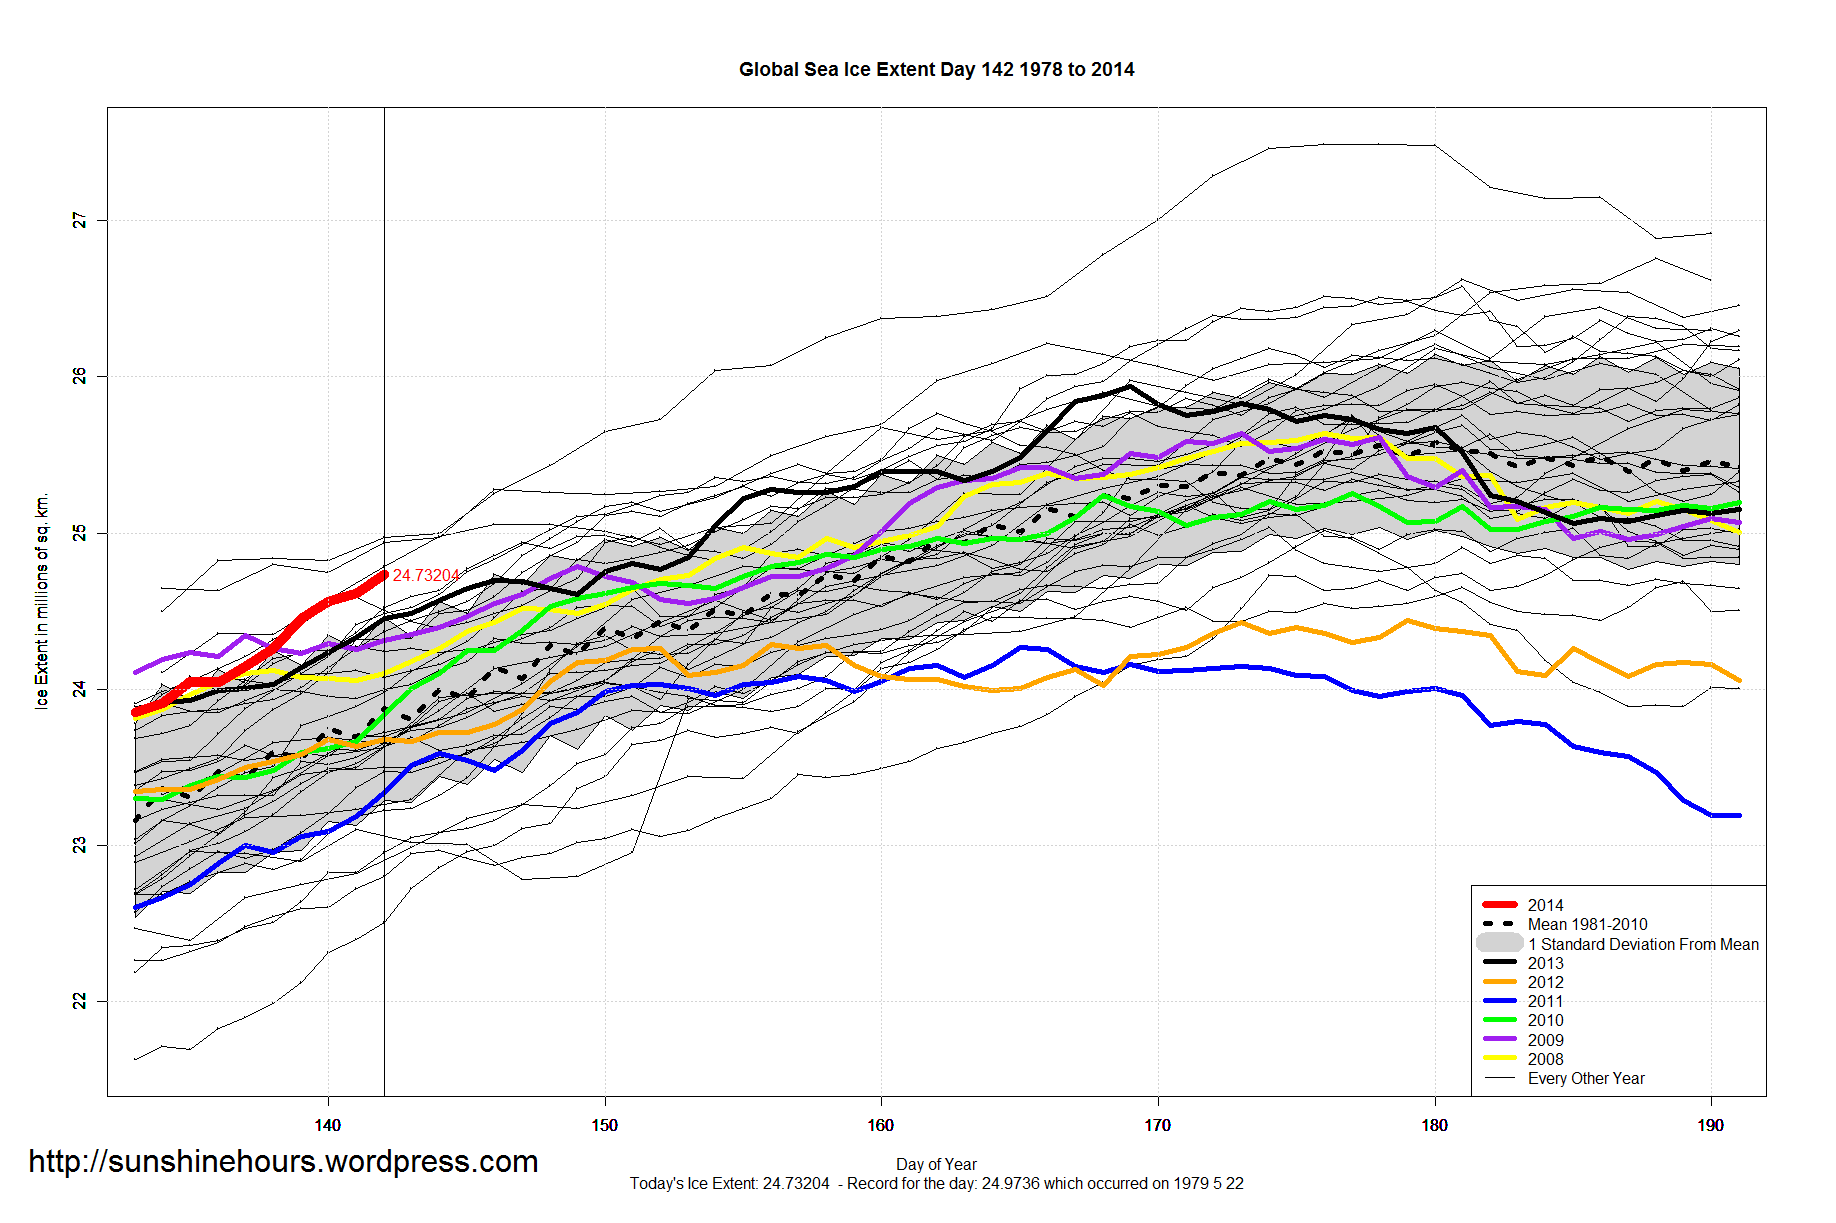
A quick update for sea ice extent for day 142 of 2014:
Graphs below. Click for bigger.


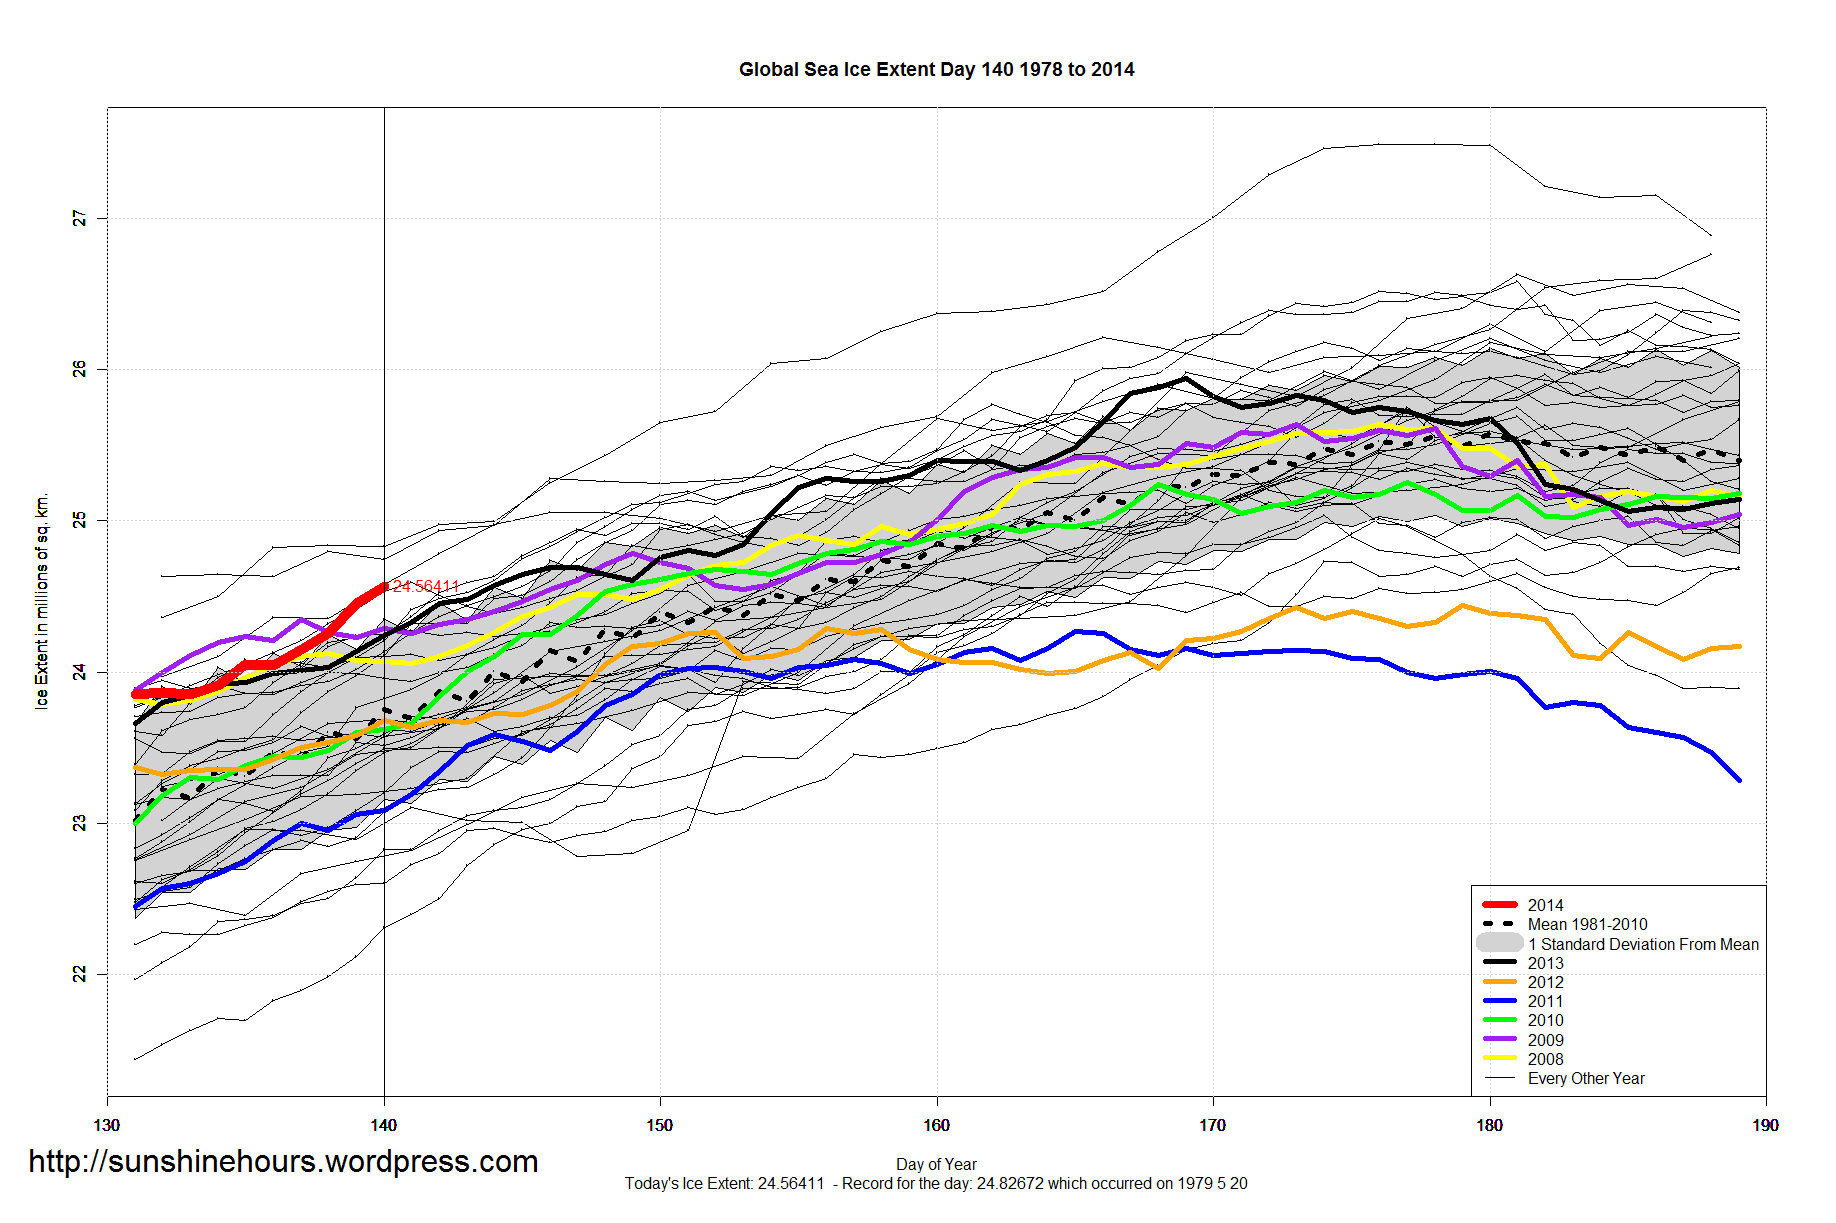
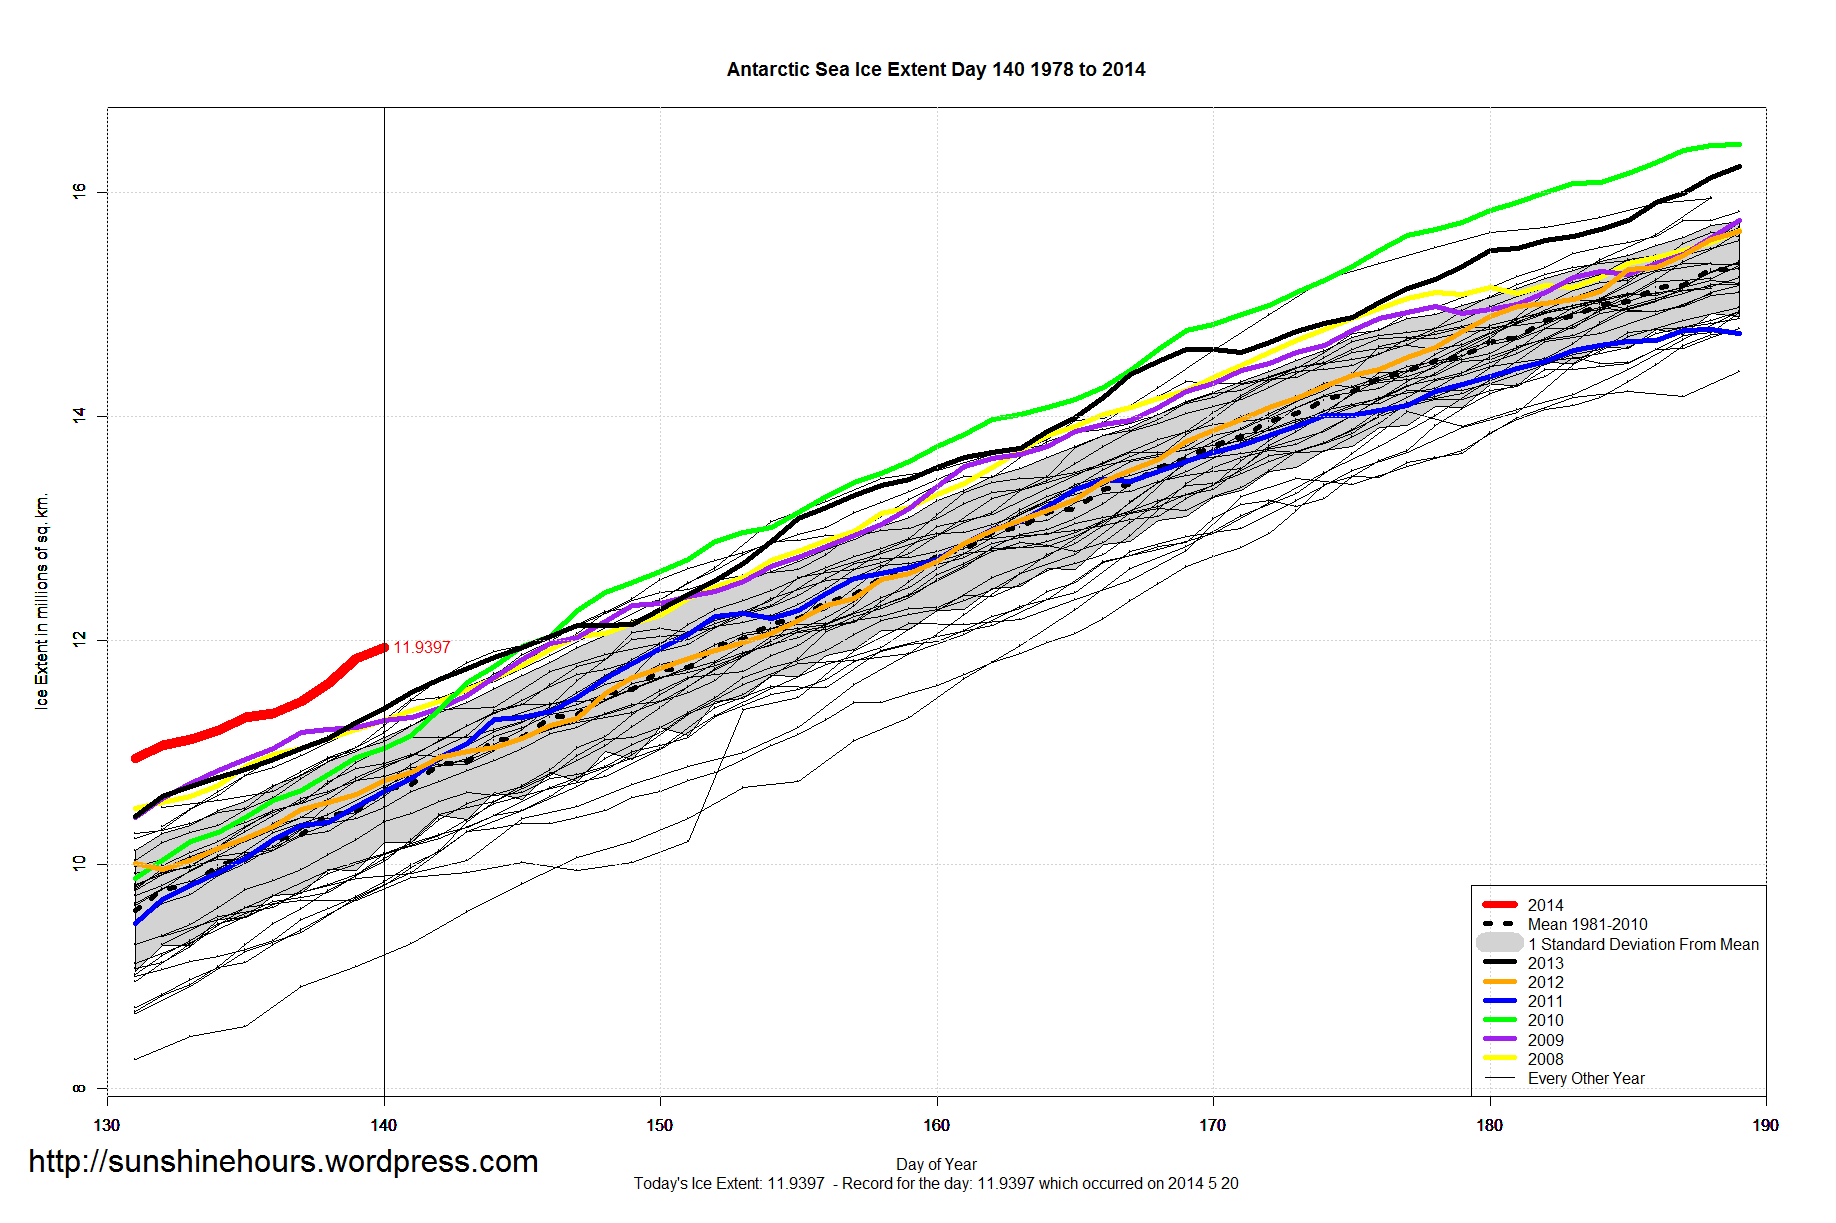
A quick update for sea ice extent for day 140 of 2014:
Graphs below. Click for bigger.