NSIDC has not updated their sea ice data for 2 days. I’m not sure what is going on. St Patrick’s Day Holiday Weekend? 🙂
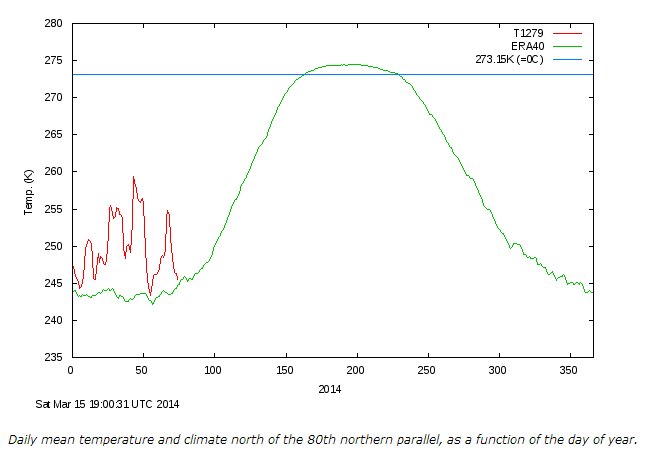
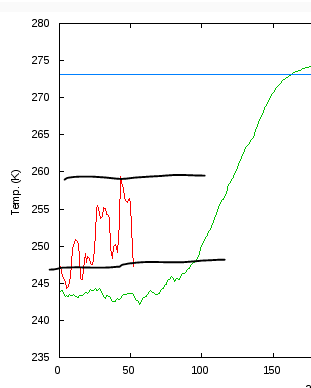
Temperatures north of 80 have been yo-yoing up and down and currently are near “normal” according to DMI.
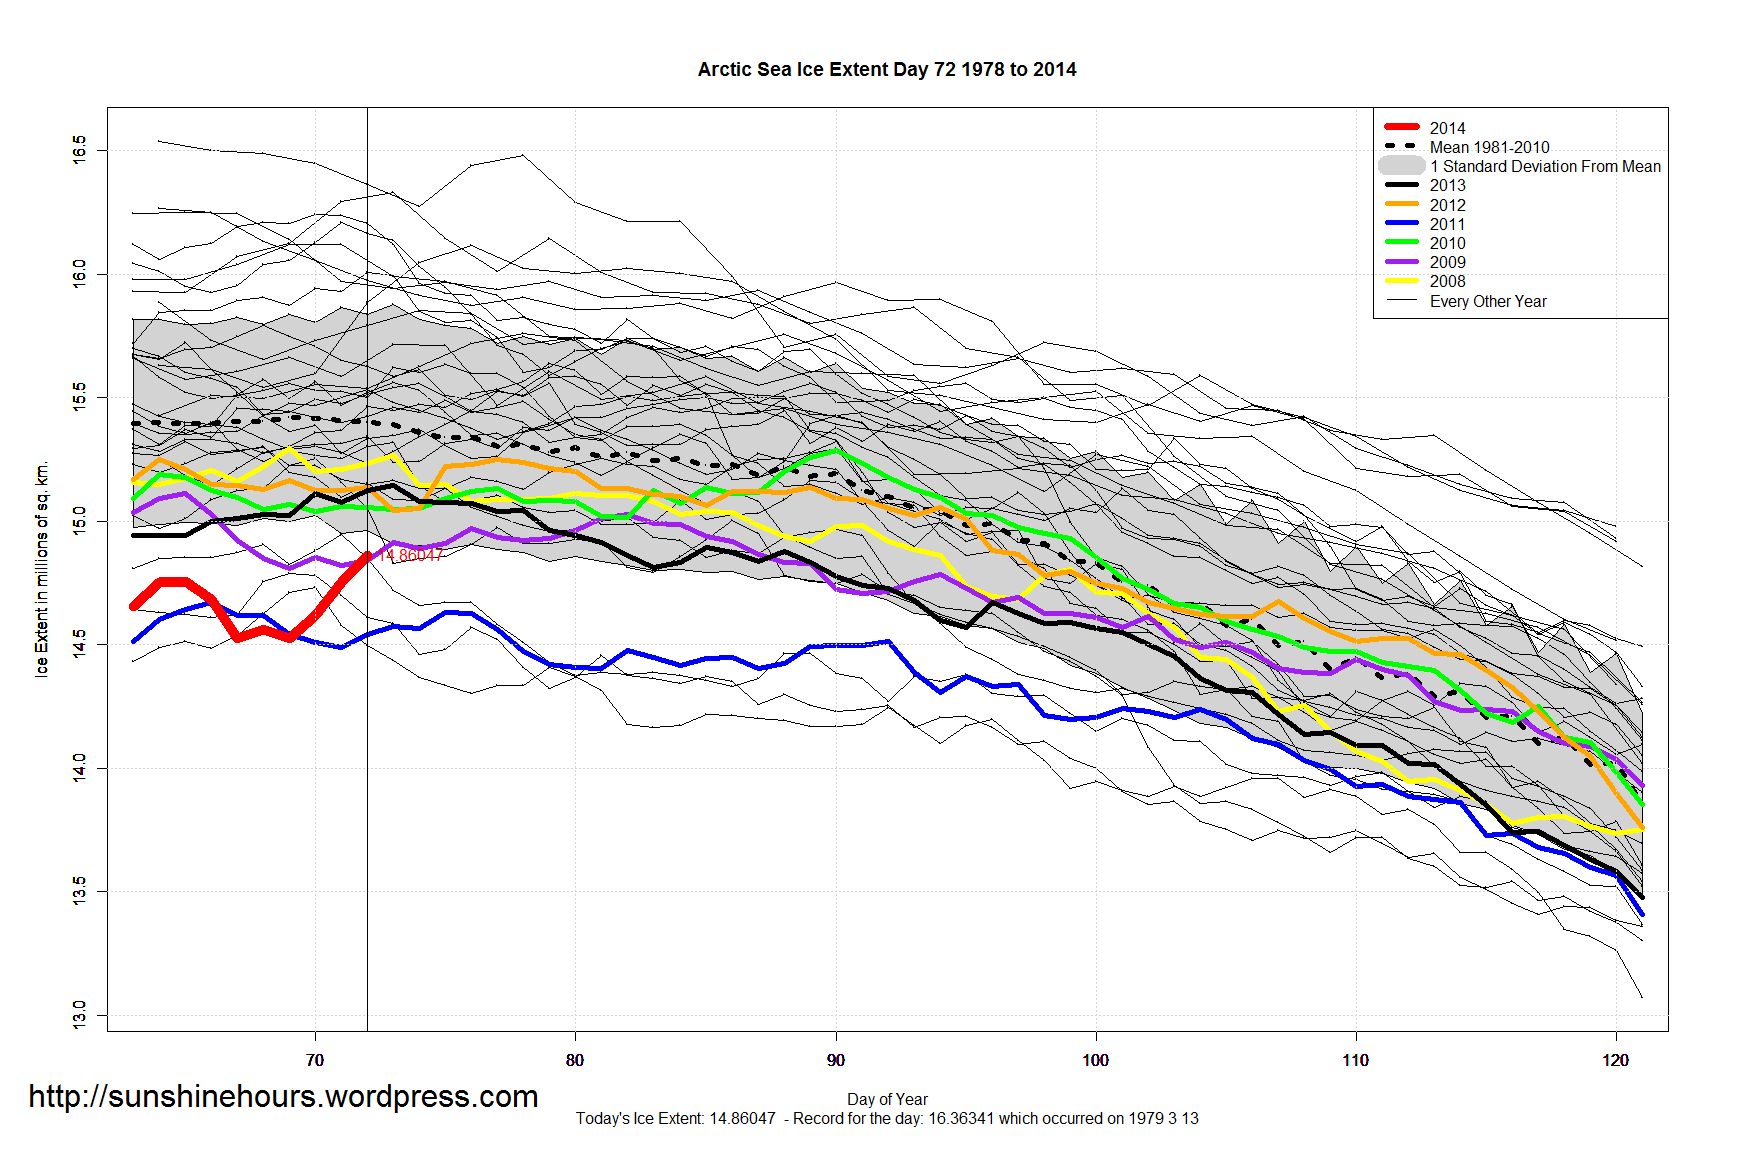
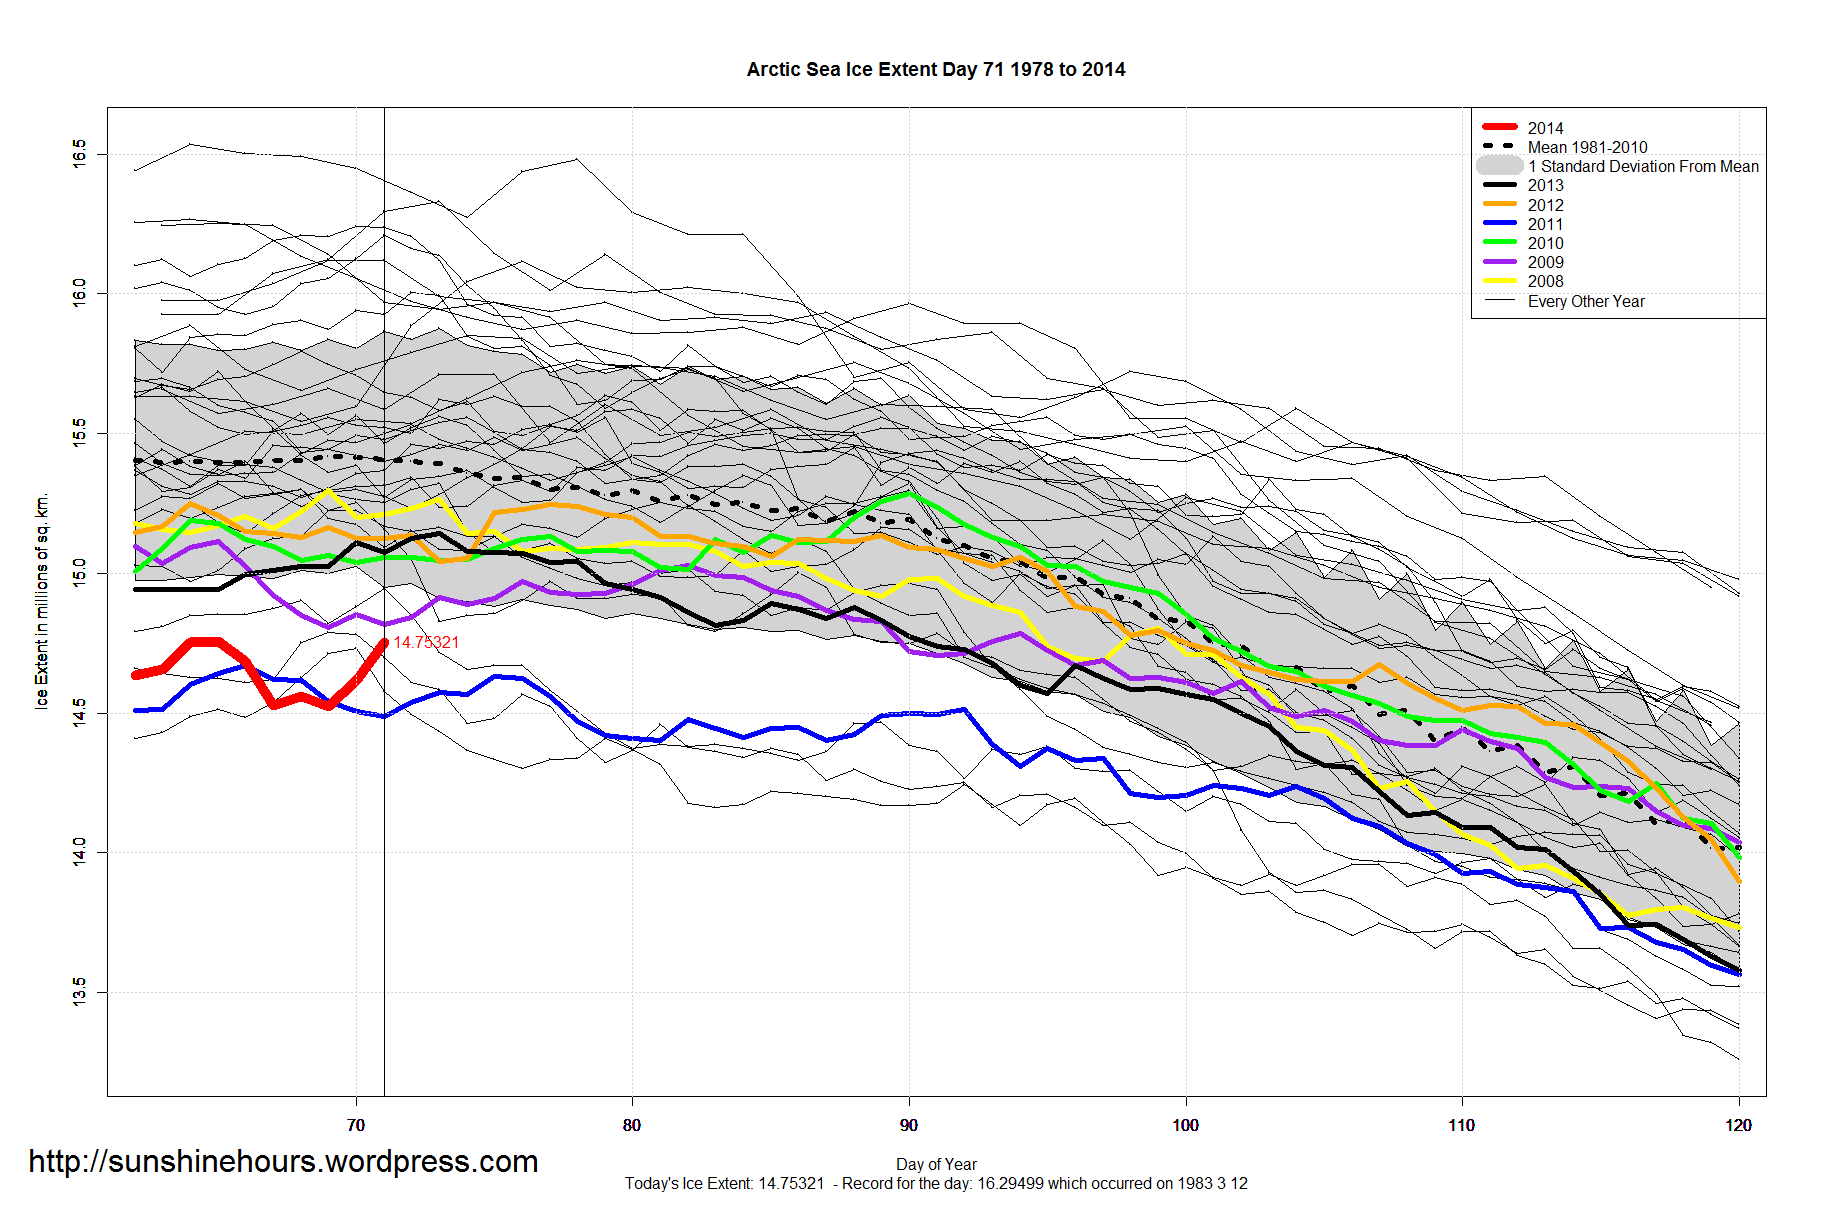
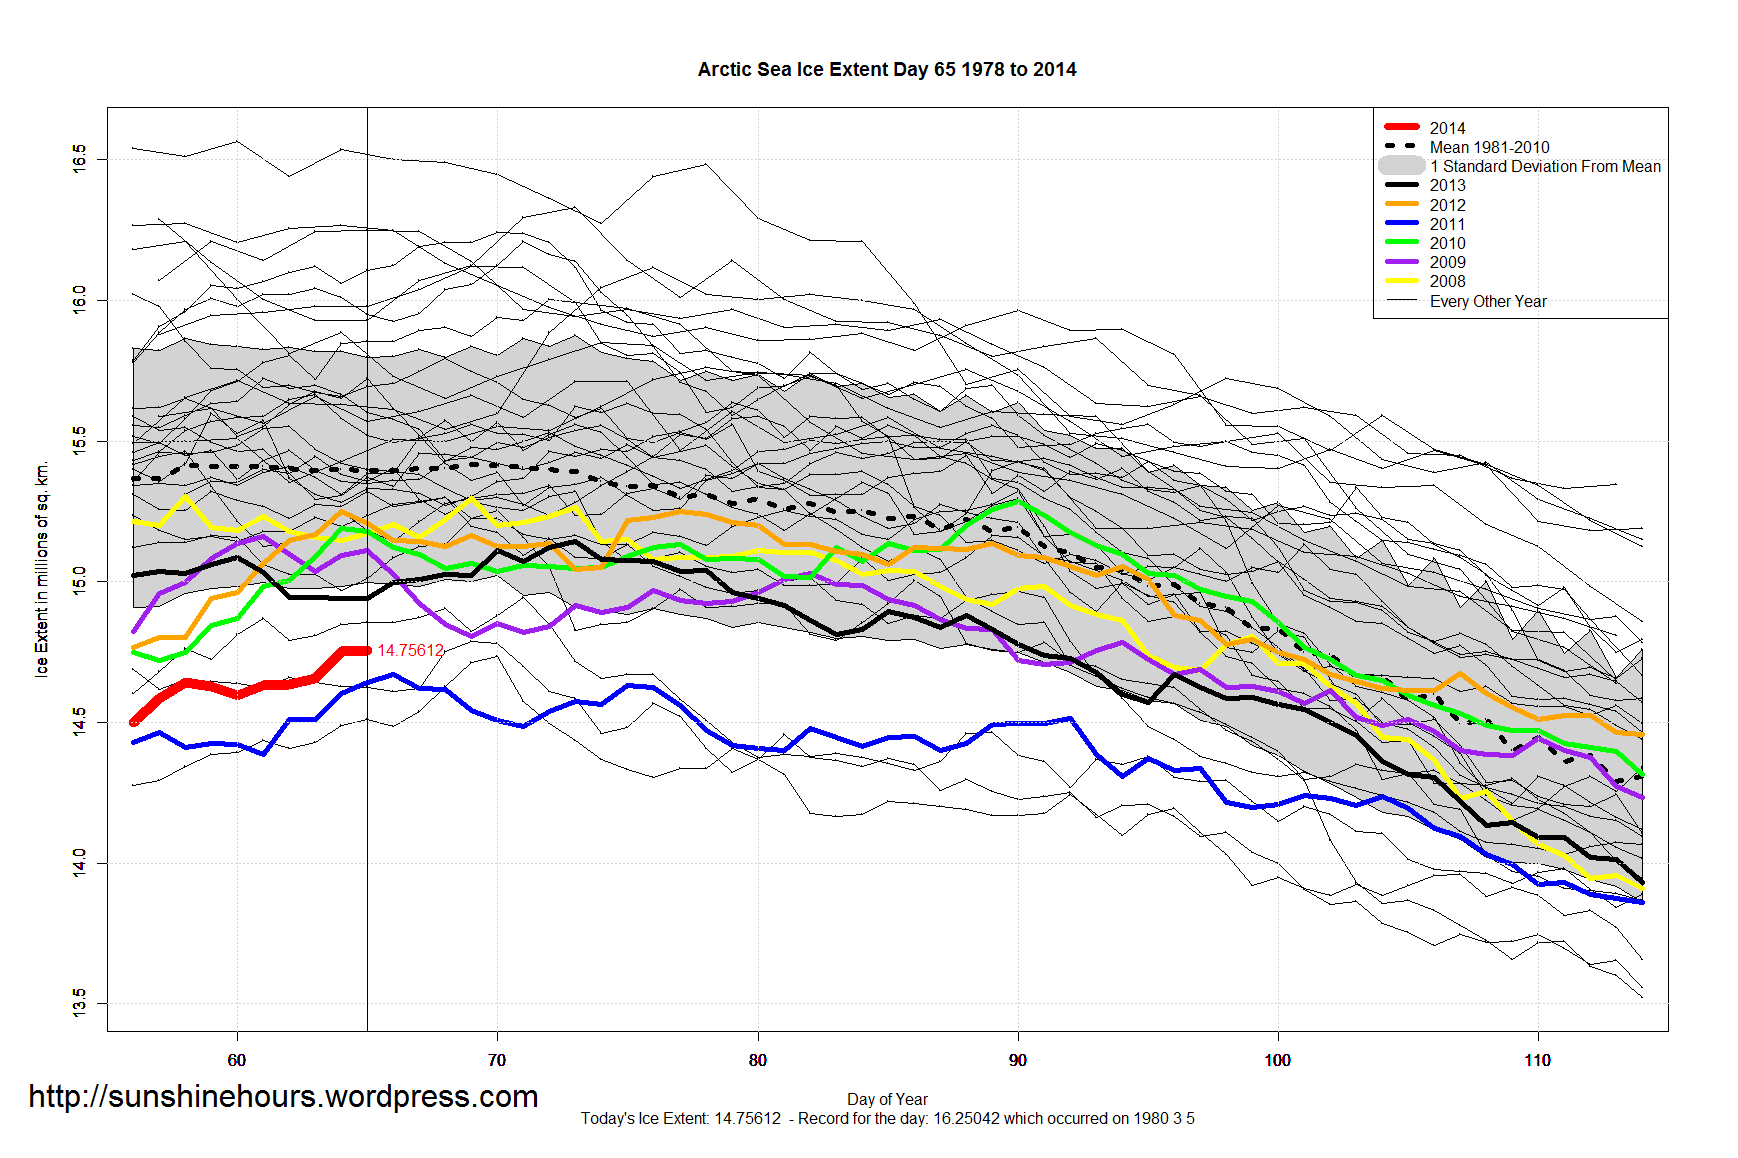
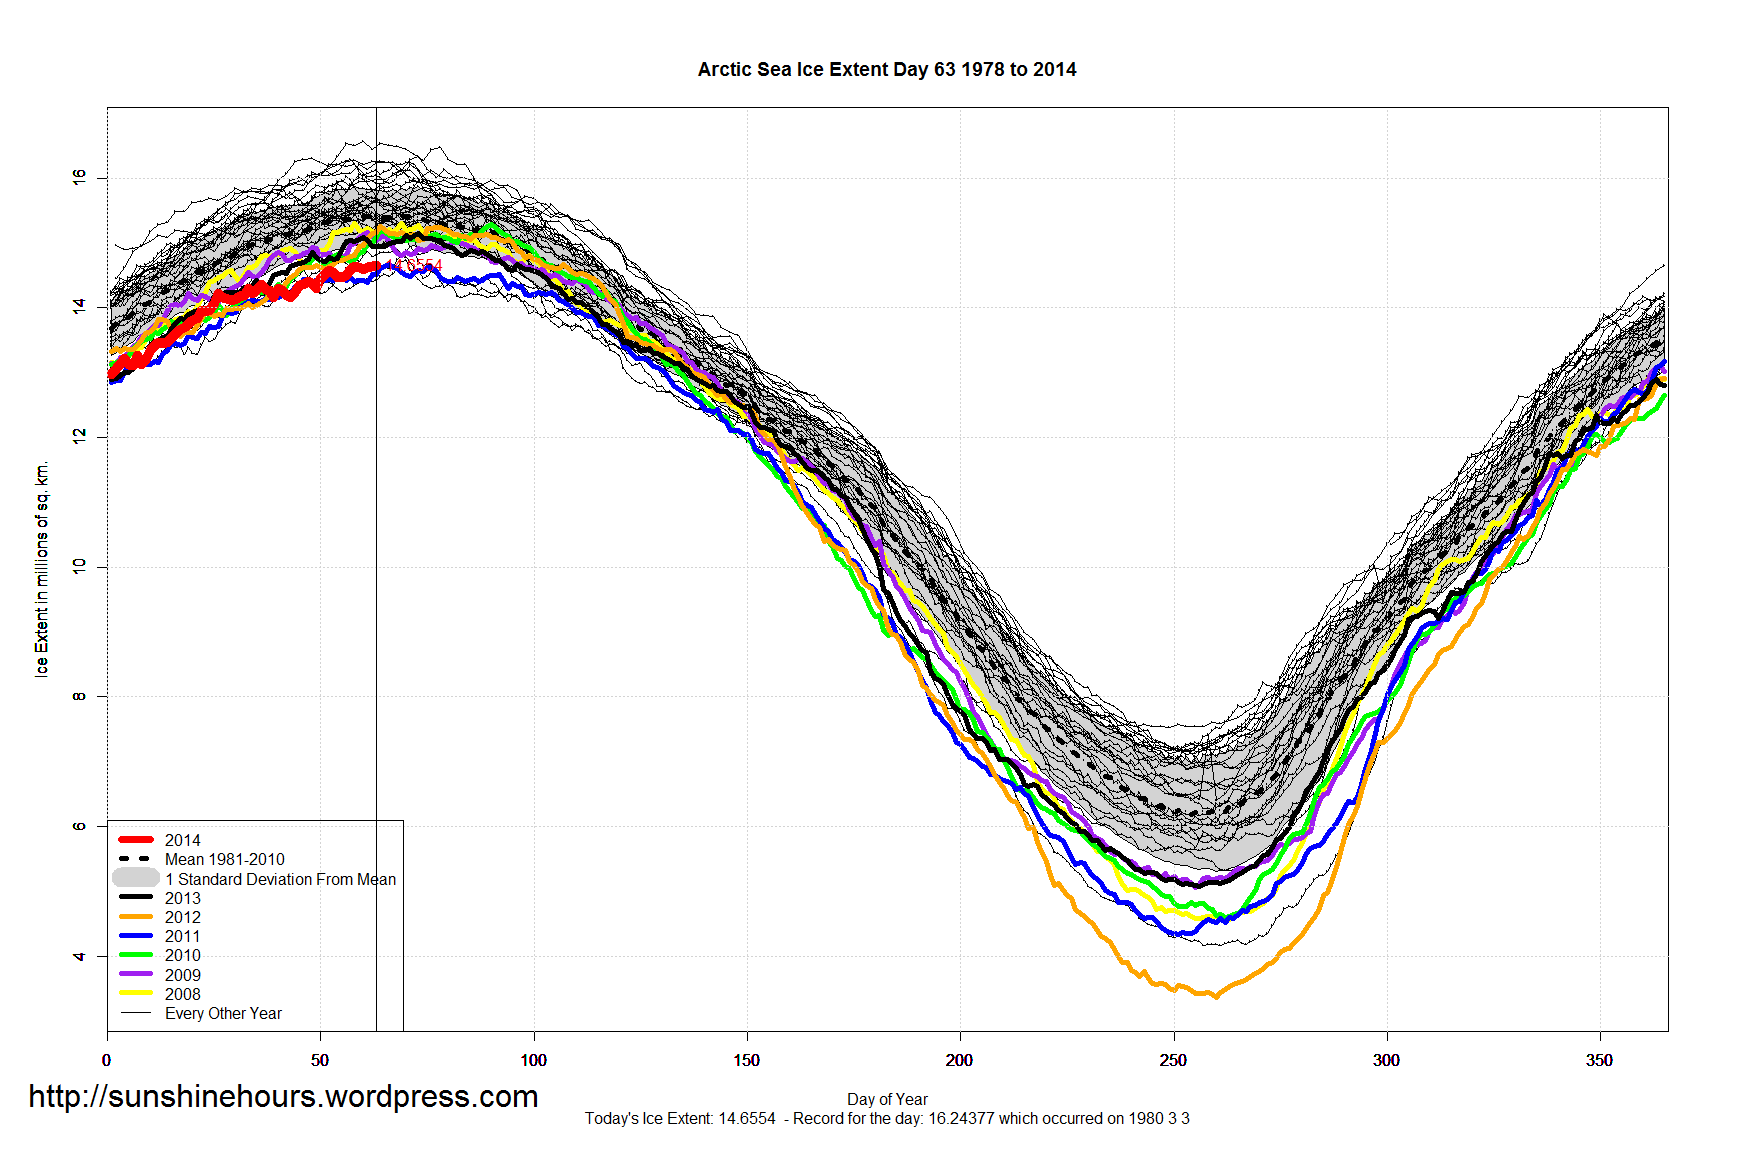
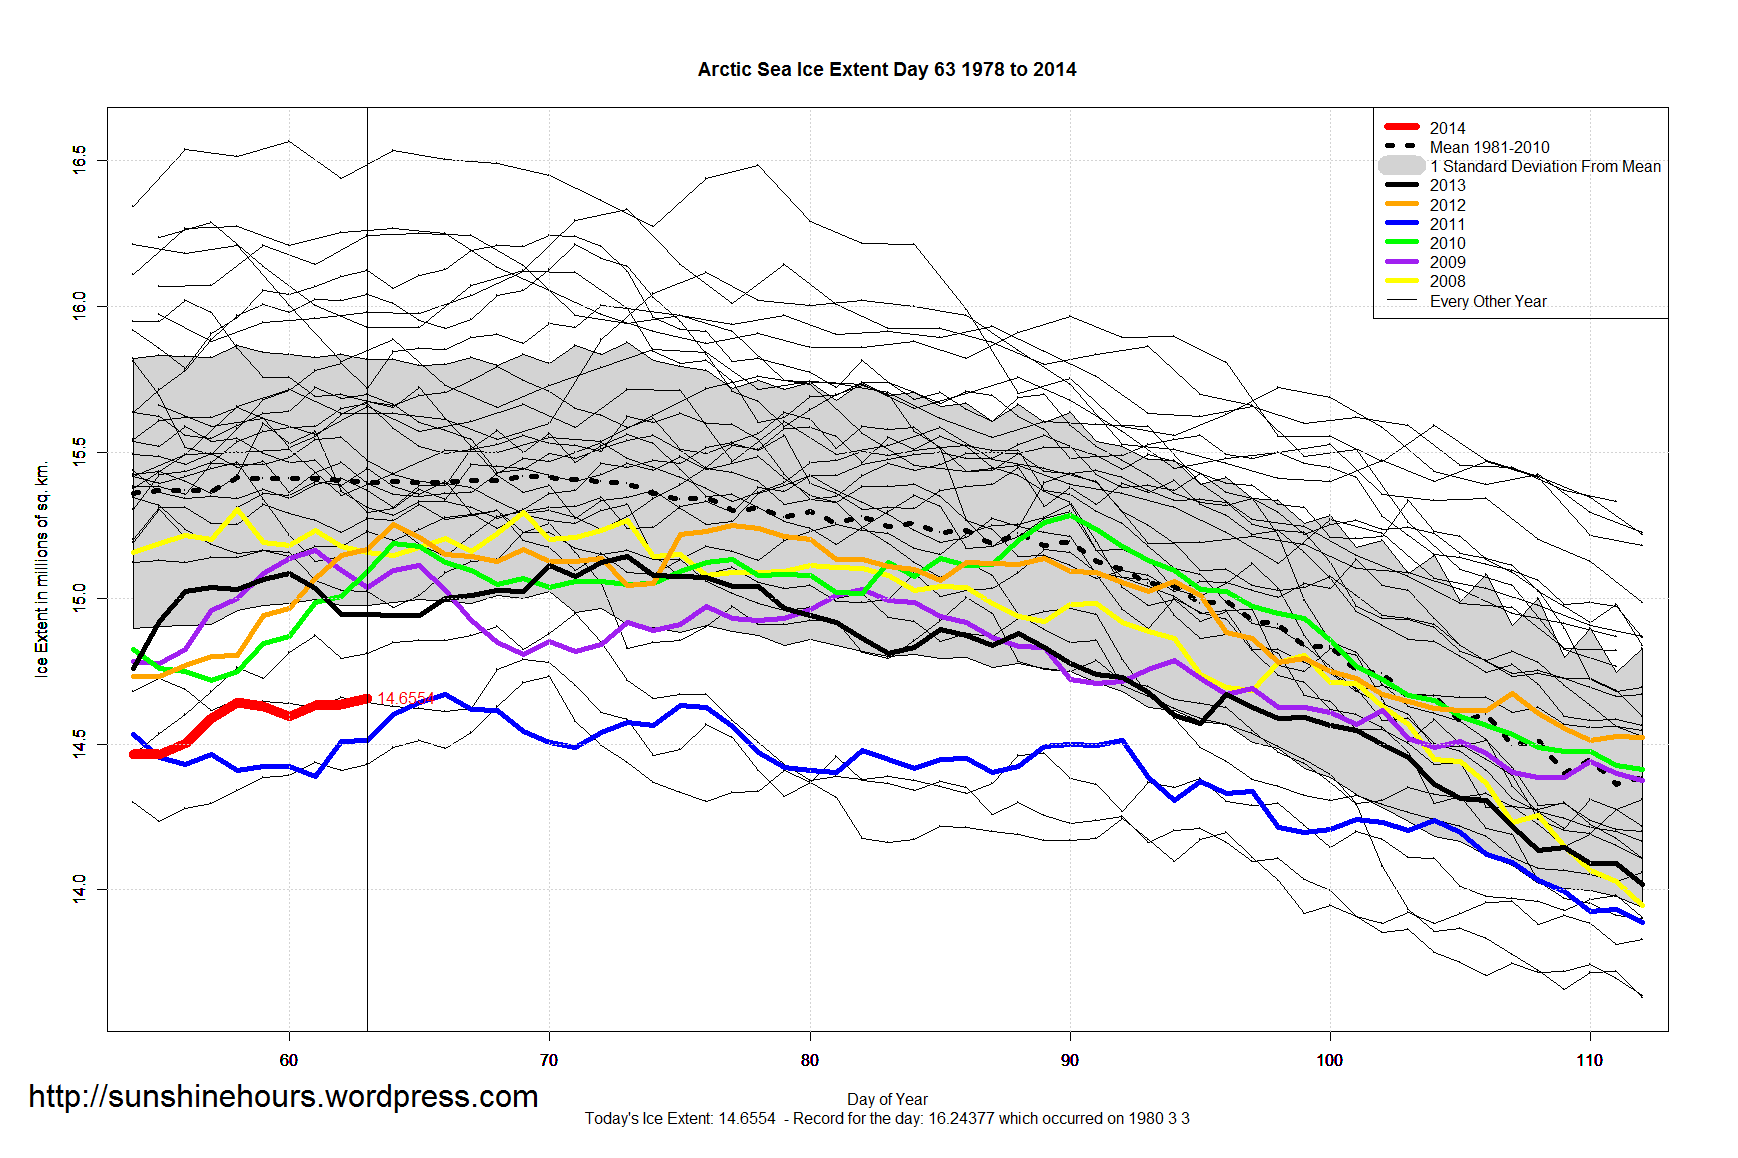
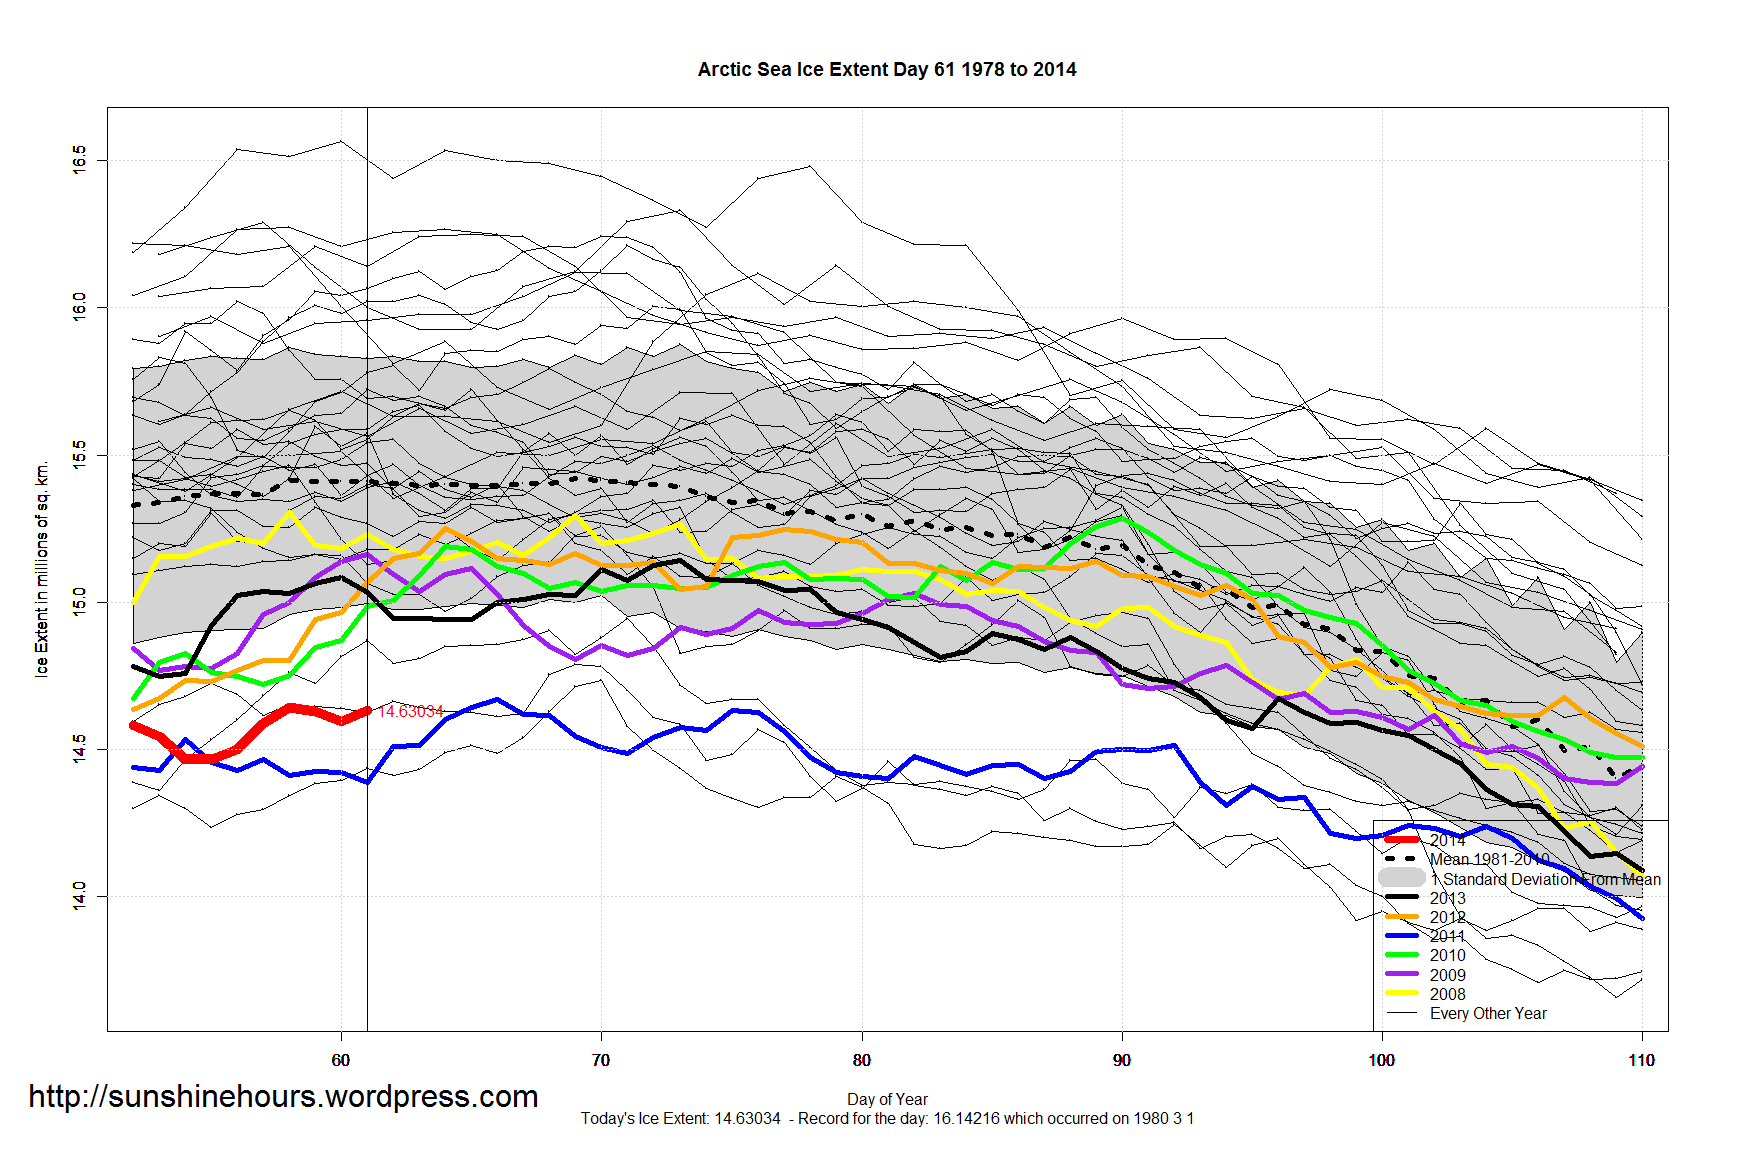
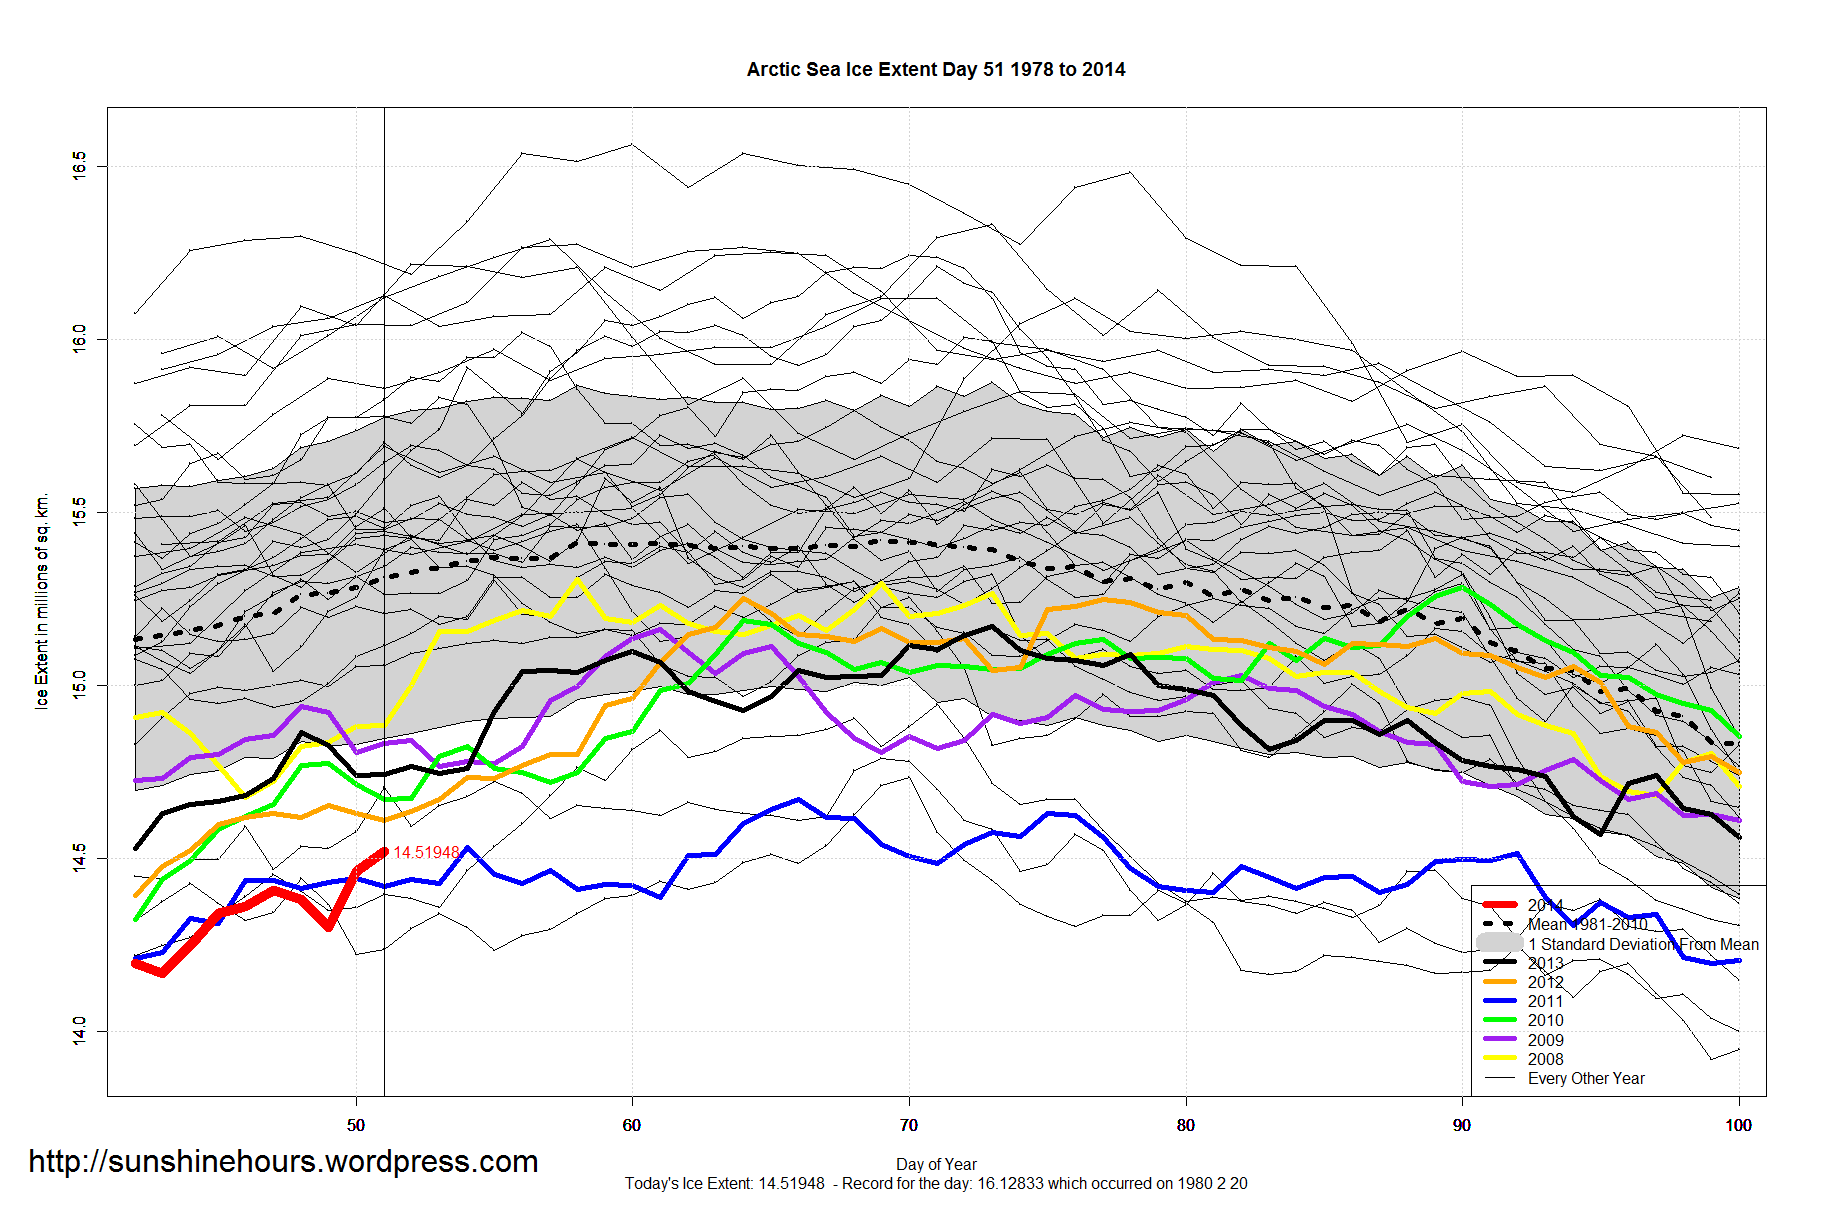
The 3 lowest maximums for Arctic Sea Ice are:
2011 14.67084 million sq km
2006 14.73298
2007 14.78963
On March 6 the the Extent was 14.75613, which would have made it the 3rd lowest, replacing 2007. Arctic Extent fell to 14.52475 on March 10th. Since then it has rebounded by 335,000 sq km, guaranteeing it won’t go any lower than 4th lowest maximum. Of course it could keep climbing. It may even get within one standard deviation again.
It is only day 72 in the Arctic. The latest maximum was day 90 in 2010. The earliest maximum was on day 52 in 1987 which was the 6th highest maximum.
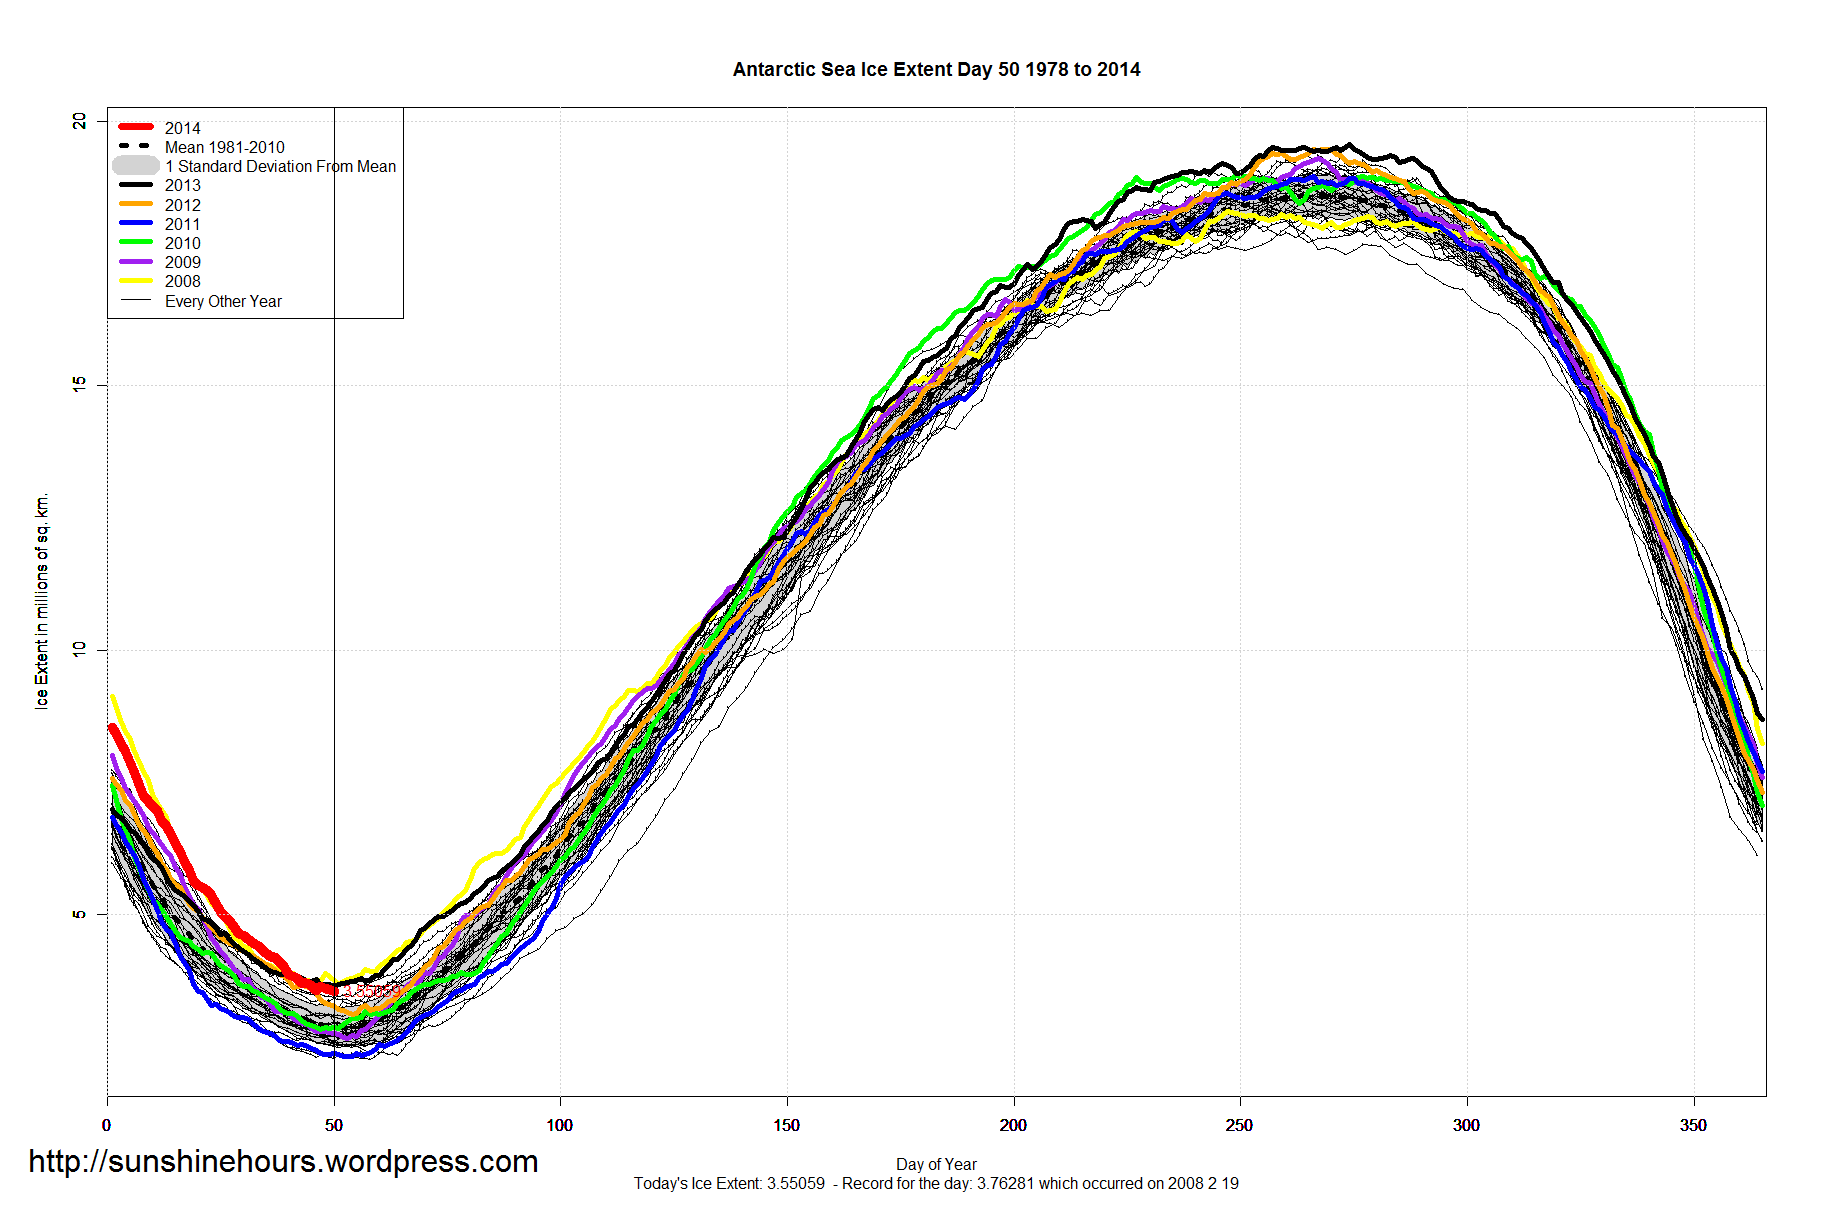
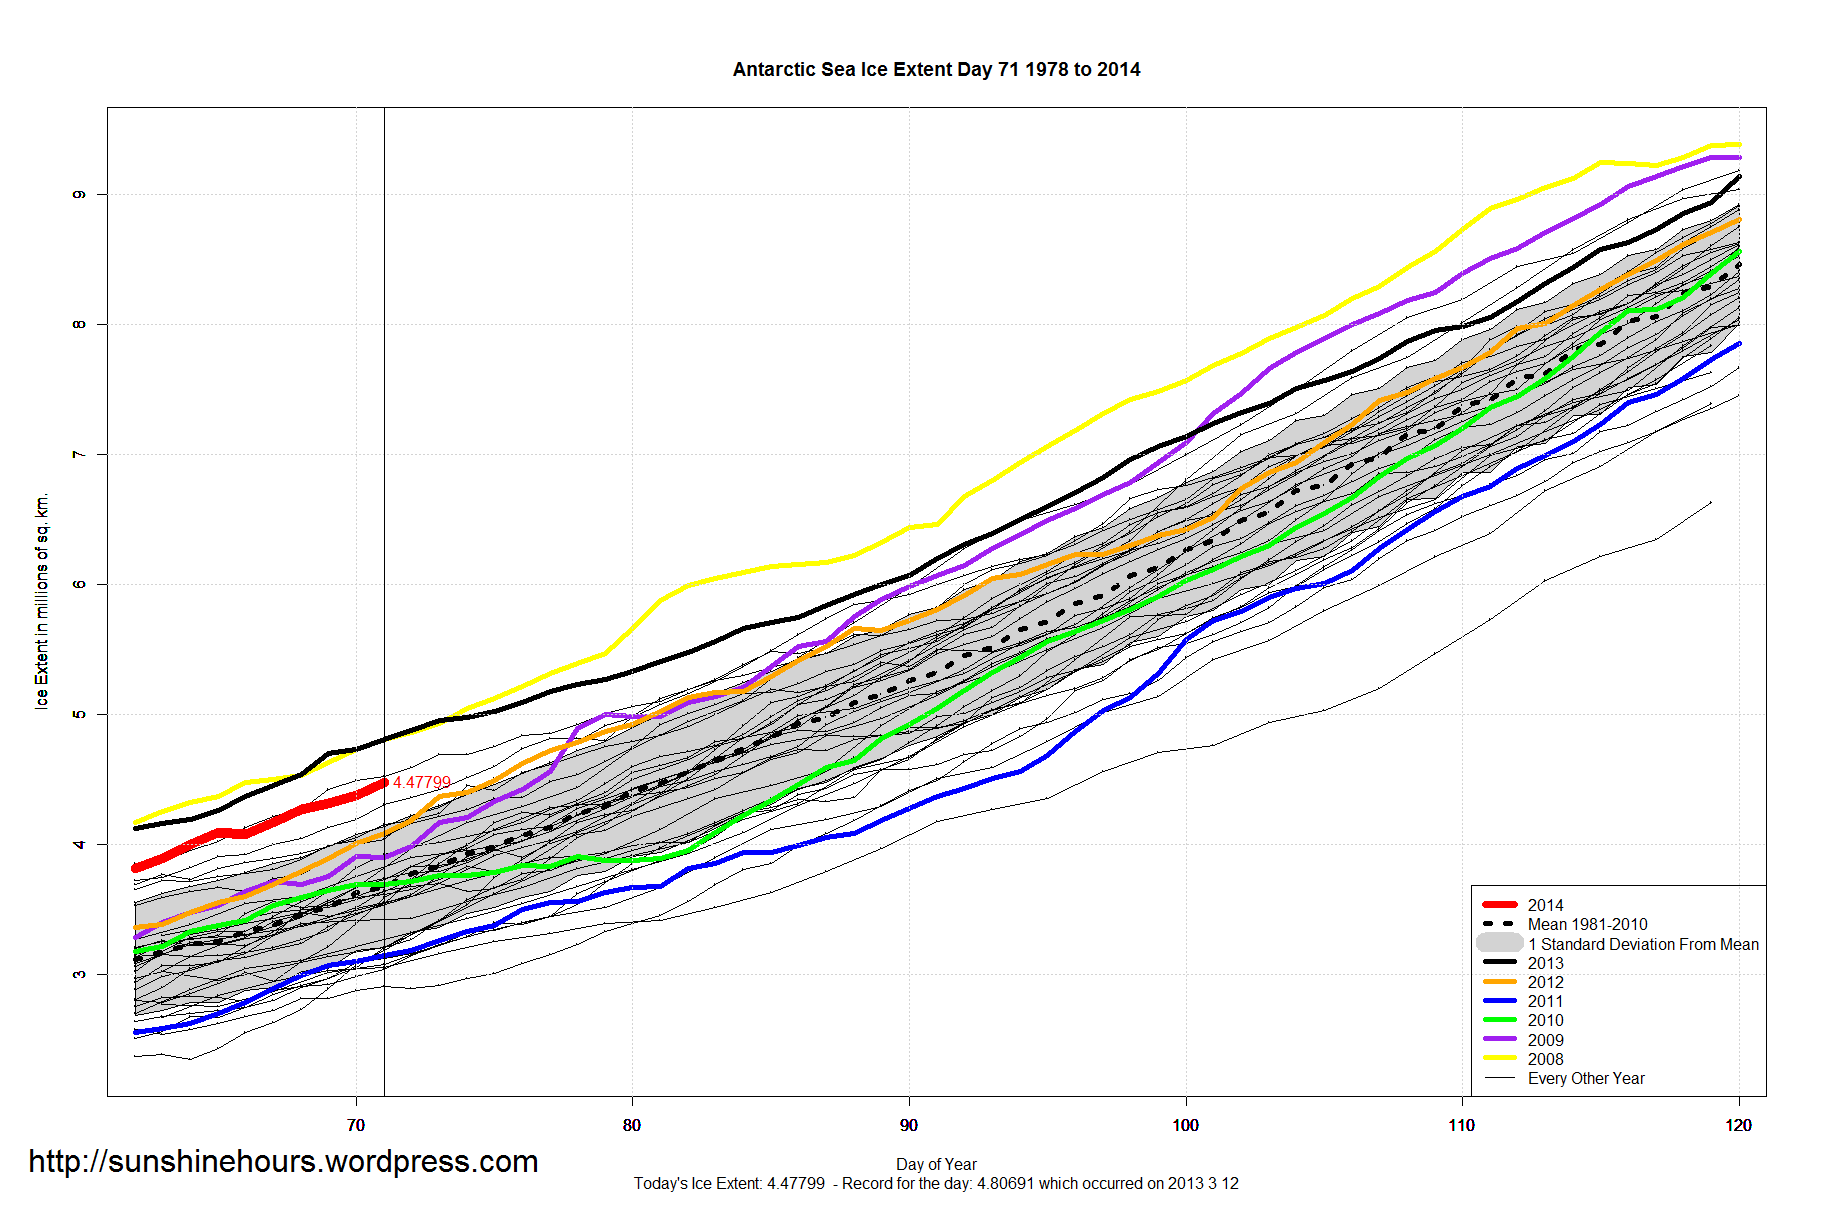
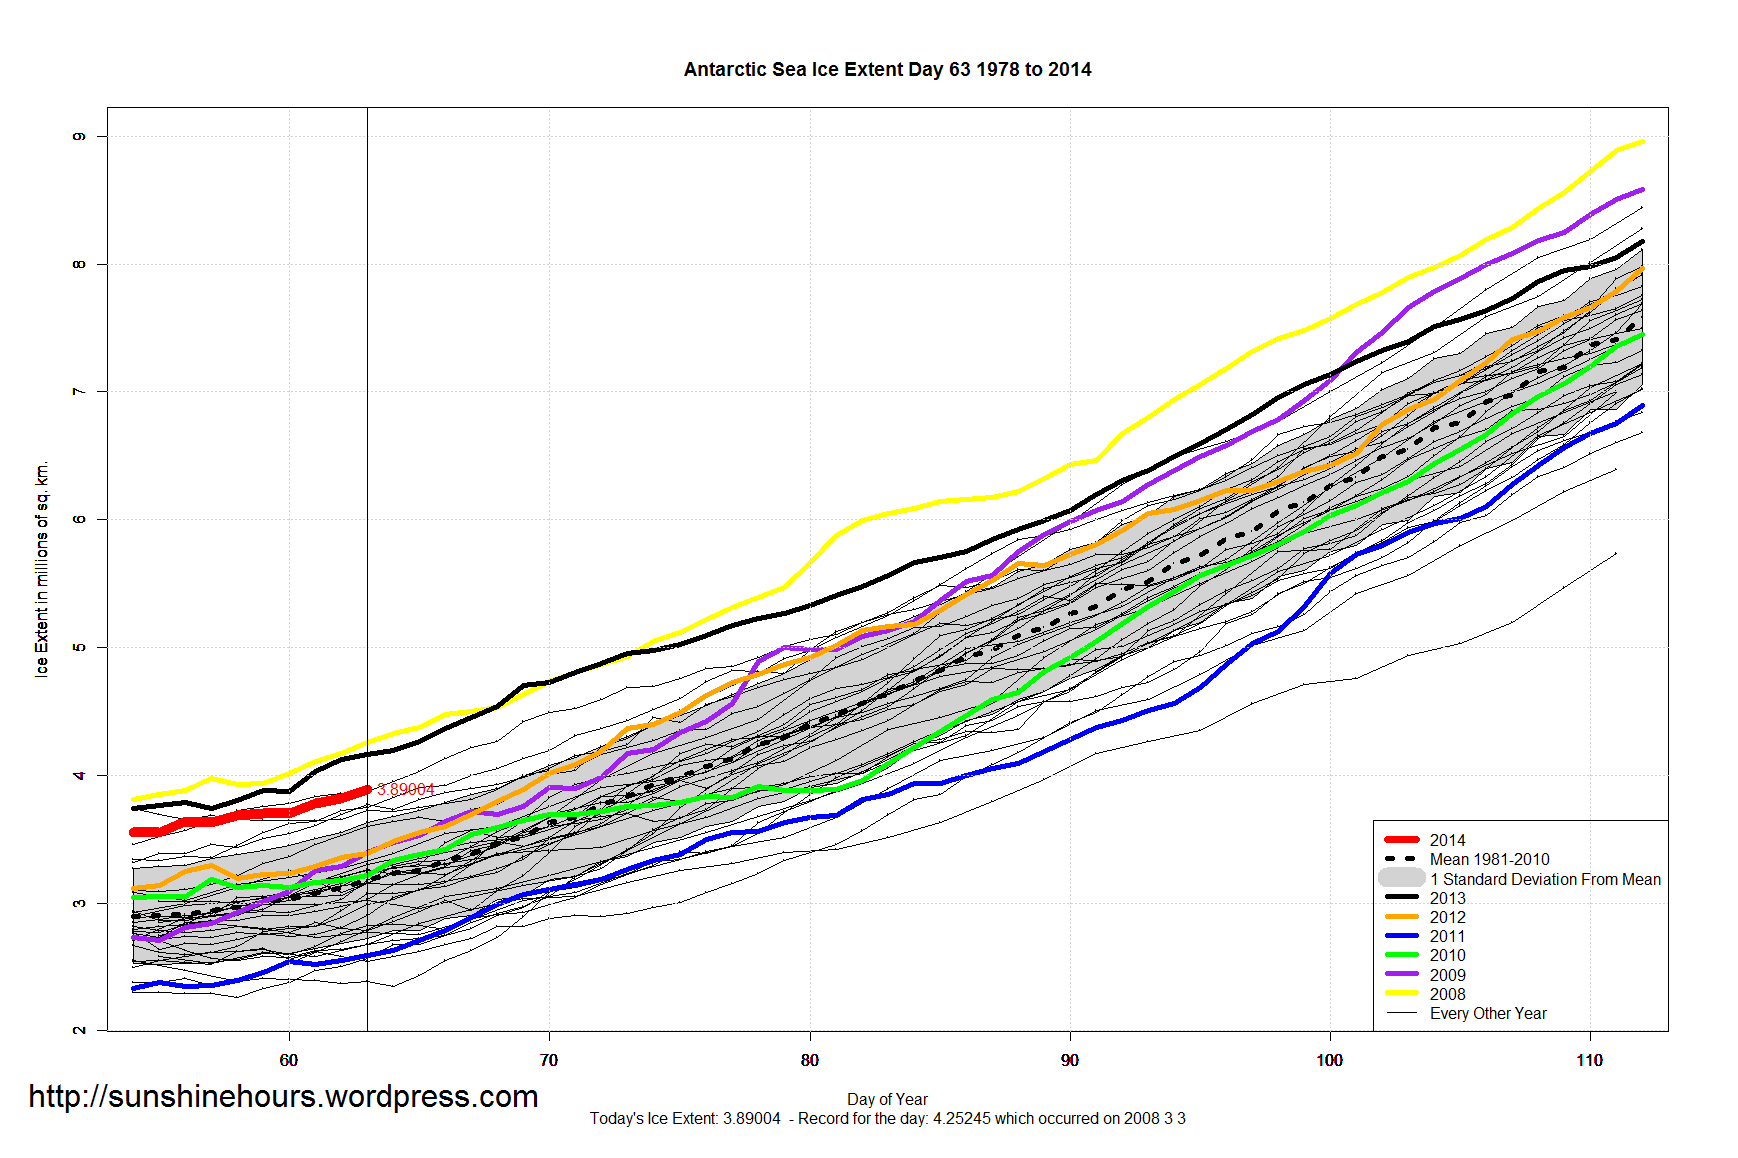
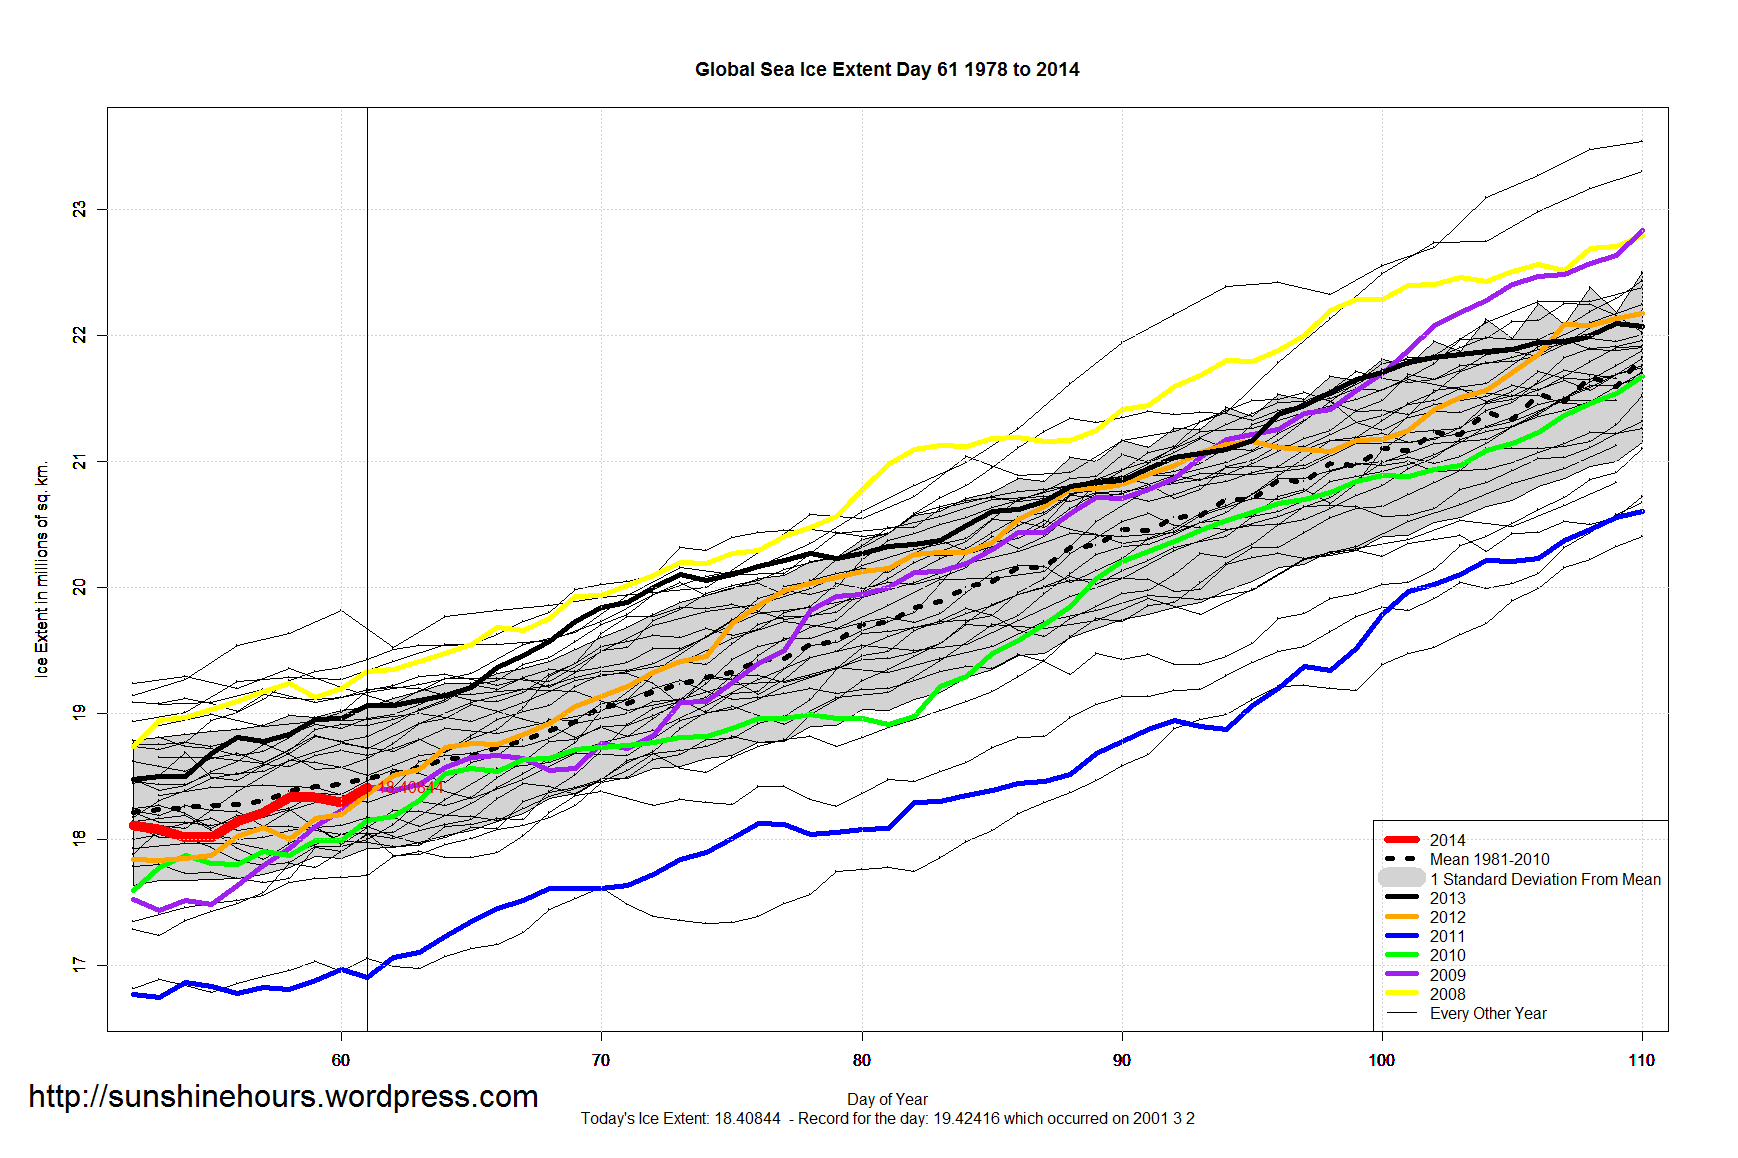
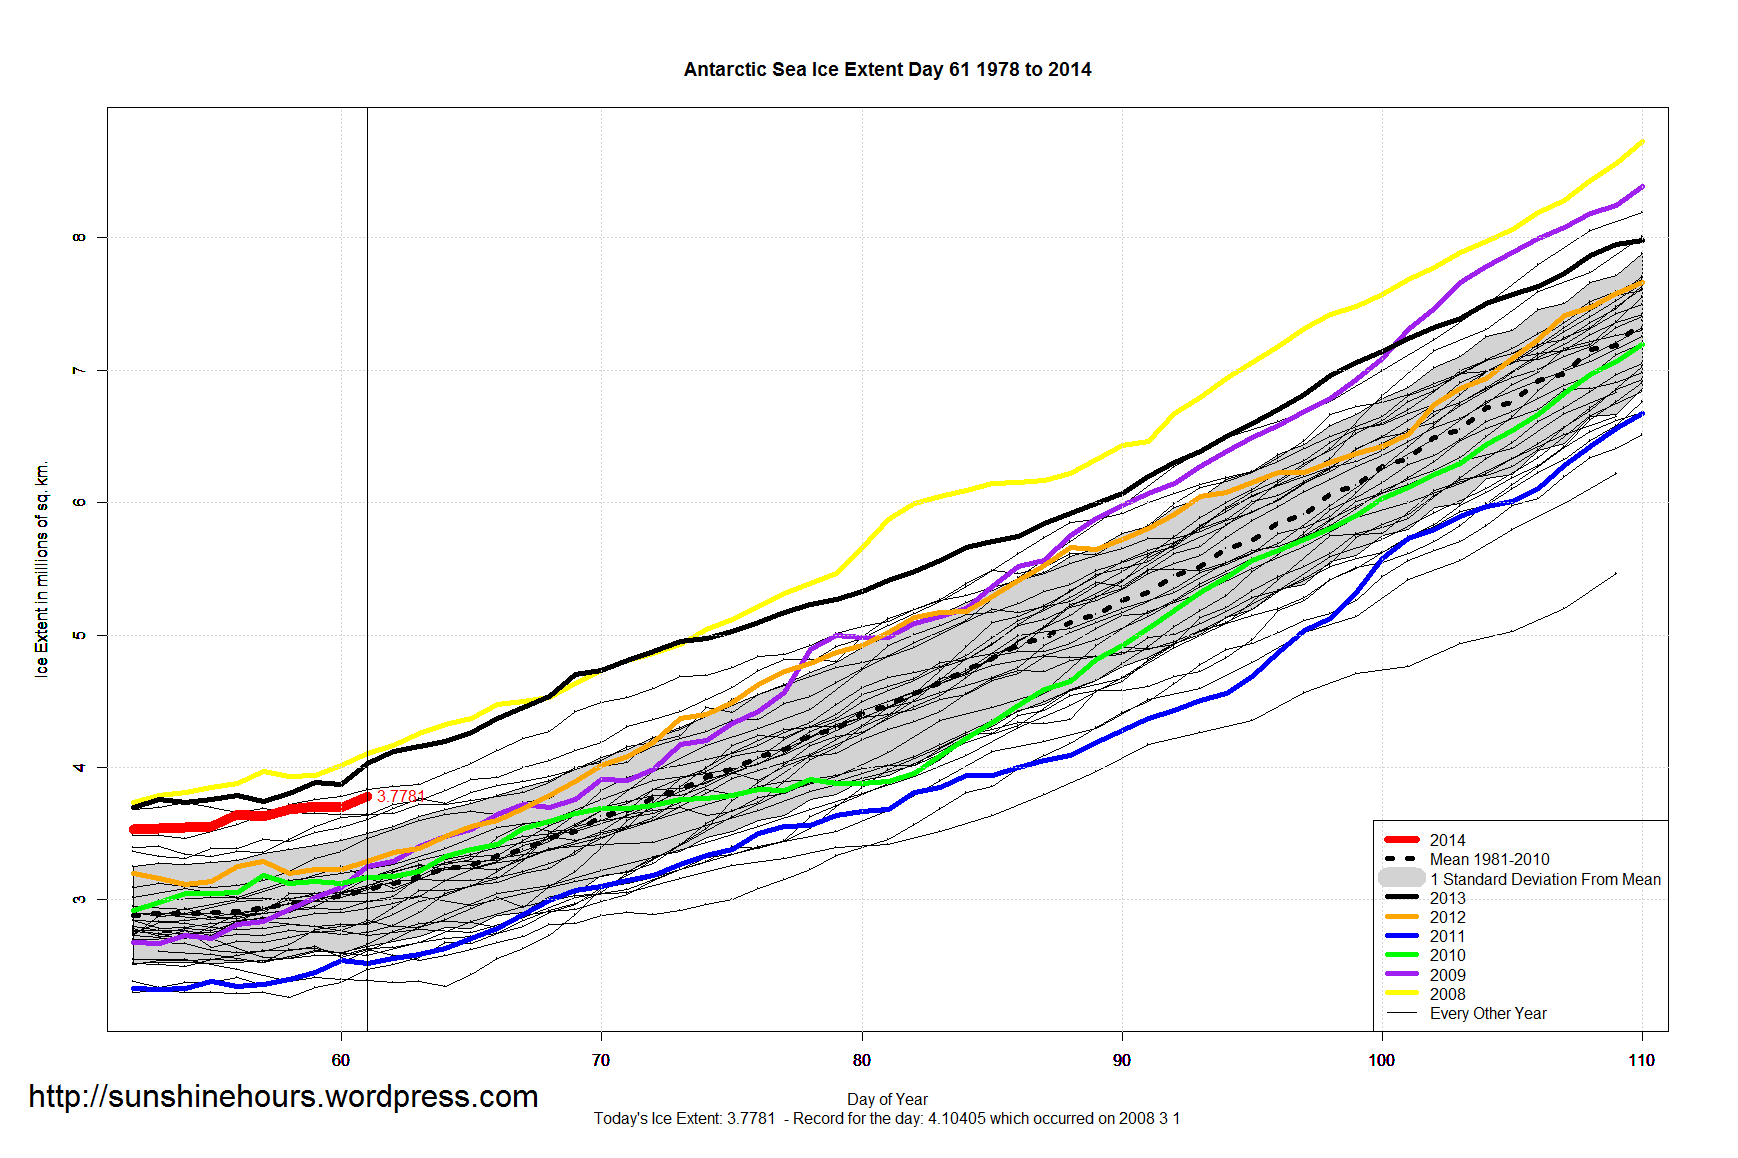
A quick update for sea ice extent:
Data here. Graphs below. Click for bigger.
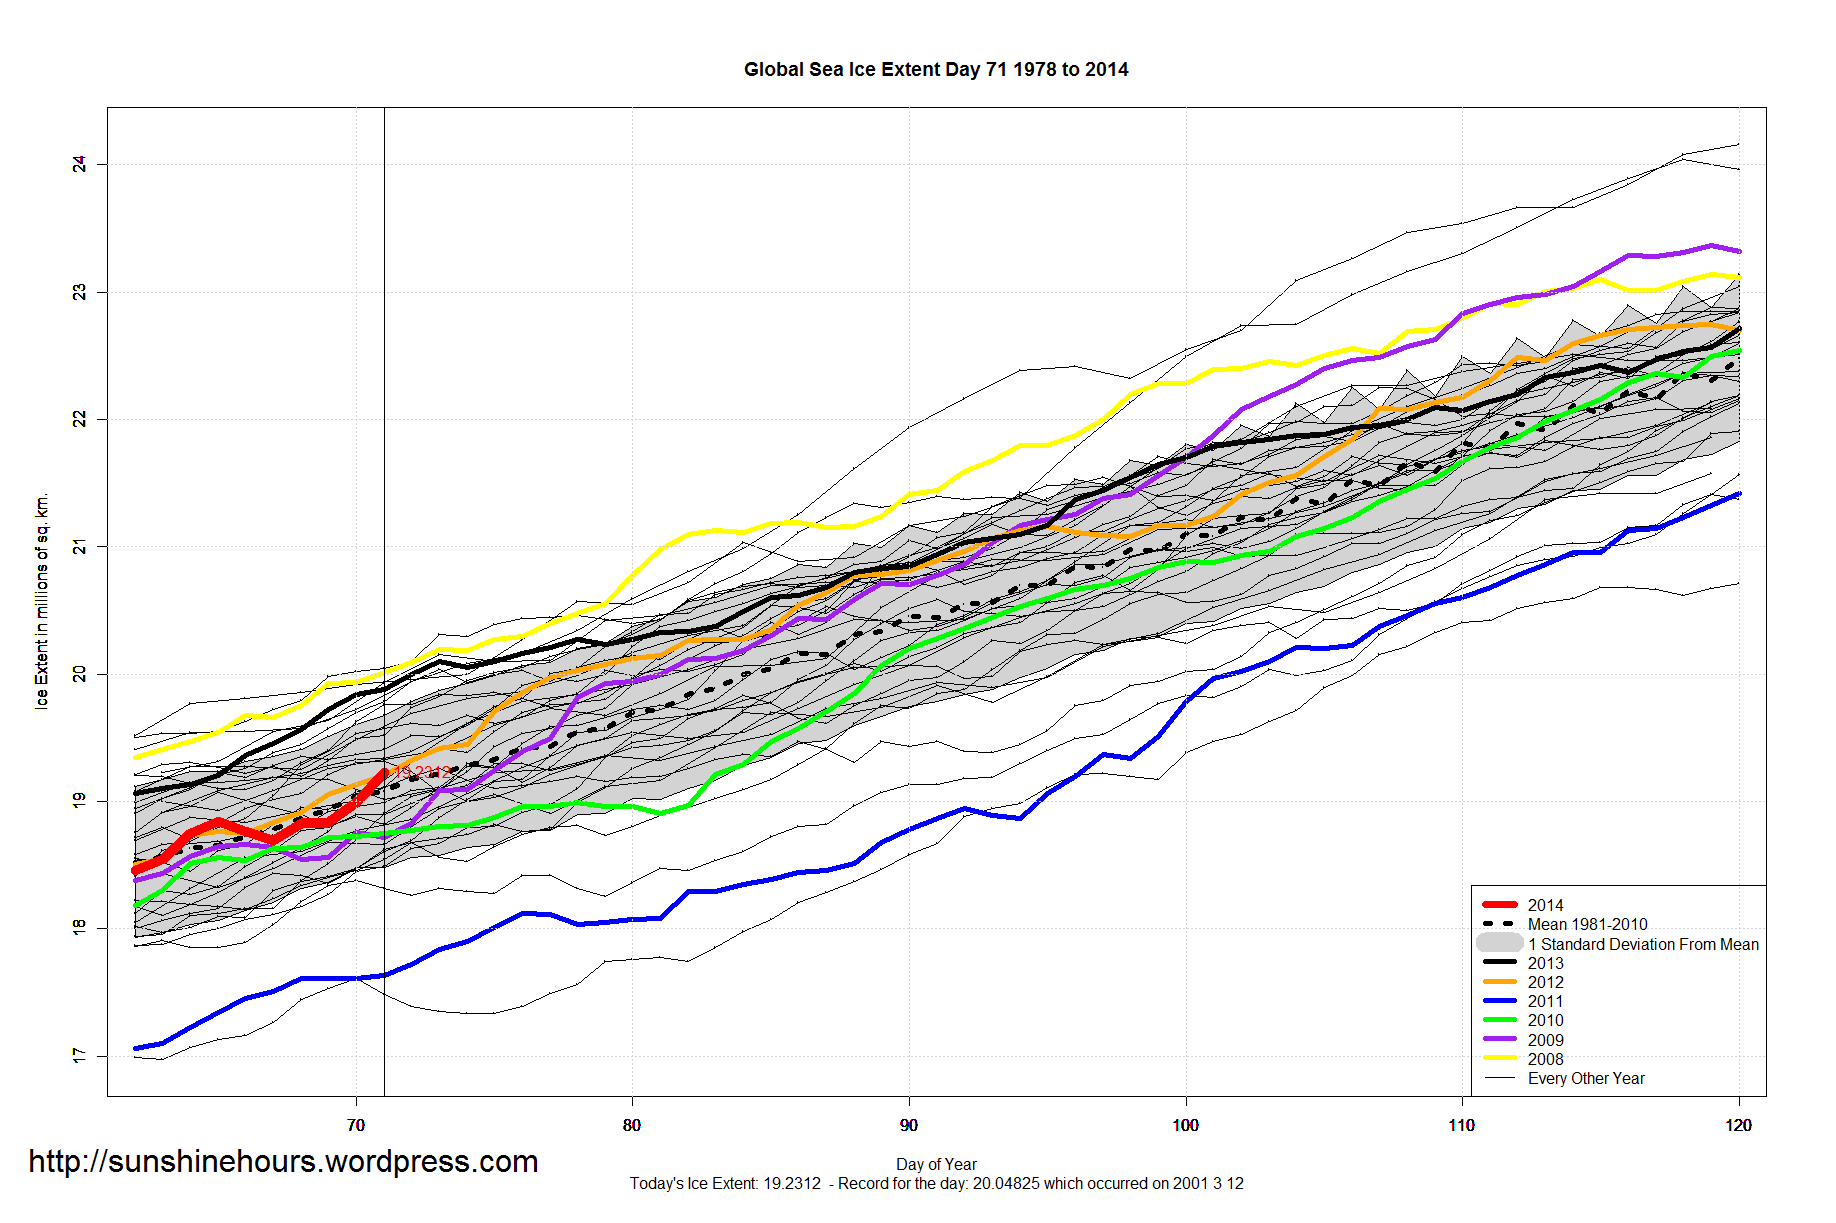
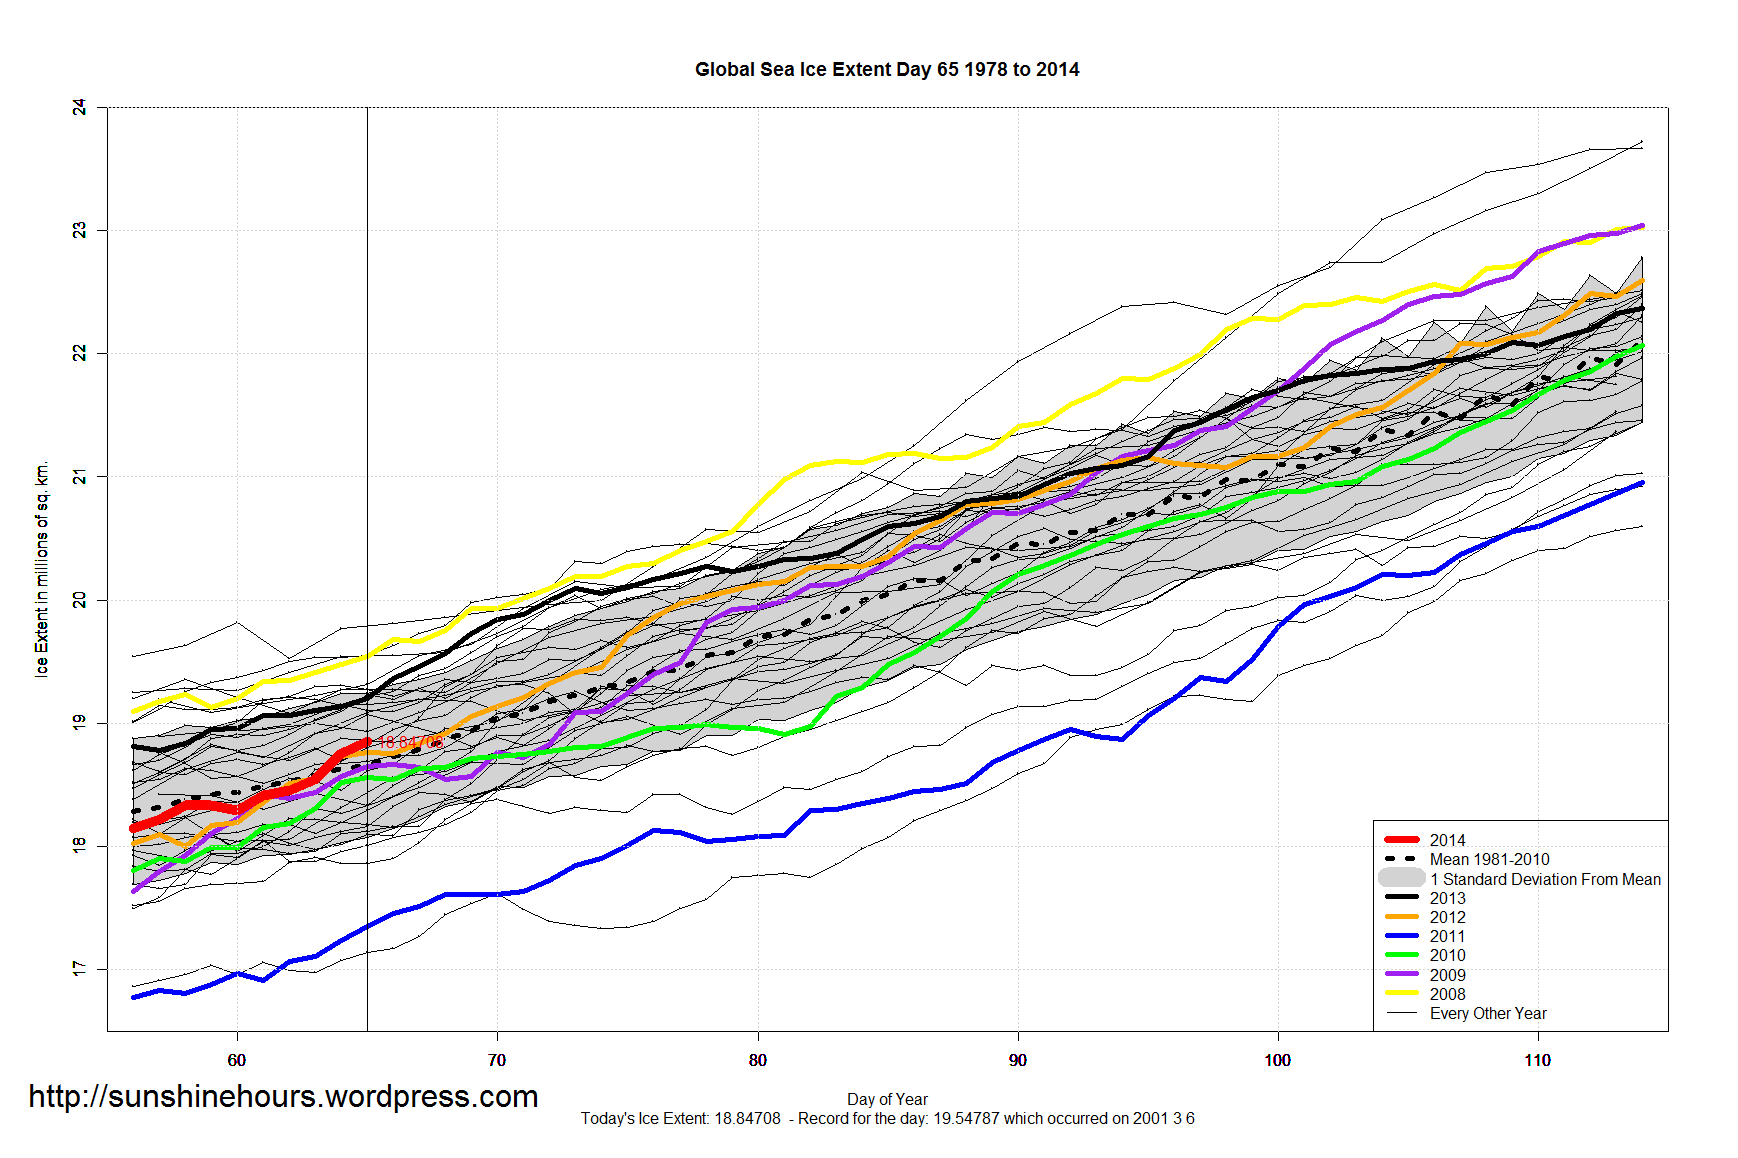
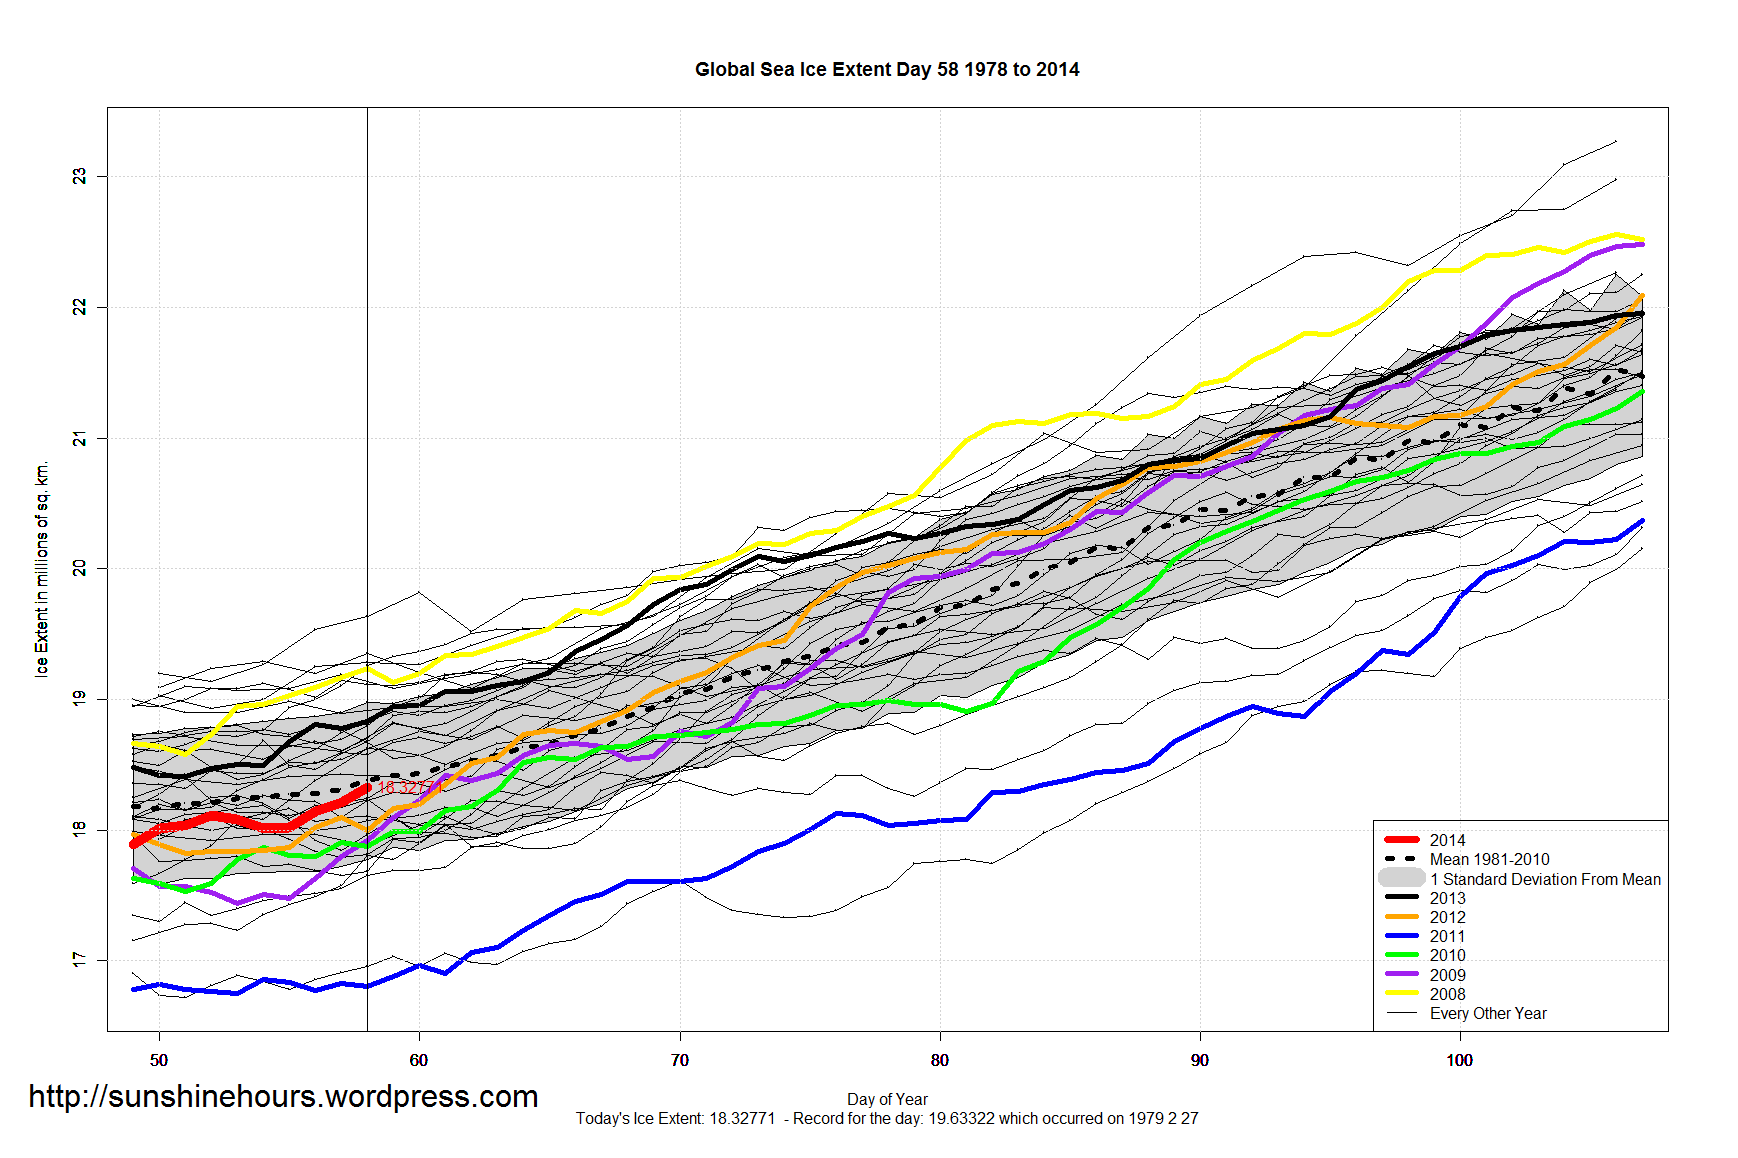
A quick update for sea ice extent:
Data here. Graphs below. Click for bigger.
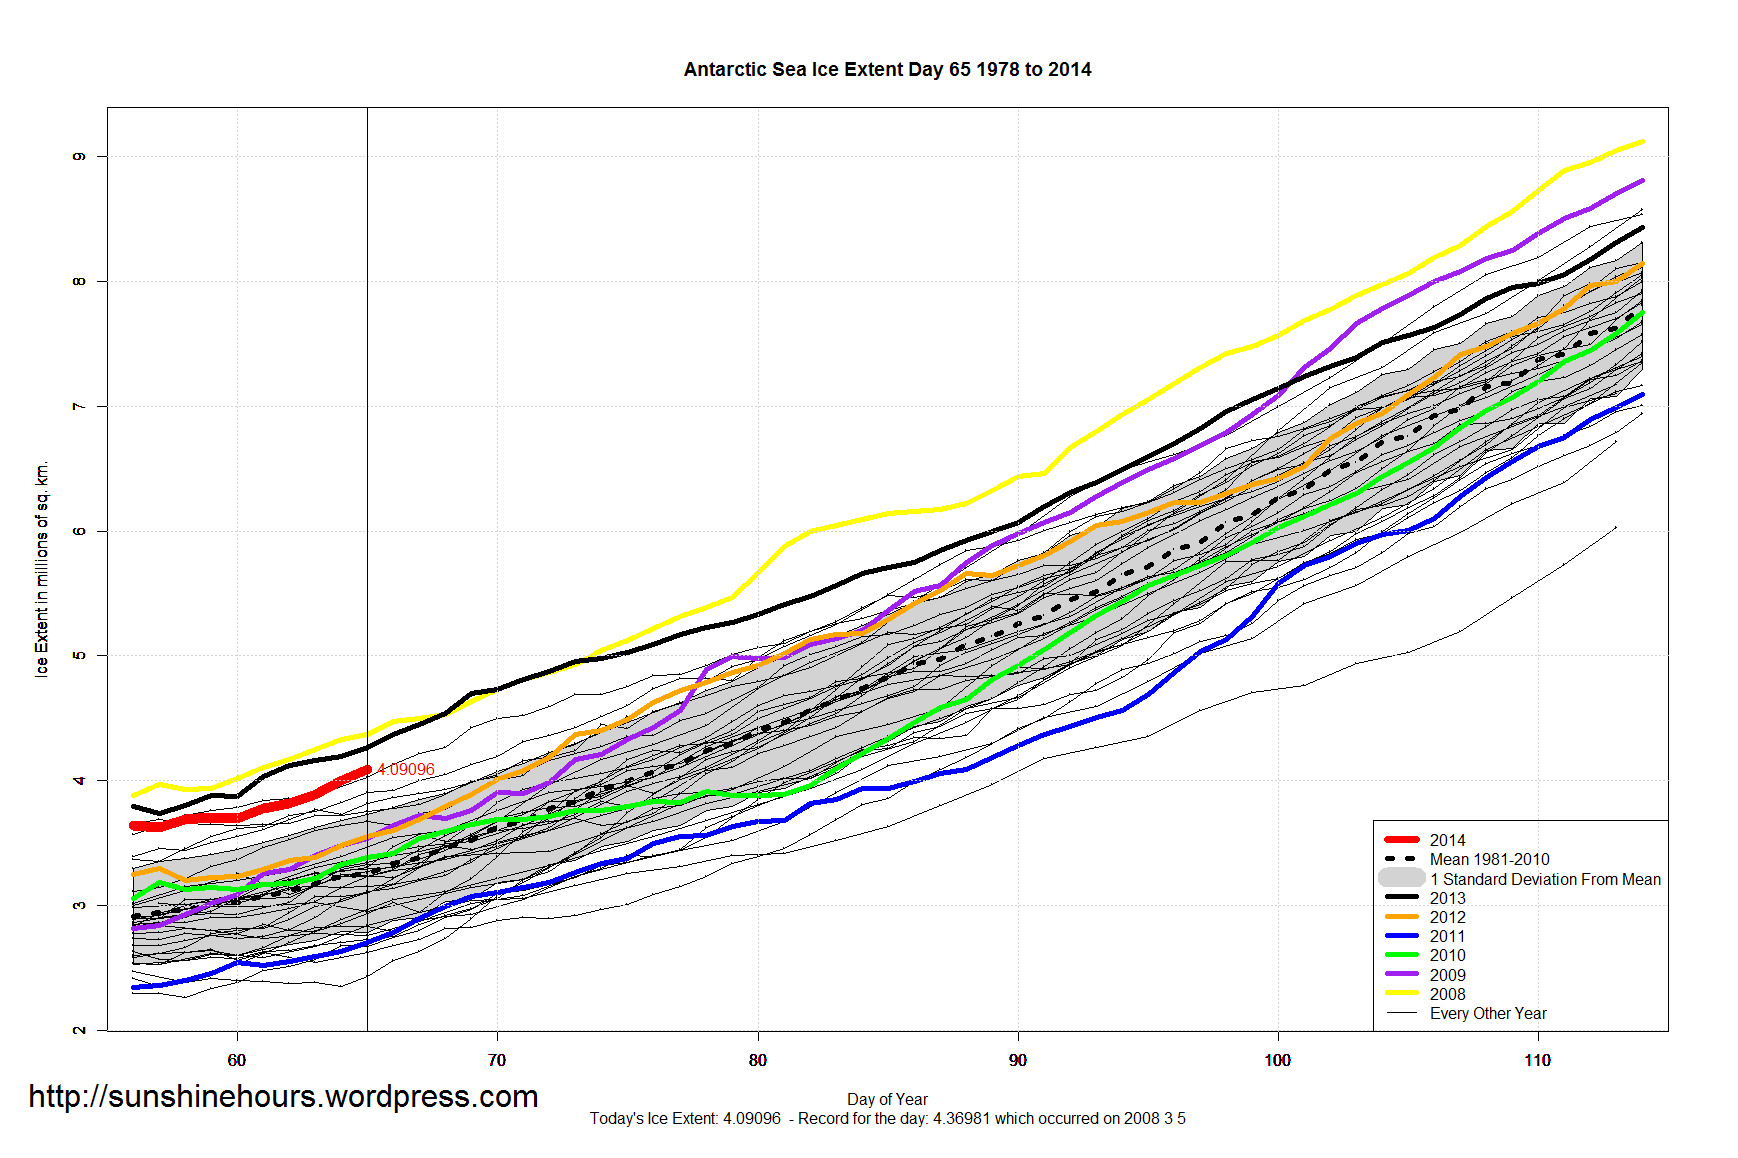
A quick update for sea ice extent:
Data here. Graphs below. Click for bigger.
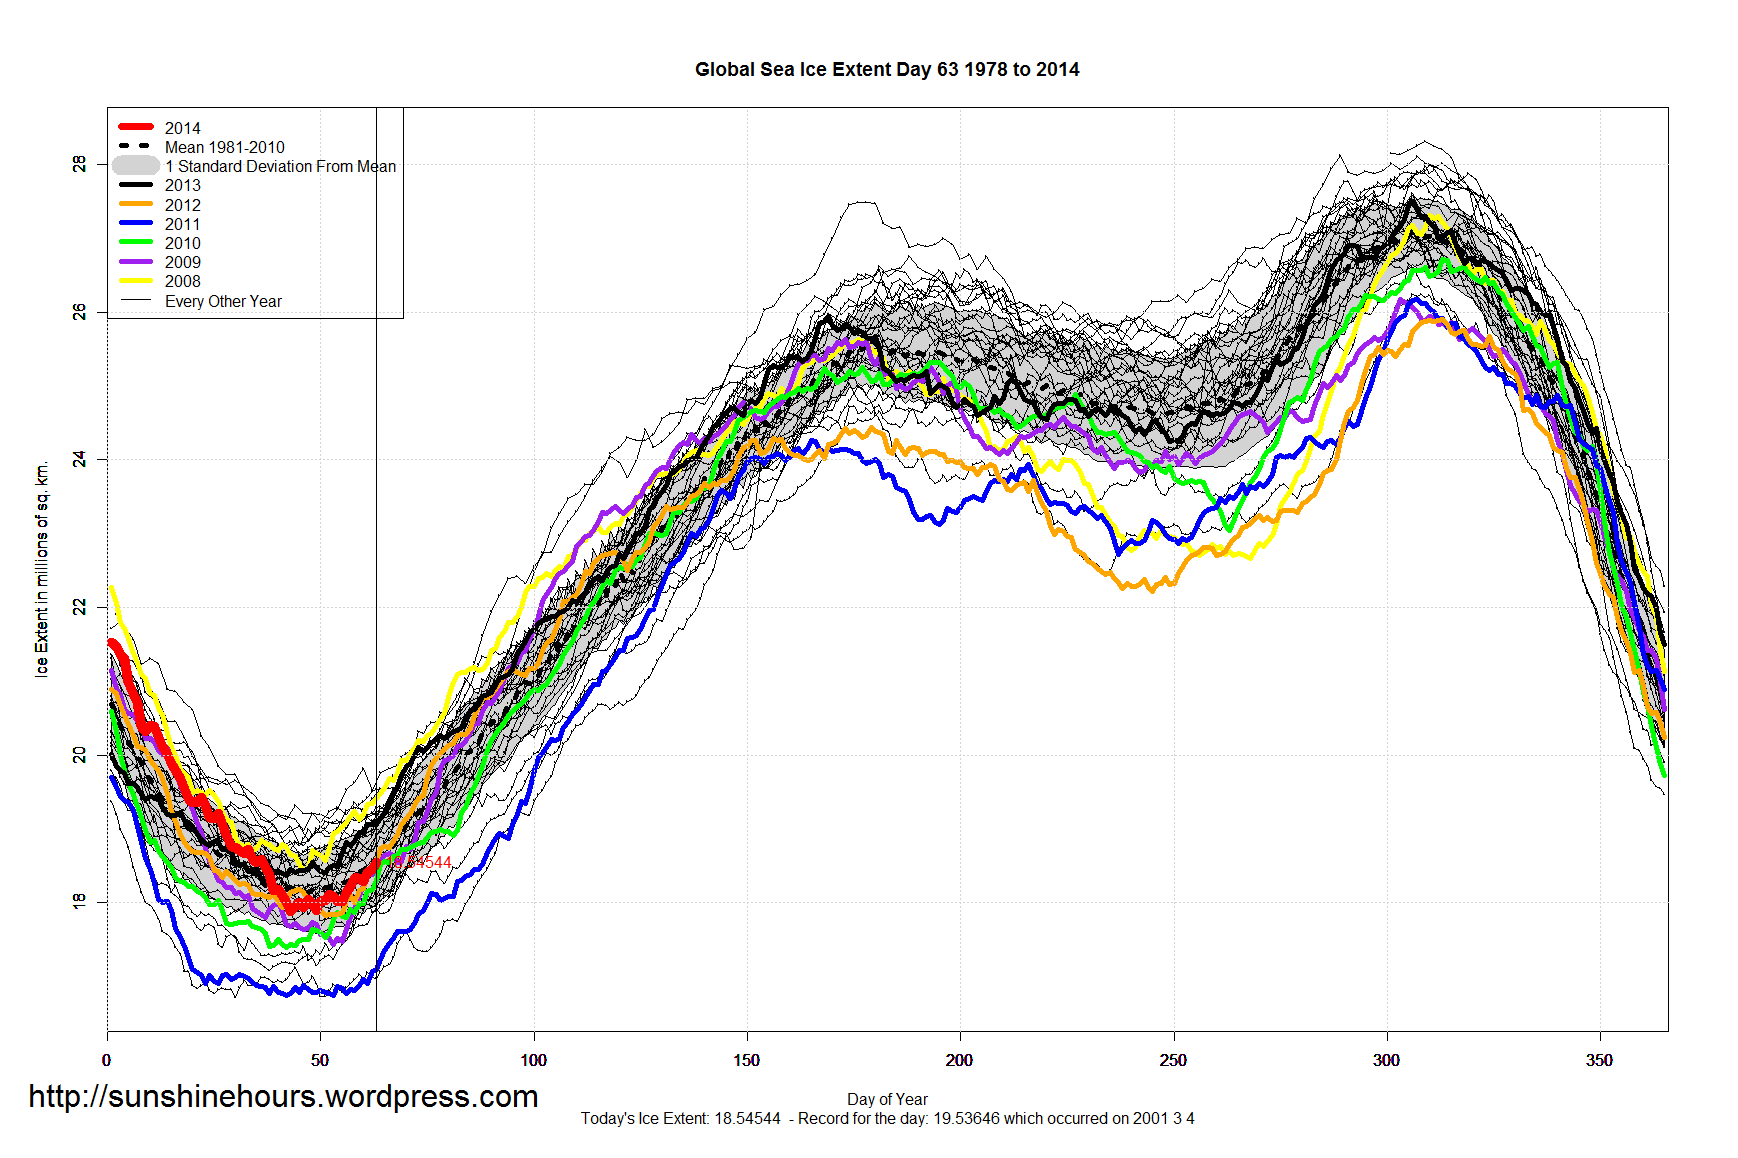
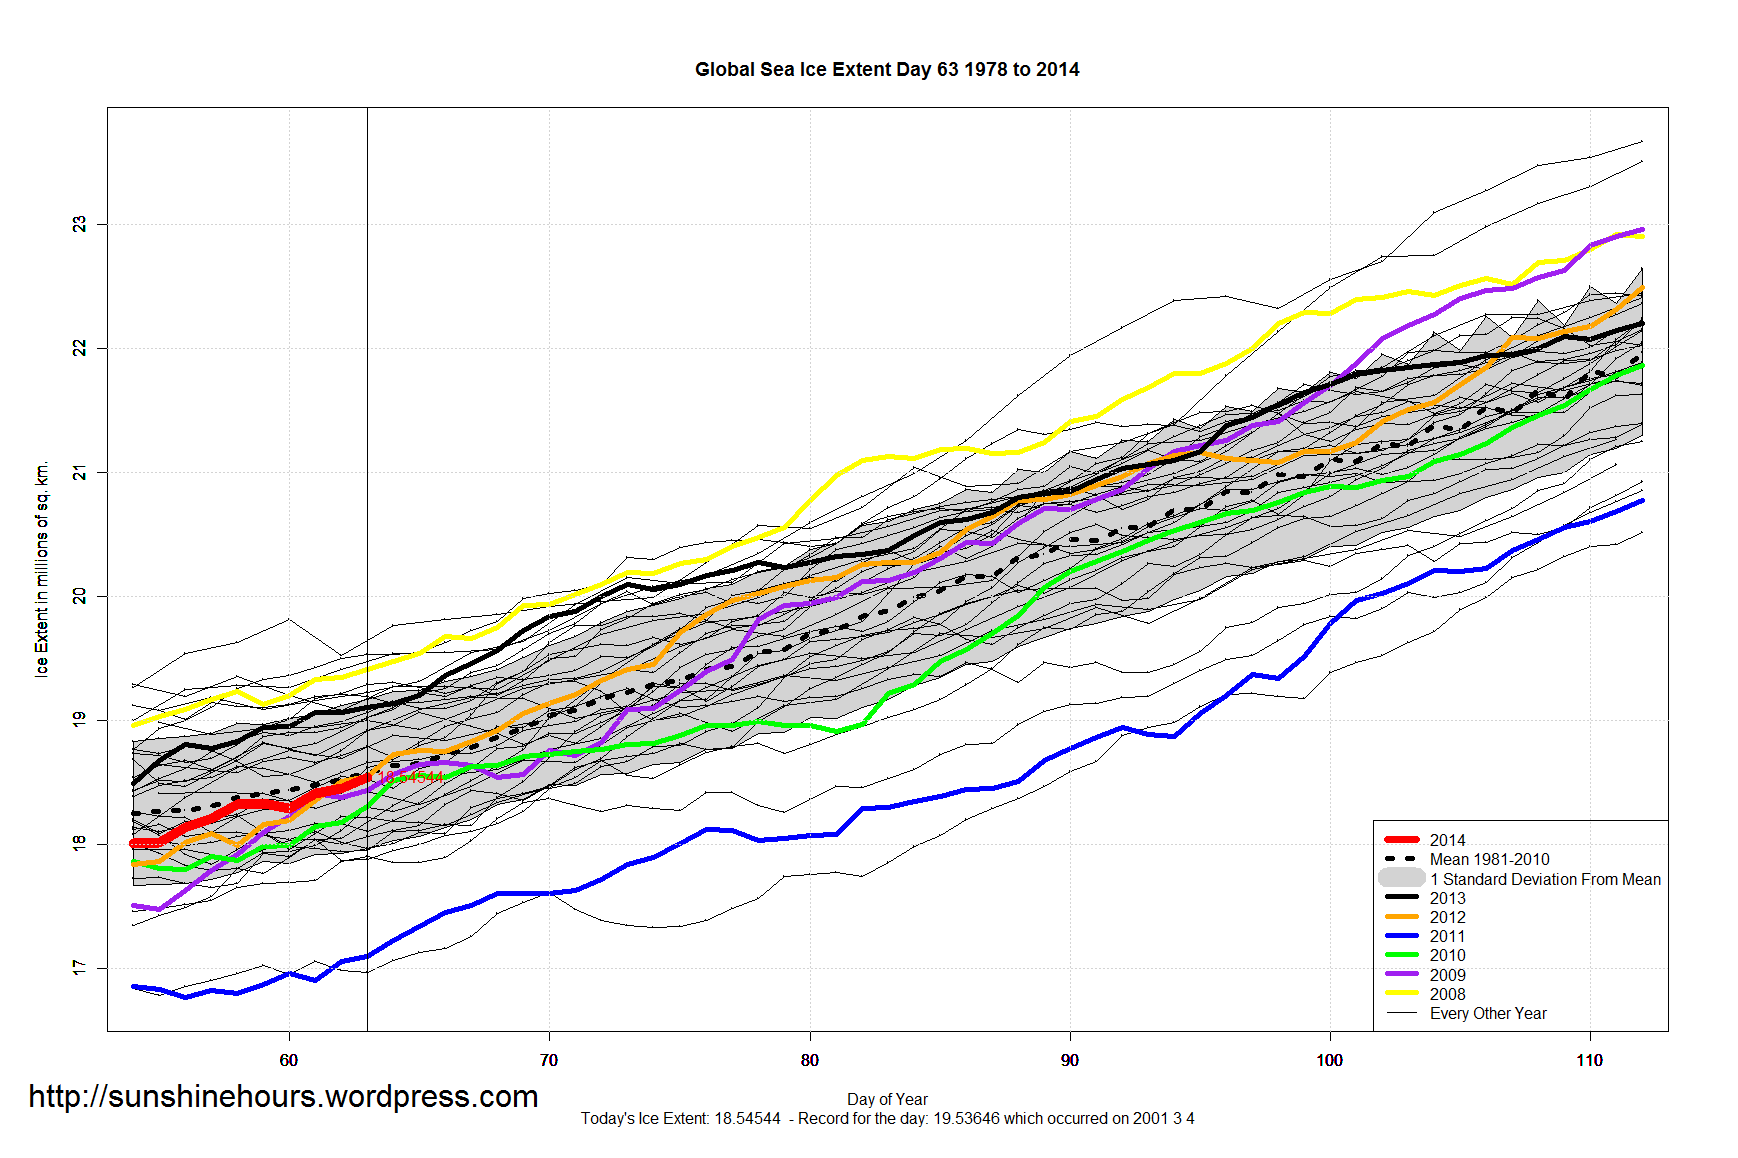
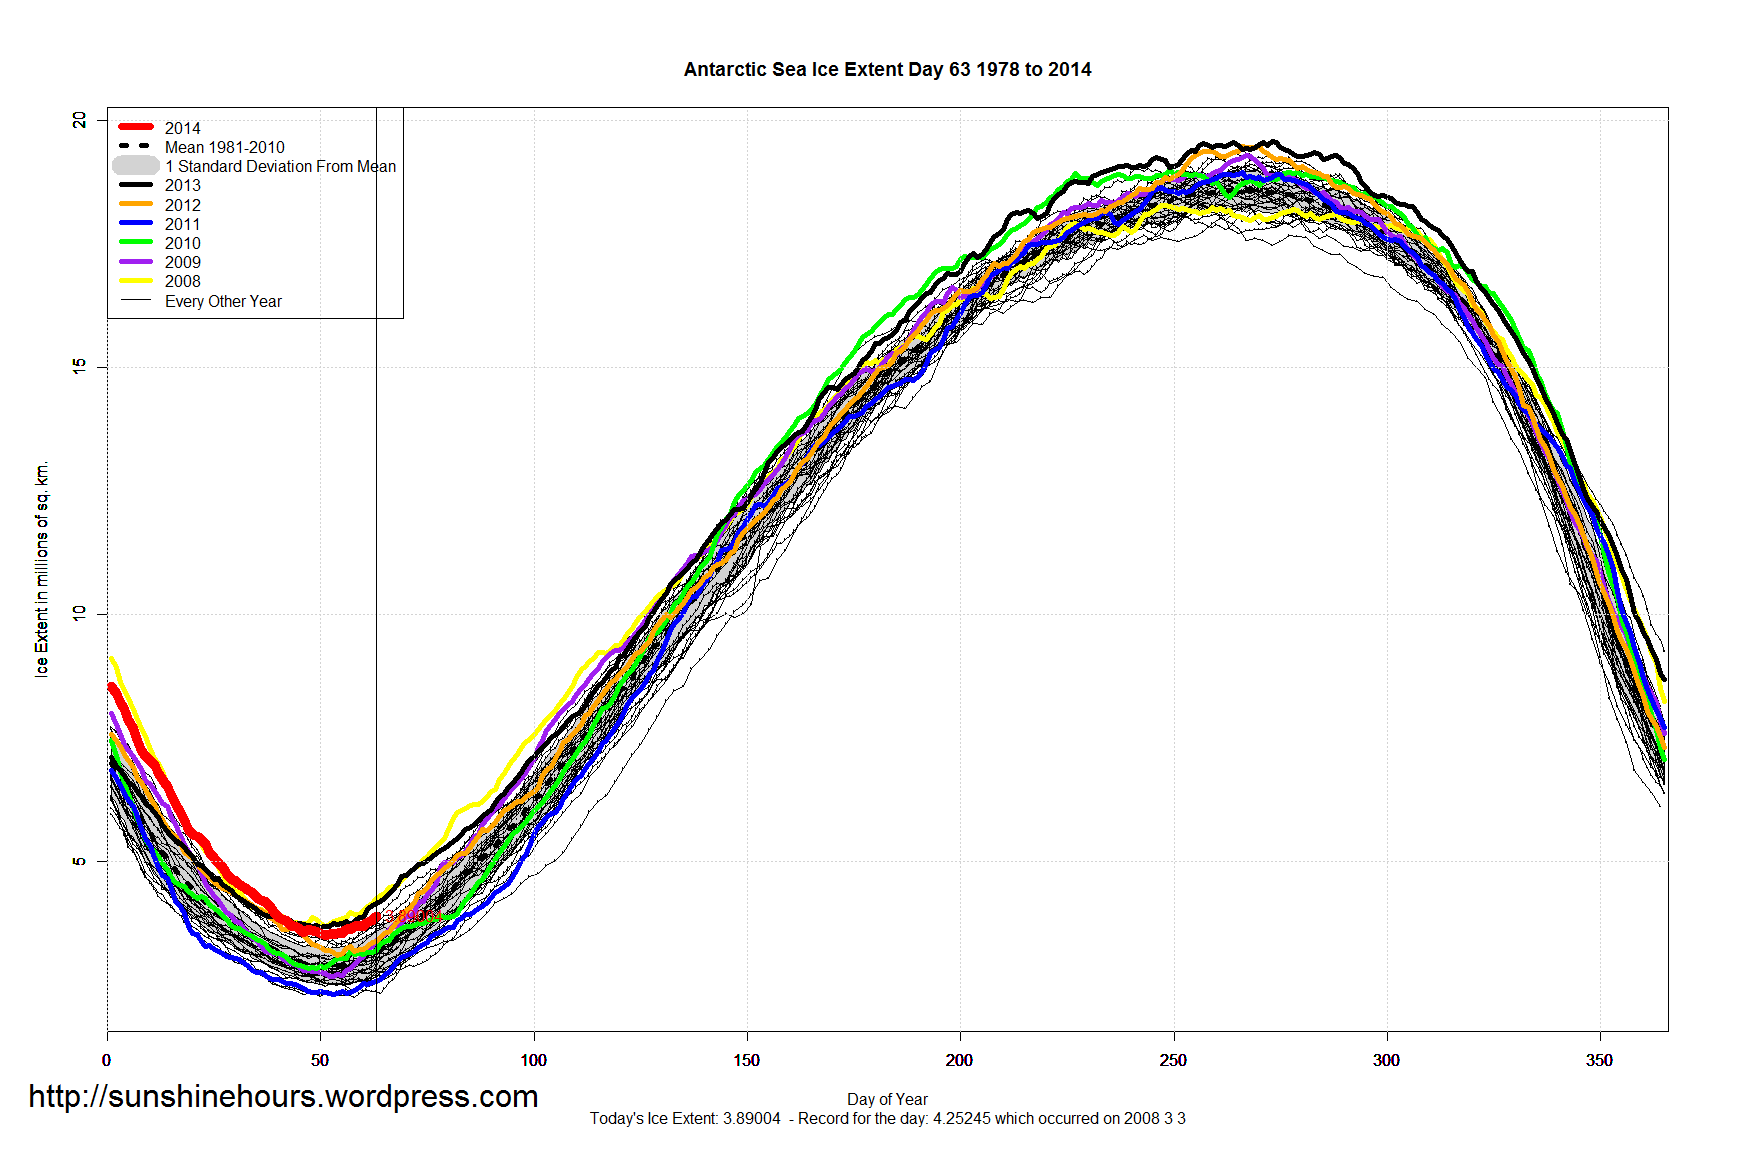
A quick update for sea ice extent:
Data here. Graphs below. Click for bigger.
A quick update for sea ice extent:
Data here. Graphs below. Click for bigger.


A quick update for sea ice extent:
Data here. Graphs below. Click for bigger.


DMI says it is getting colder in the Arctic. 15C colder. Yes, it is still higher than average. (Green is the mean)
A few days ago the Arctic was lowest for the day. Now it is 4th lowest.
A quick update for sea ice extent:
Data here. Graphs below. Click for bigger.