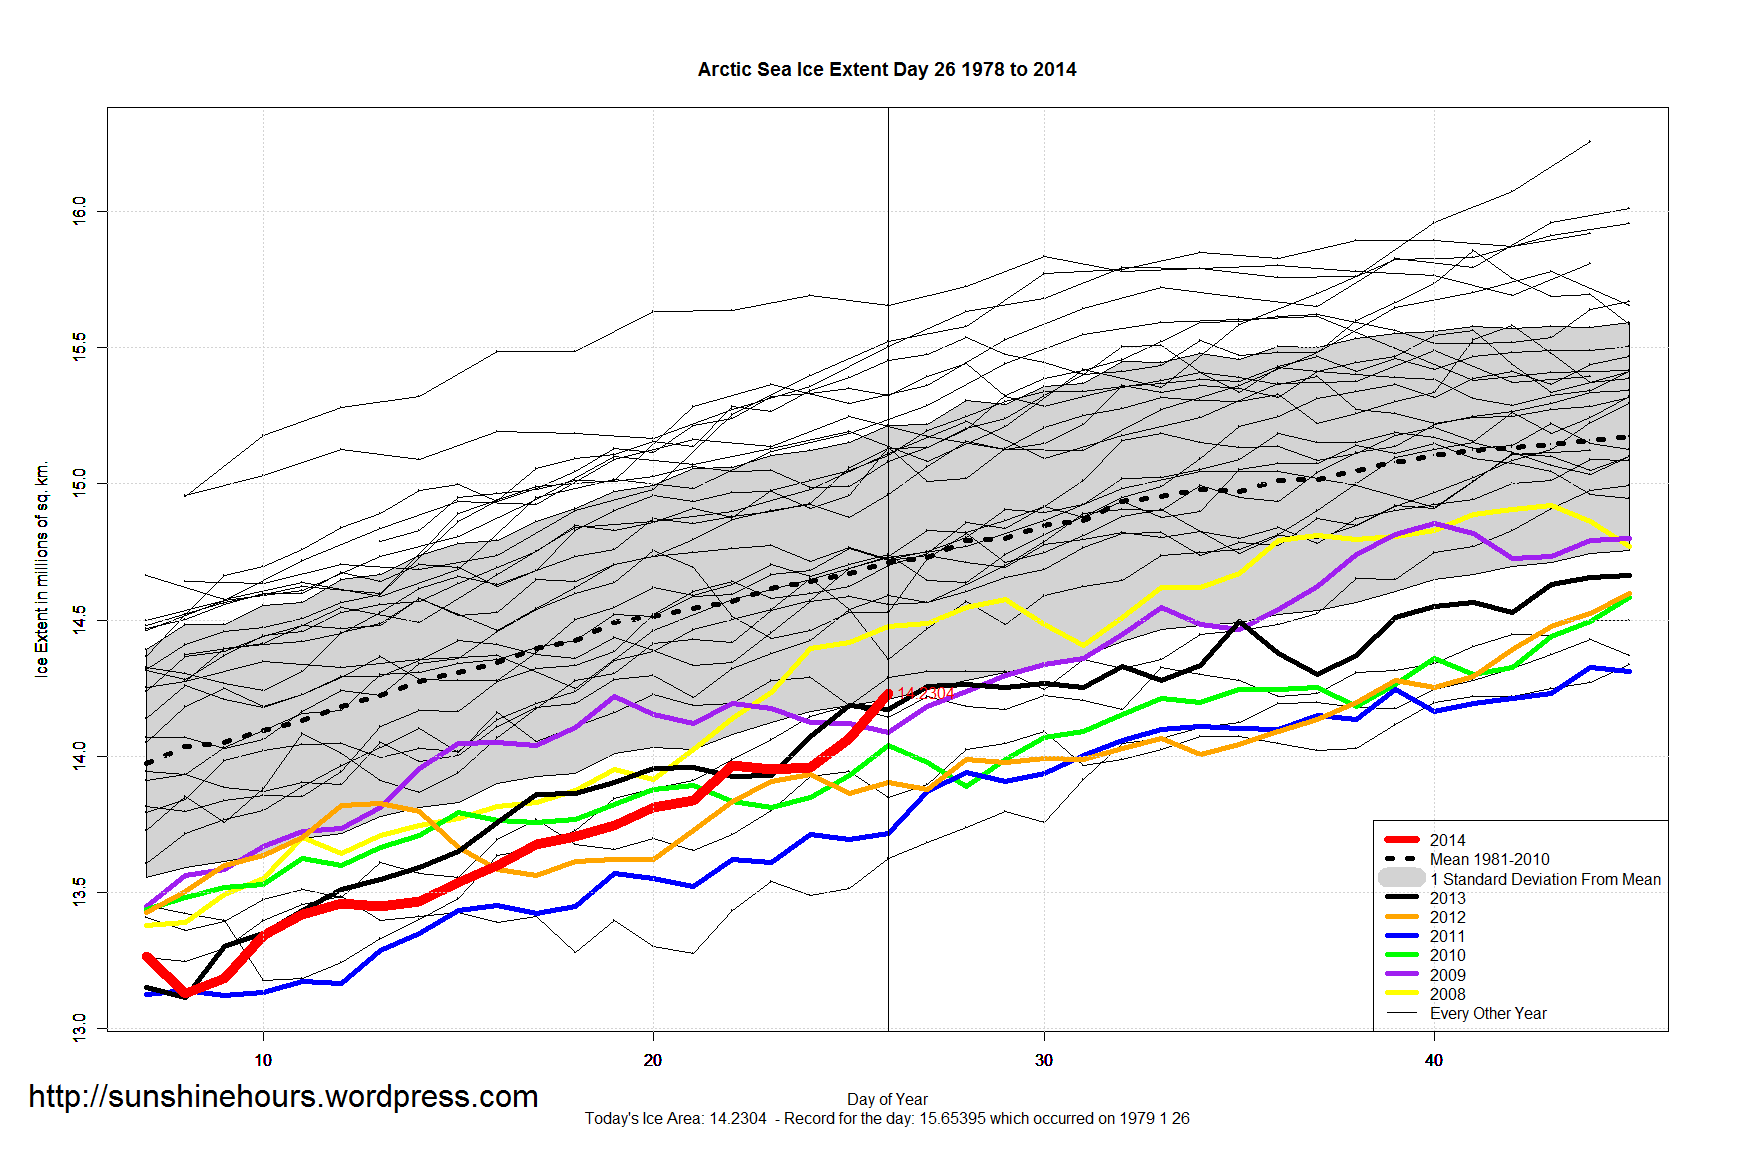
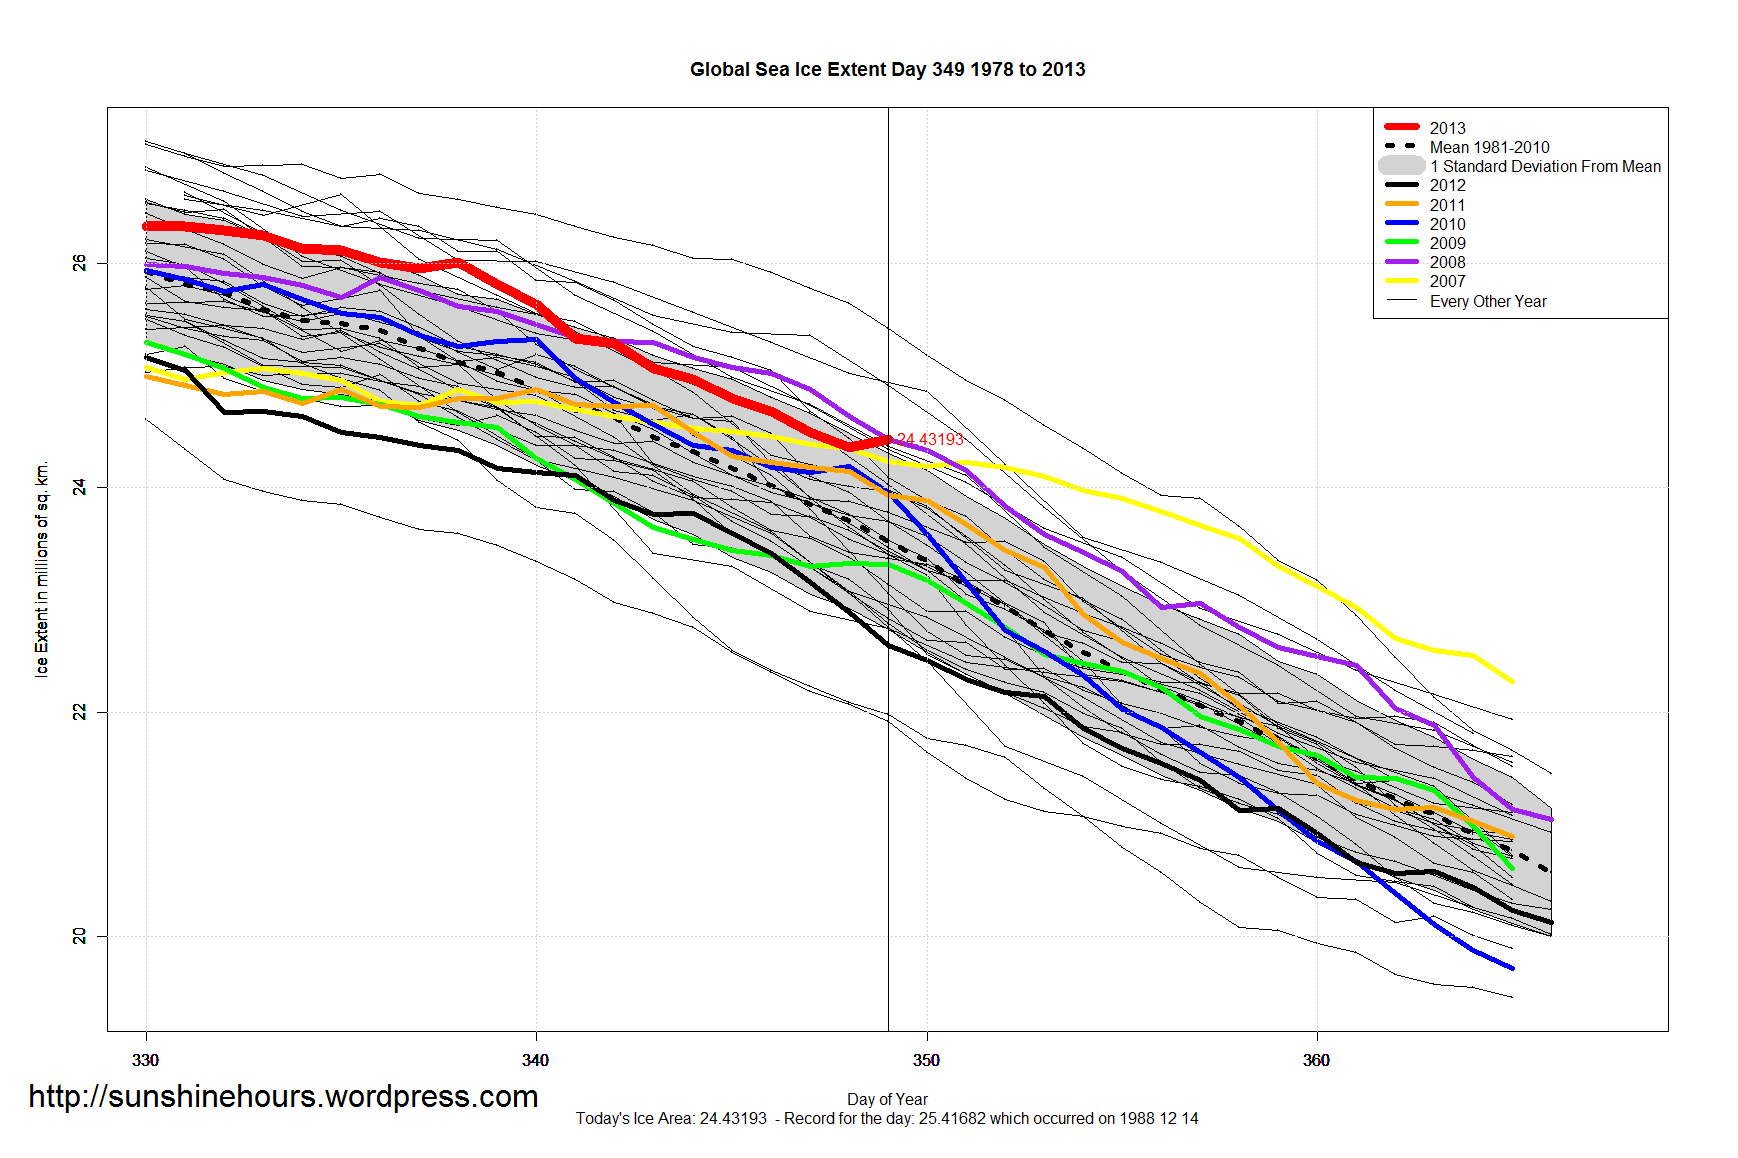
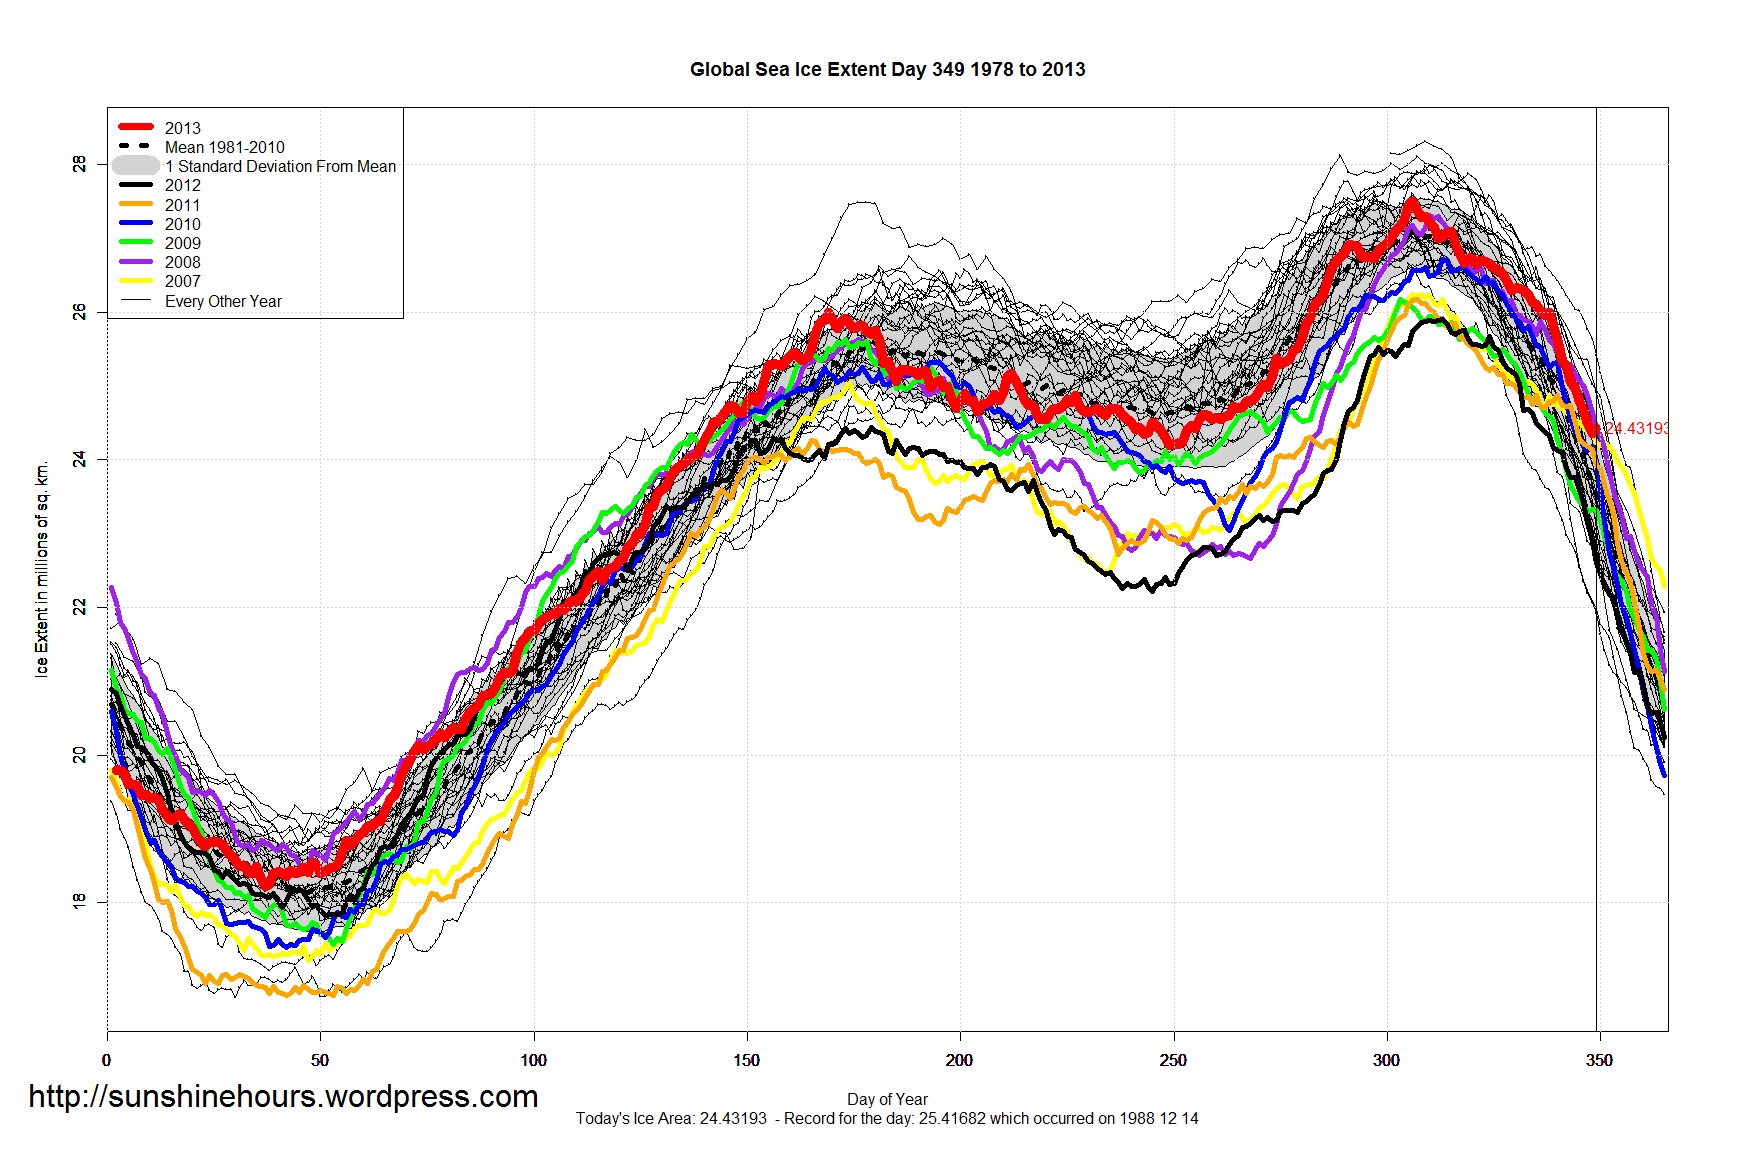
2013 was a well below average year for Arctic Sea Ice Extent .
Max Extent of 15.16969 For Whole Year Occurred On Day: 73 March 14
Max Anomaly For Whole Year Occurred On Day: 145 May 25 = -0.05969577
Max Anomaly % For Whole Year Occurred On Day: 145 May 25 = -0.4662094
Mean Anomaly For Whole Year: = -0.6446271
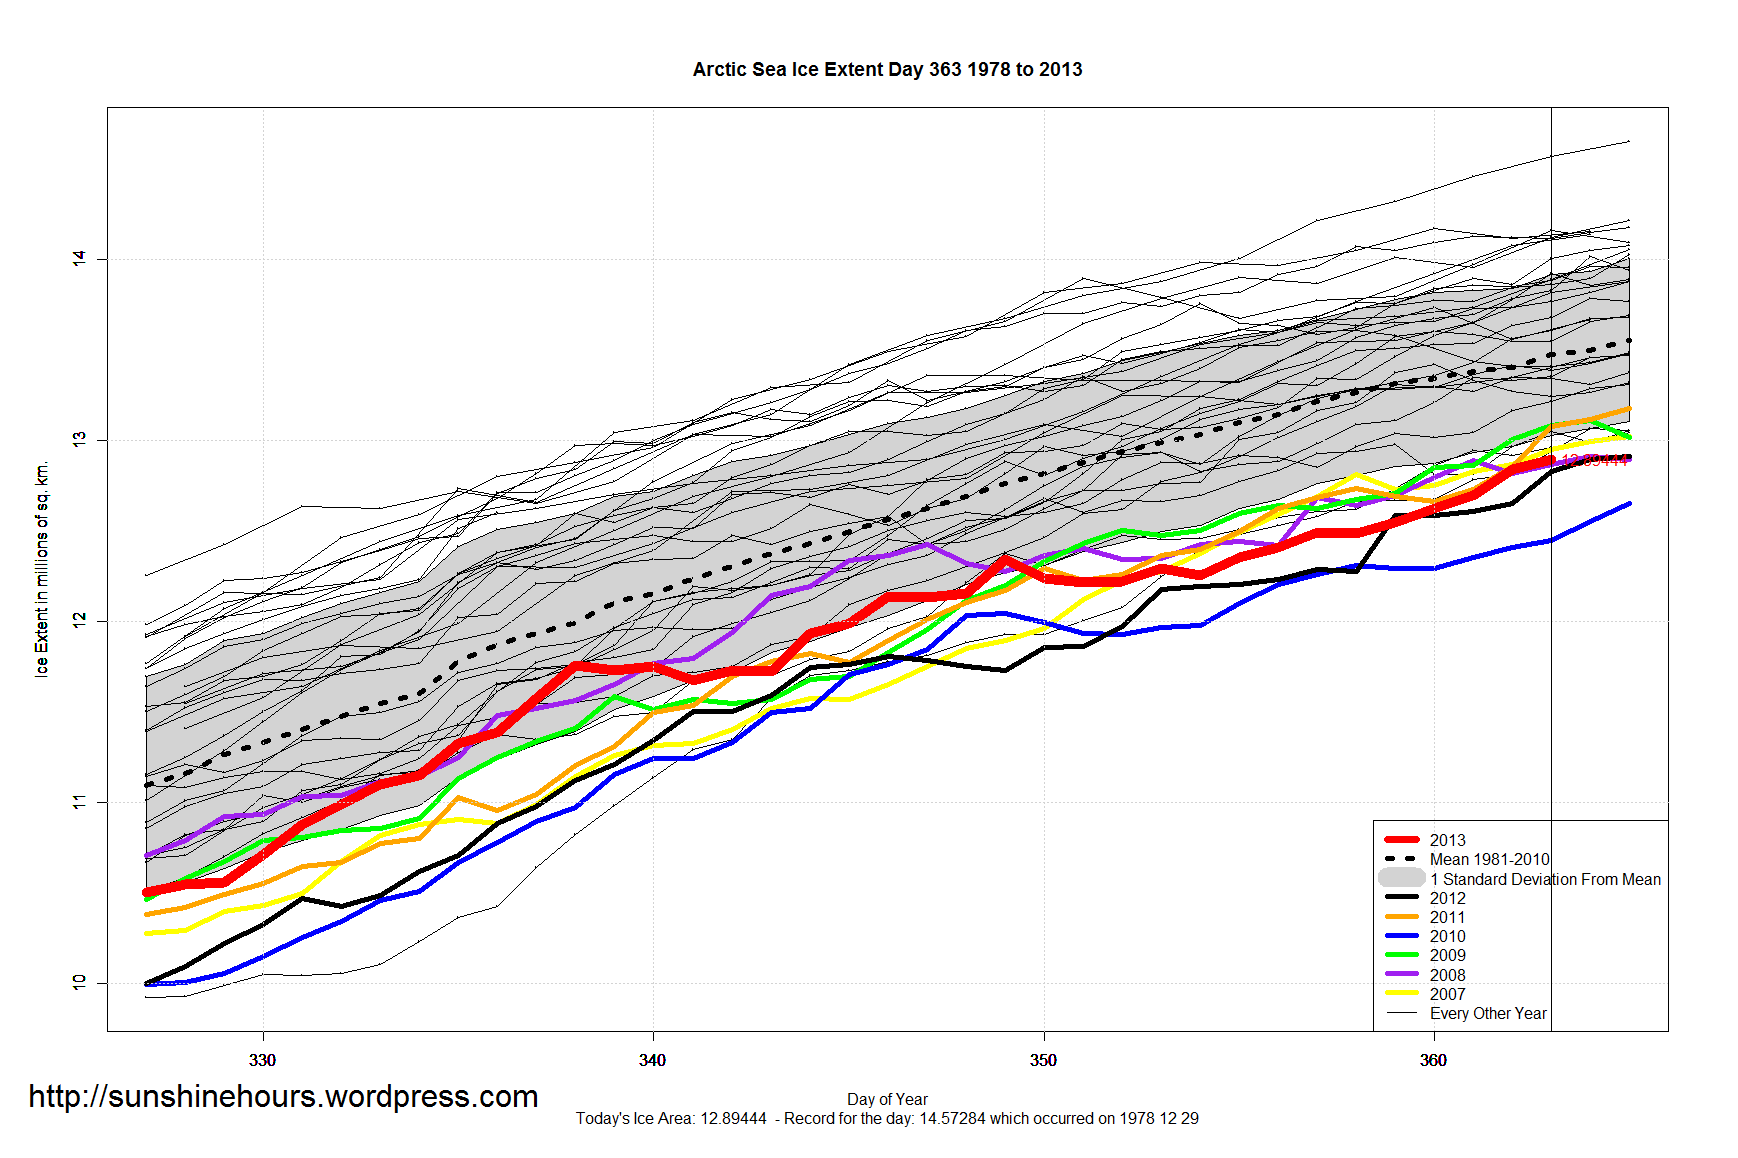
2013 was ranked 30th out of 36 years for average anomaly above the 1981-2010 mean – just below 2009, but 530,000 sq km above 2012.
30 2013 -0.64
31 2005 -0.66
32 2006 -0.79
33 2010 -0.86
34 2011 -1.08
35 2007 -1.09
36 2012 -1.17
There were zero daily records set and no 2nd places.
Number of daily records sorted by Top 2
| Year |
First |
Second |
Top 2 |
| 1982 |
54 |
69 |
123 |
| 1983 |
48 |
38 |
86 |
| 1980 |
42 |
39 |
81 |
| 1979 |
59 |
19 |
78 |
| 1992 |
22 |
54 |
76 |
| 1996 |
39 |
17 |
56 |
| 1981 |
26 |
12 |
38 |
| 1988 |
6 |
29 |
35 |
| 1978 |
24 |
5 |
29 |
| 1987 |
5 |
23 |
28 |
| 1985 |
15 |
12 |
27 |
| 1986 |
15 |
9 |
24 |
| 1989 |
7 |
11 |
18 |
| 1993 |
4 |
13 |
17 |
Here are the key stats for each year. Min/Max/Anomaly in millions sq km.
| Year |
Min |
Max |
day of Max |
day of Min |
Avg Anomaly |
| 1979 |
6.89236 |
16.56457 |
60 |
264 |
0.75 |
| 1980 |
7.52476 |
16.25042 |
65 |
249 |
0.76 |
| 1981 |
6.88784 |
15.71365 |
73 |
253 |
0.56 |
| 1982 |
7.15423 |
16.27475 |
58 |
256 |
0.87 |
| 1983 |
7.19145 |
16.33207 |
73 |
251 |
0.76 |
| 1984 |
6.39916 |
15.76157 |
78 |
260 |
0.34 |
| 1985 |
6.4799 |
16.11716 |
76 |
250 |
0.42 |
| 1986 |
7.12351 |
16.11934 |
69 |
249 |
0.63 |
| 1987 |
6.89159 |
16.21724 |
52 |
245 |
0.7 |
| 1988 |
7.04905 |
16.24163 |
70 |
255 |
0.6 |
| 1989 |
6.88931 |
15.72295 |
65 |
265 |
0.4 |
| 1990 |
6.0191 |
16.21077 |
71 |
264 |
0.12 |
| 1991 |
6.26027 |
15.58803 |
56 |
259 |
0.18 |
| 1992 |
7.16324 |
15.53258 |
72 |
251 |
0.53 |
| 1993 |
6.15699 |
16.00491 |
72 |
249 |
0.35 |
| 1994 |
6.92645 |
15.72226 |
61 |
248 |
0.44 |
| 1995 |
5.98945 |
15.32238 |
59 |
252 |
-0.16 |
| 1996 |
7.15283 |
15.42074 |
52 |
254 |
0.26 |
| 1997 |
6.61353 |
15.63647 |
79 |
246 |
0.1 |
| 1998 |
6.29922 |
16.02091 |
56 |
260 |
0.19 |
| 1999 |
5.68009 |
15.55755 |
89 |
255 |
0.12 |
| 2000 |
5.9442 |
15.44482 |
63 |
255 |
-0.07 |
| 2001 |
6.56774 |
15.66664 |
63 |
262 |
0.03 |
| 2002 |
5.62456 |
15.57345 |
68 |
256 |
-0.2 |
| 2003 |
5.97198 |
15.58678 |
80 |
260 |
-0.17 |
| 2004 |
5.77608 |
15.25548 |
70 |
263 |
-0.33 |
| 2005 |
5.31832 |
14.94615 |
71 |
265 |
-0.66 |
| 2006 |
5.74877 |
14.73298 |
70 |
257 |
-0.79 |
| 2007 |
4.1607 |
14.78963 |
69 |
257 |
-1.09 |
| 2008 |
4.55469 |
15.30522 |
58 |
262 |
-0.59 |
| 2009 |
5.05488 |
15.16275 |
61 |
255 |
-0.63 |
| 2010 |
4.59918 |
15.28449 |
90 |
262 |
-0.86 |
| 2011 |
4.33028 |
14.67084 |
66 |
251 |
-1.08 |
| 2012 |
3.36973 |
15.25102 |
64 |
260 |
-1.17 |
| 2013 |
5.07939 |
15.16969 |
73 |
252 |
-0.64 |
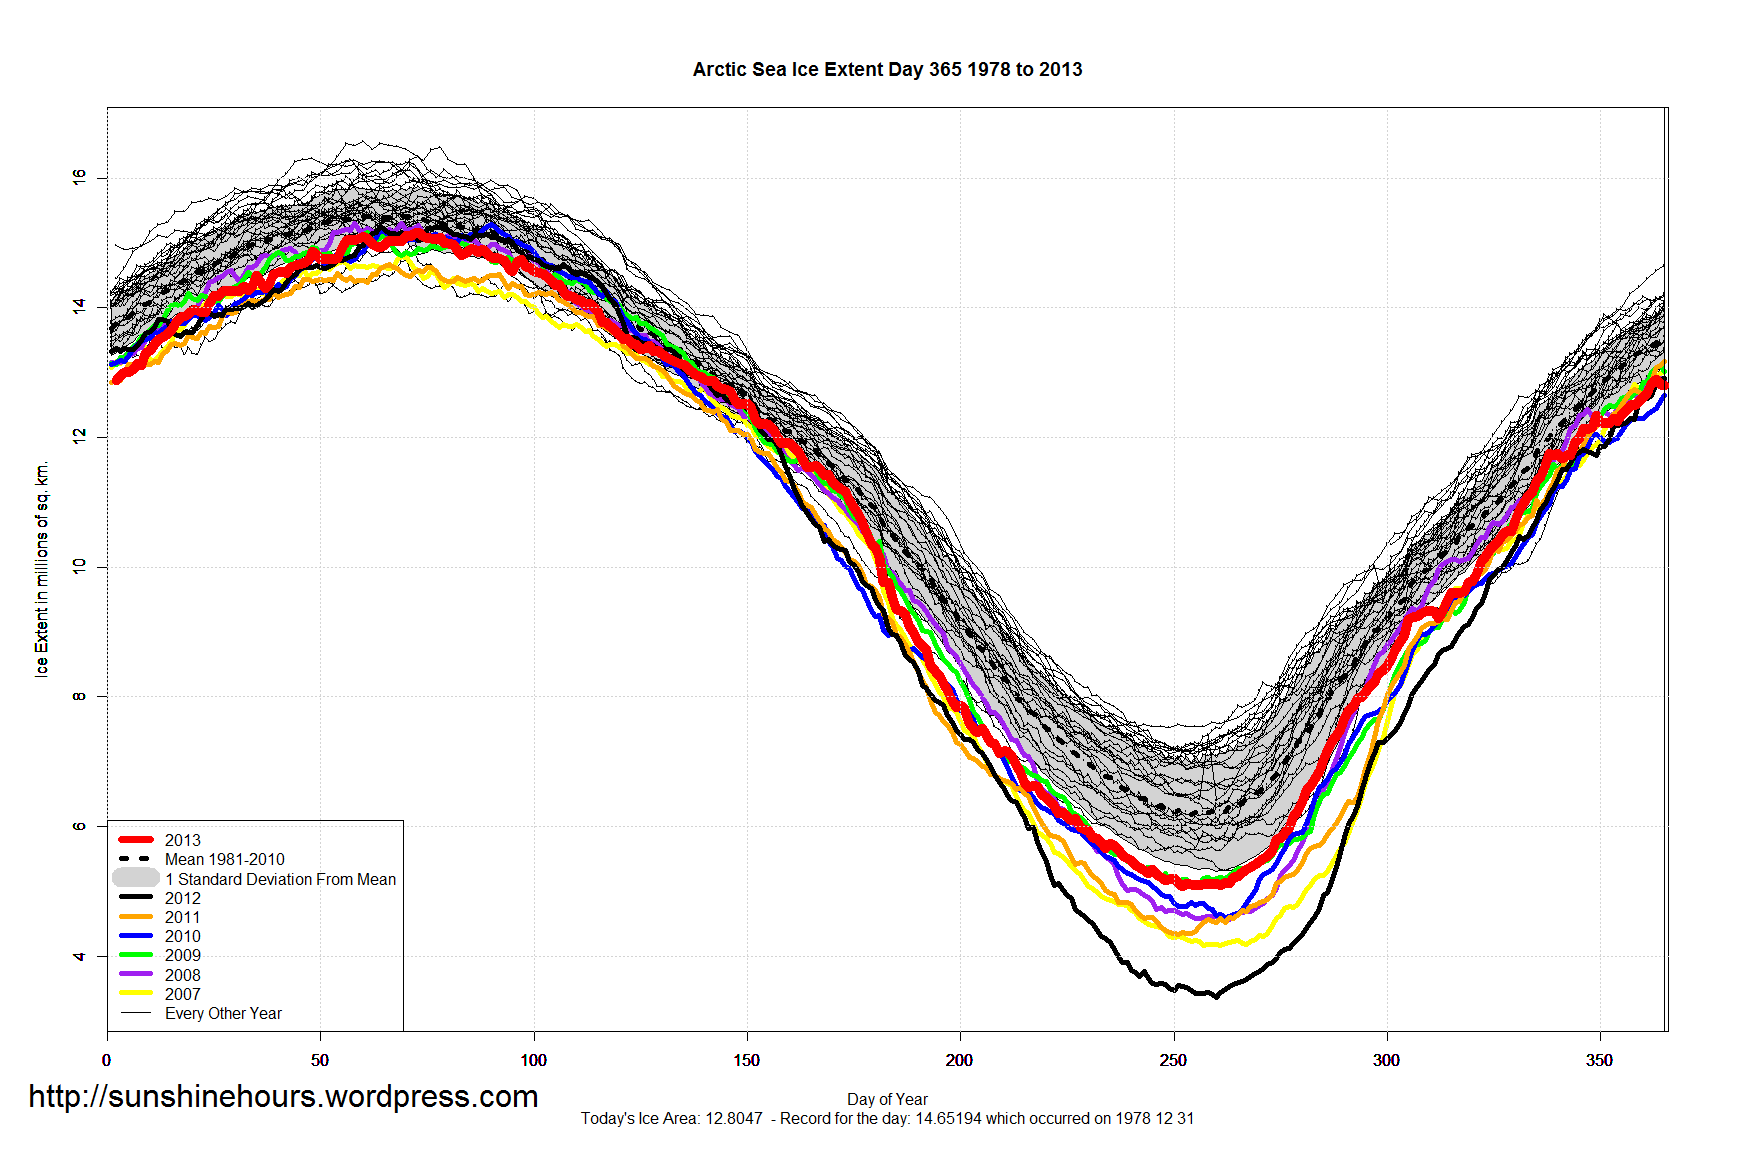
The Year End Graph.