Arctic Sea Ice Extent Higher Than 2005 According to DMI
The red line is 2005. The thick black line is 2013.

Arctic Sea Ice Extent Higher Than 2005 According to DMI
The red line is 2005. The thick black line is 2013.
UPDATE and Apology: The headline said Antarctic. The blog post said Arctic. I rushed. Sorry. This blog post is about the Arctic.
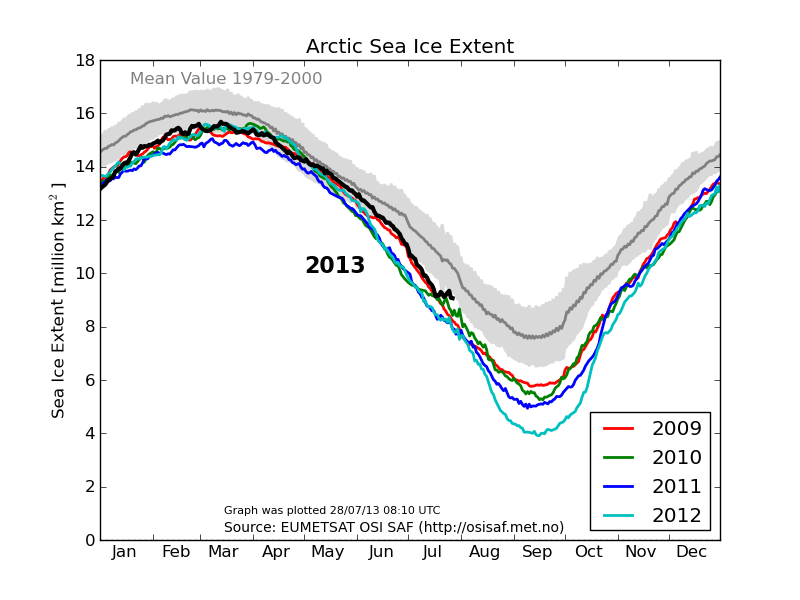
On this day in 2012, the Arctic Sea Ice Extent Anomaly from the 1981-2010 mean was 2.3 million sq km. Thats 31% below “normal”.
In 2013, the anomaly is now 1.07 million sq km – only 14.5% below normal.
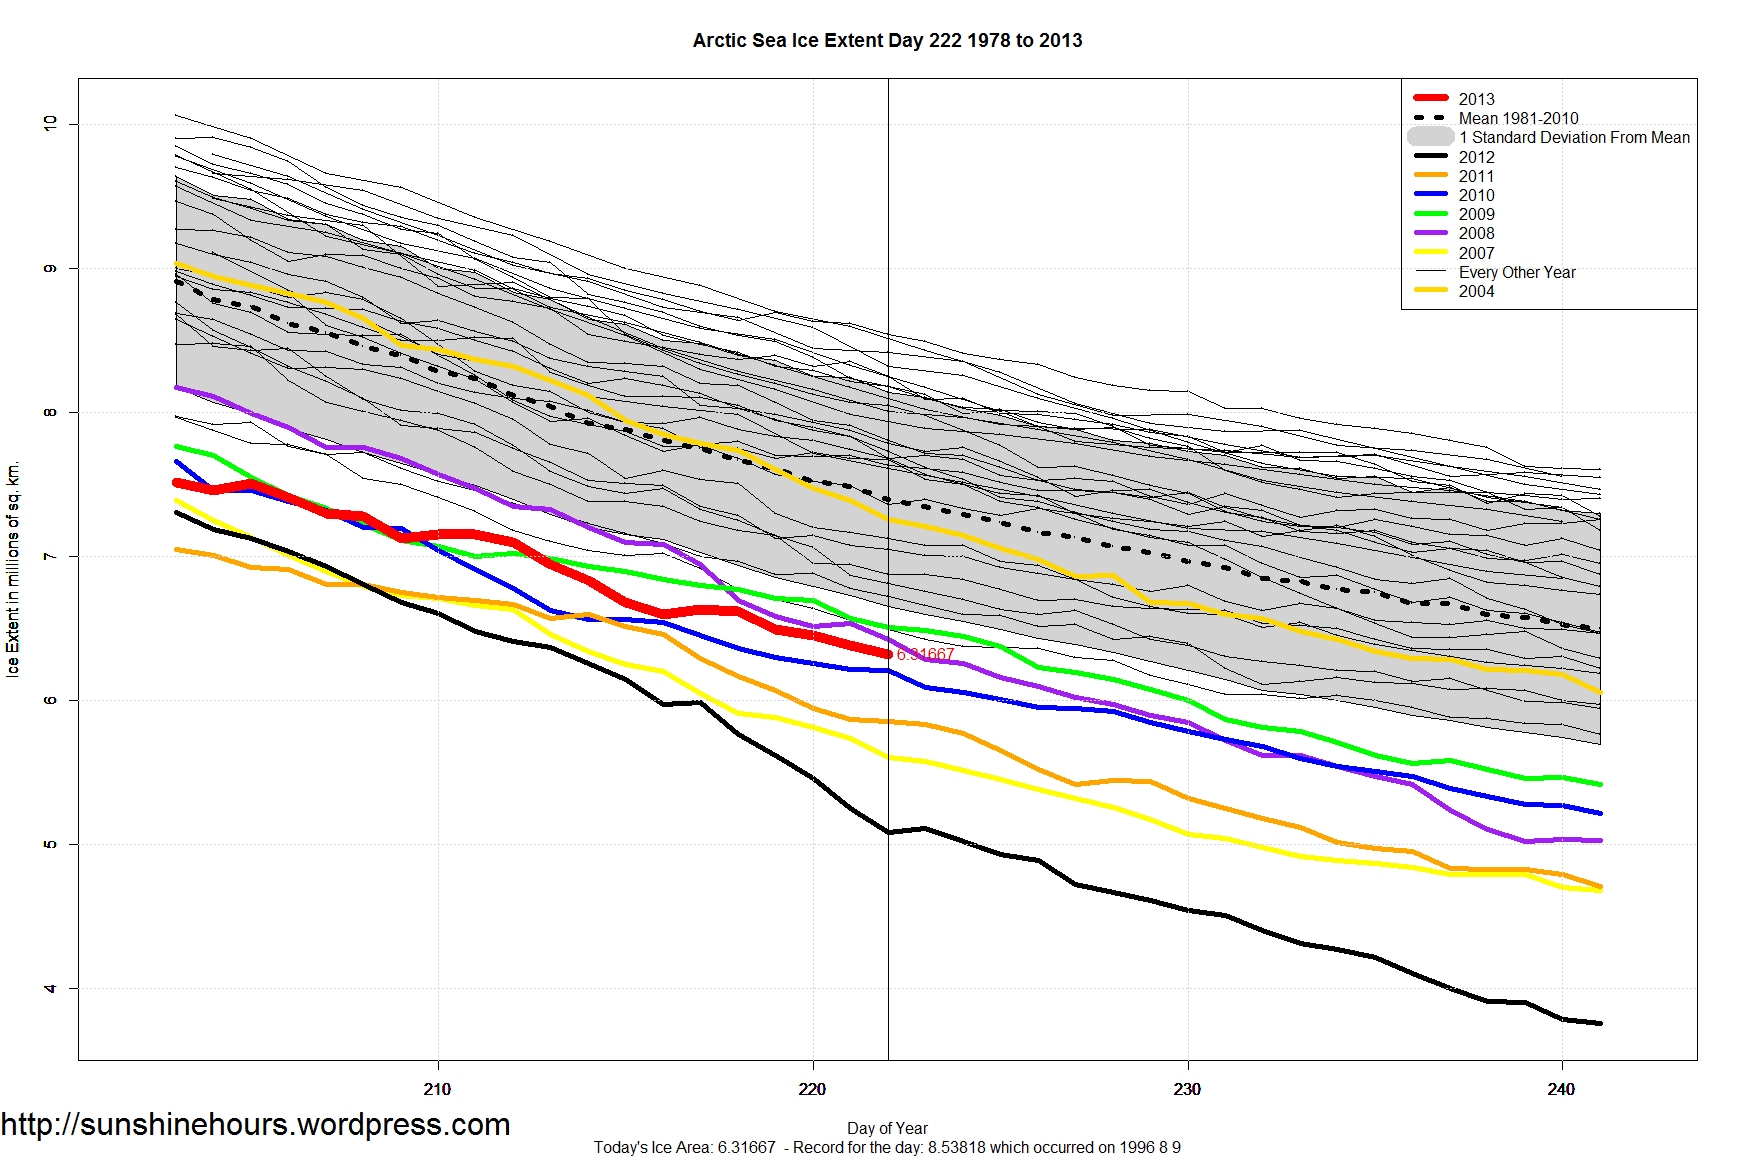
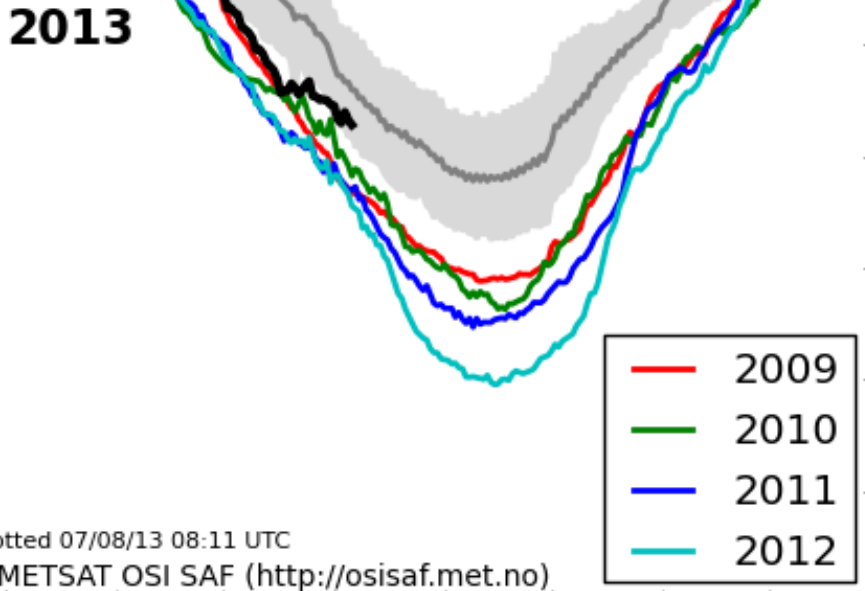
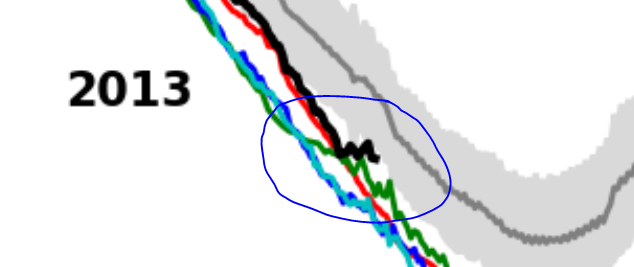
August 8th was day 220. Arctic Sea Ice Extent is 988,000 sq km Higher Than 2012. Some cult is weeping …

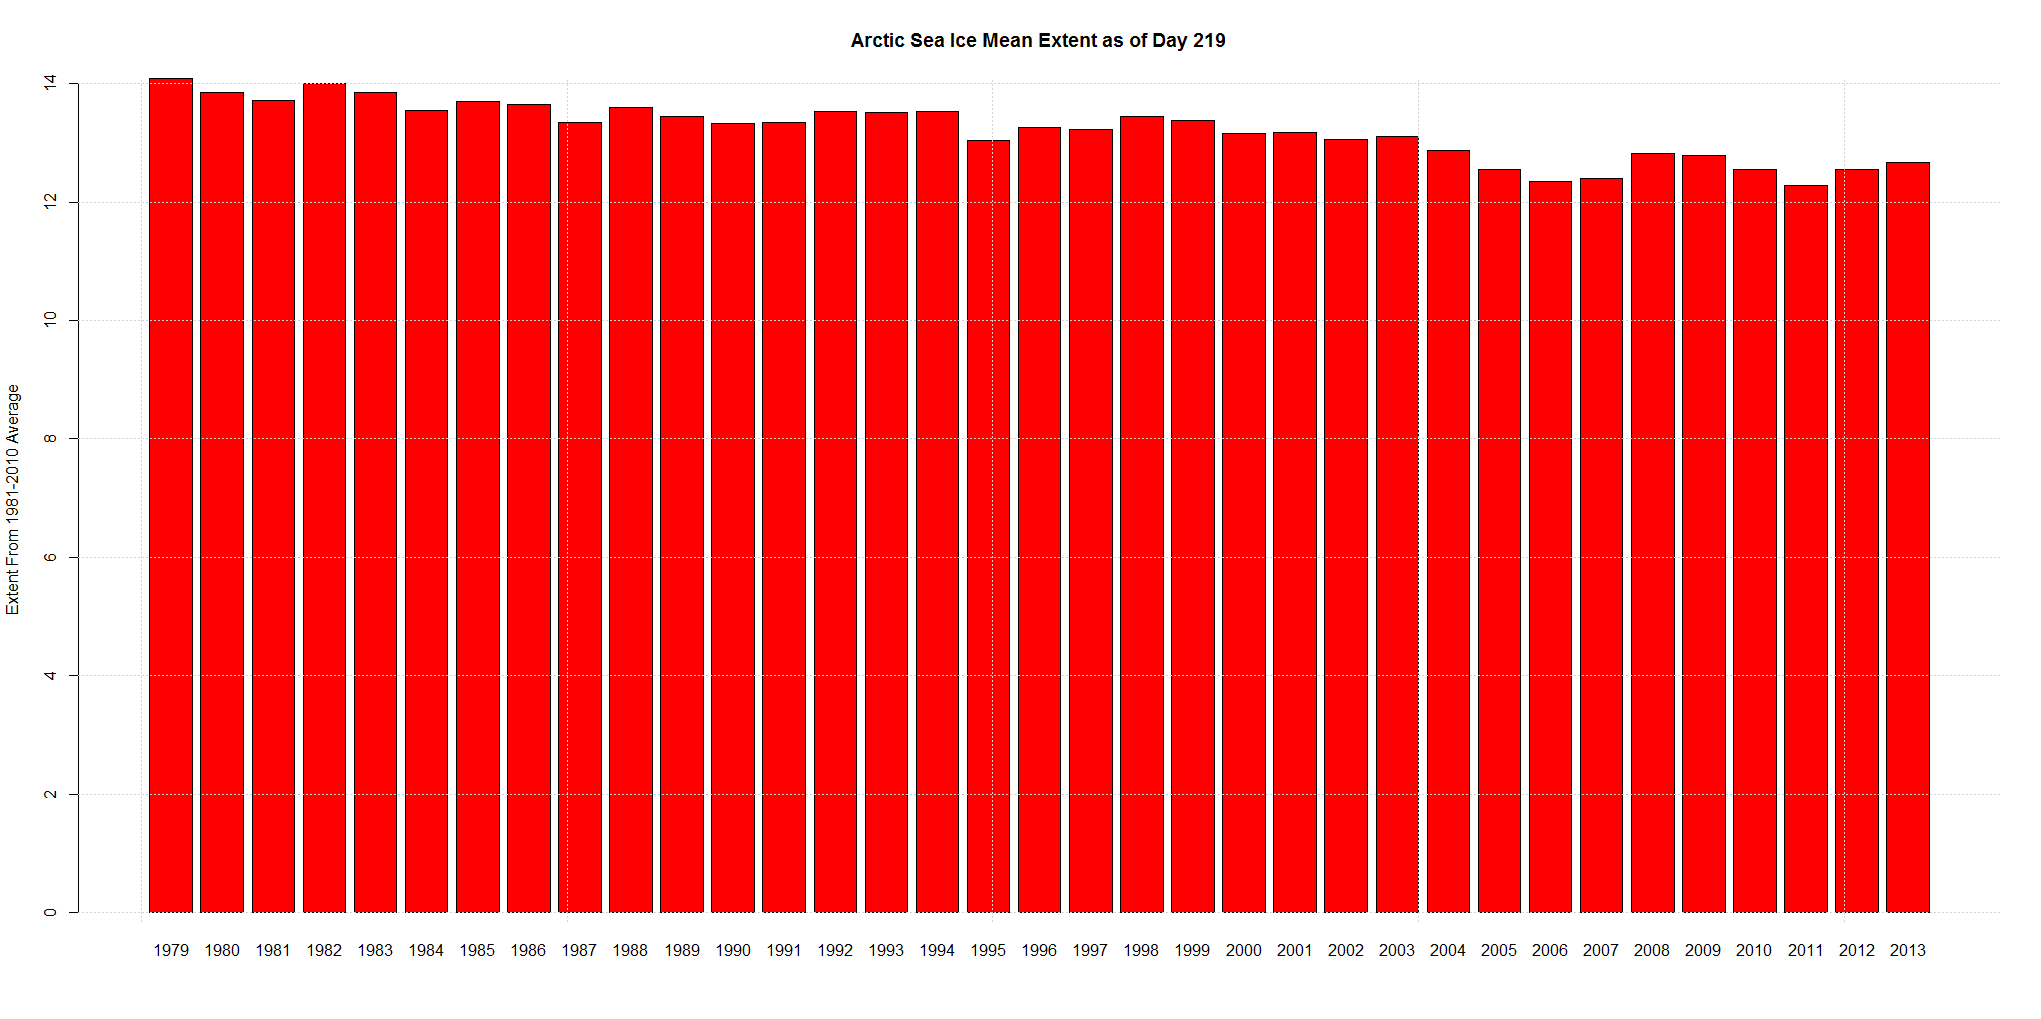
The following graph is the mean of Arctic sea ice extent up to day 219 for each year.
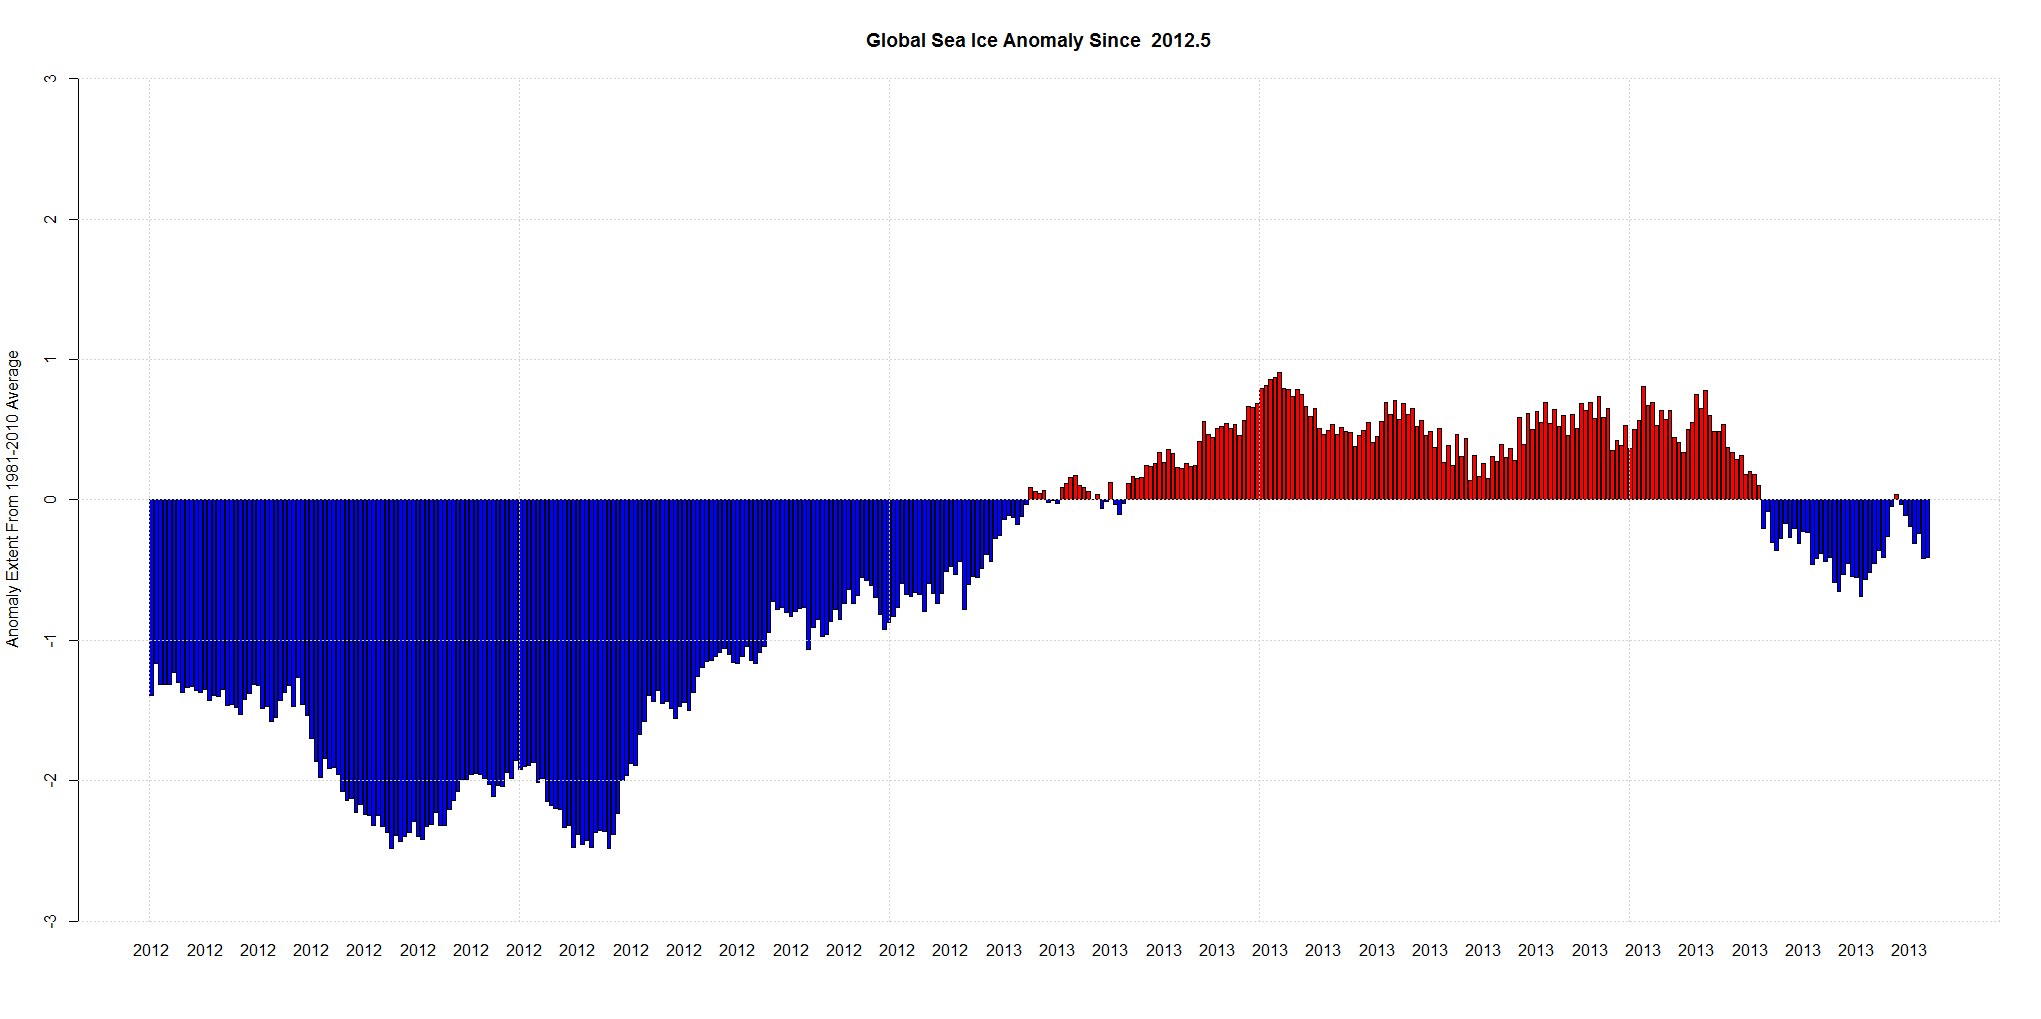
Using the anomaly from the 1981-2010 mean for Arctic + Antarctic Sea Ice Extent here is the graph of the data since July 2012.
The global anomaly is pretty small right now, but it was pretty low in 2012 and almost 1,000,000 sq km earlier this year.
About average.
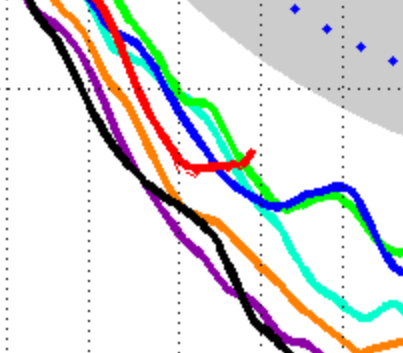
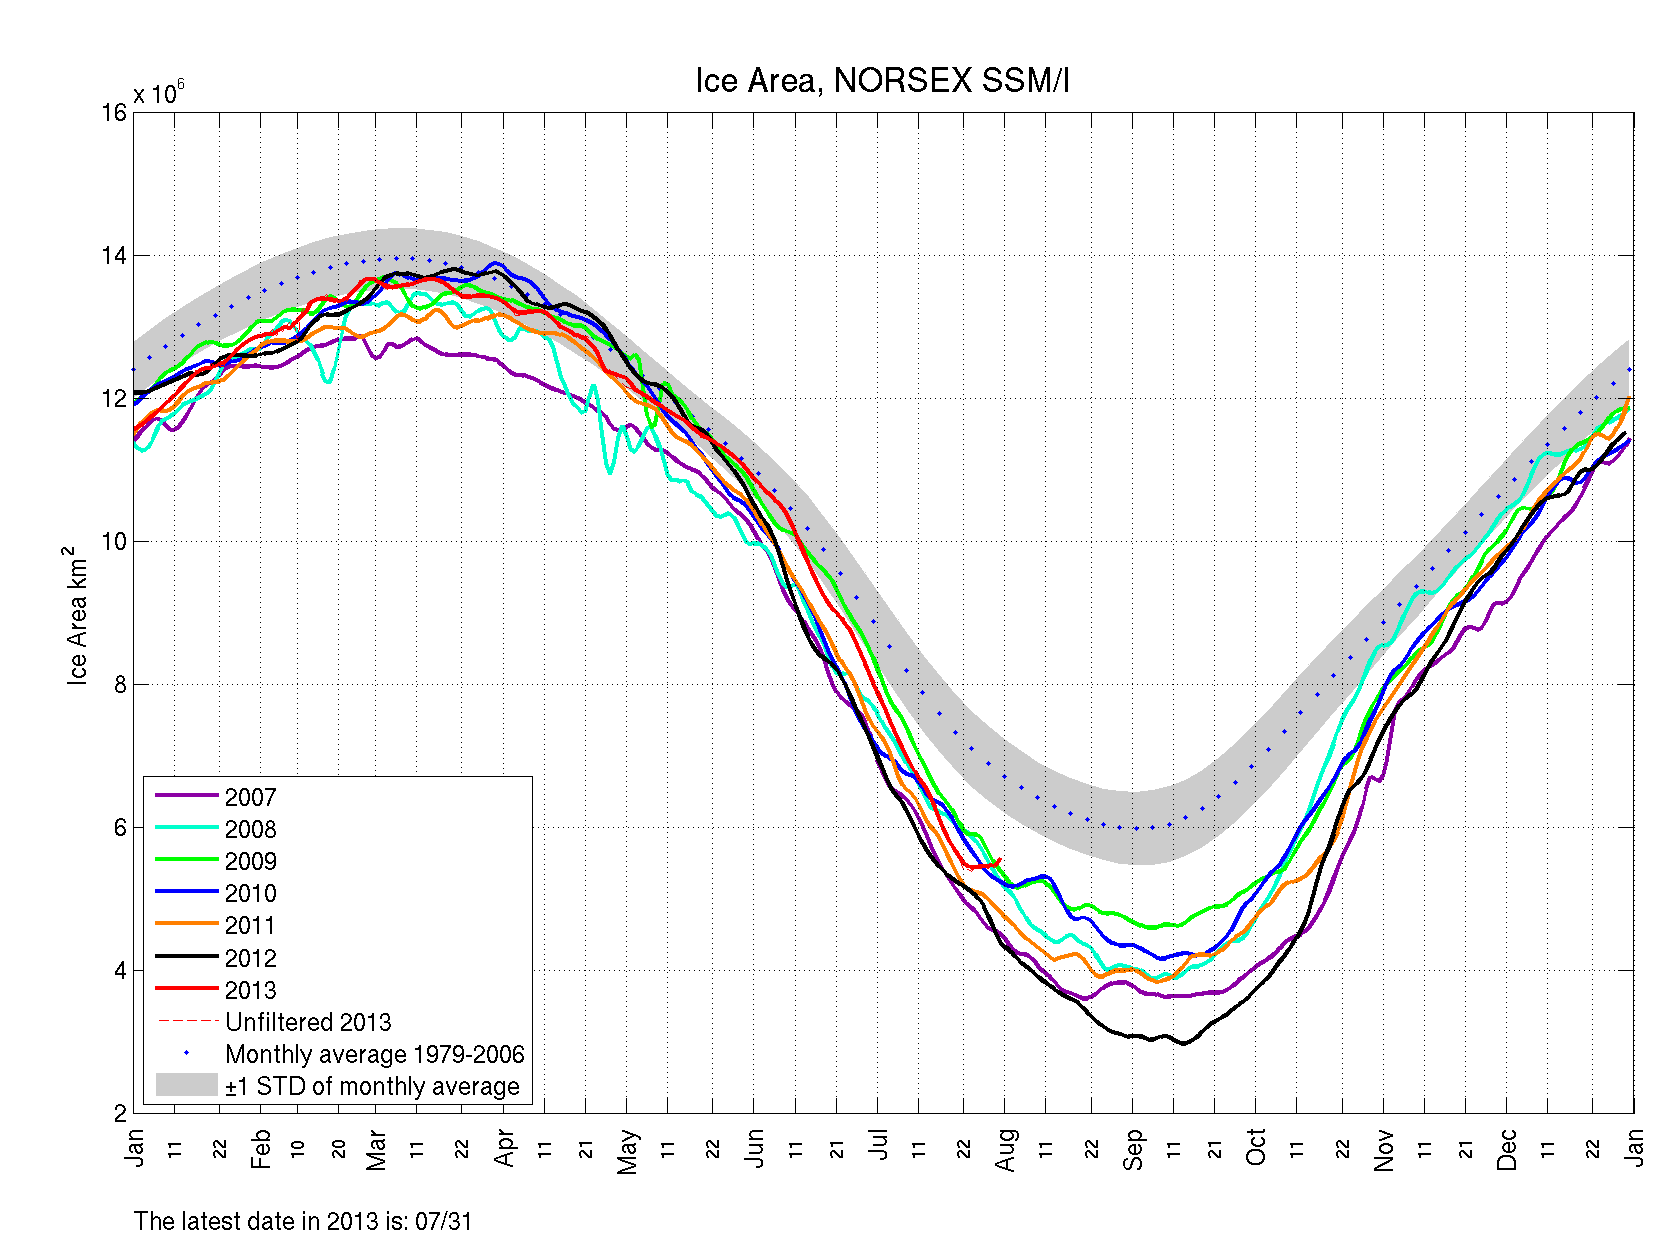
Normally I graph Arctic and Antarctic Ice Extent from NSIDC data. But I do keep an eye on Norsex and Jaxa and DMI.
Norsex Arctic Ice Area looks amazingly upwards!
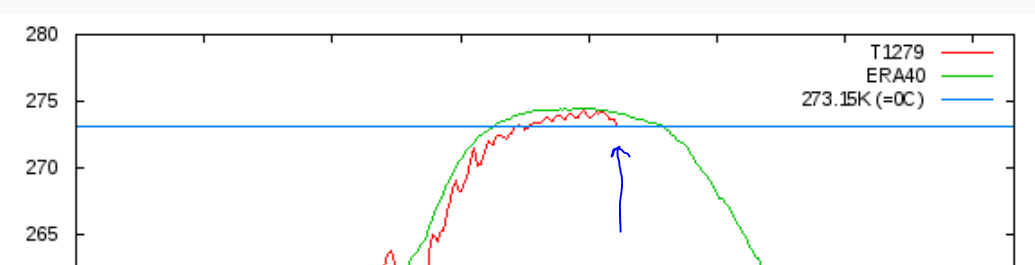
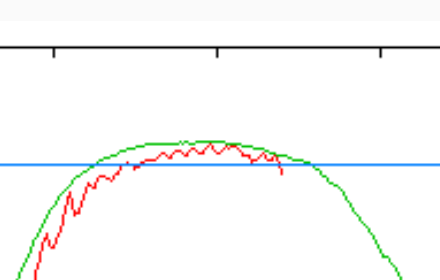
According to DMI, Arctic temperatures are dropping to zero early! The blue line is 0C.
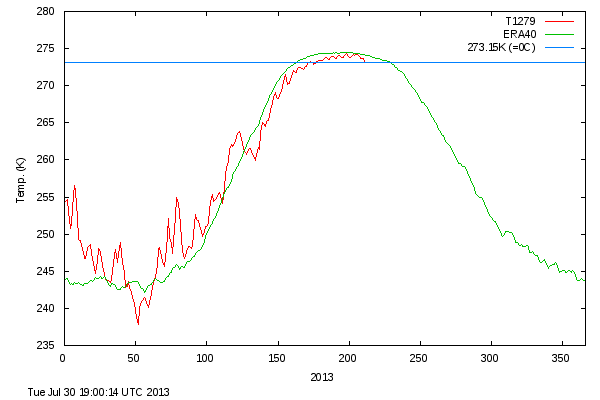
Full graph for 2013 of arctic temperatures.
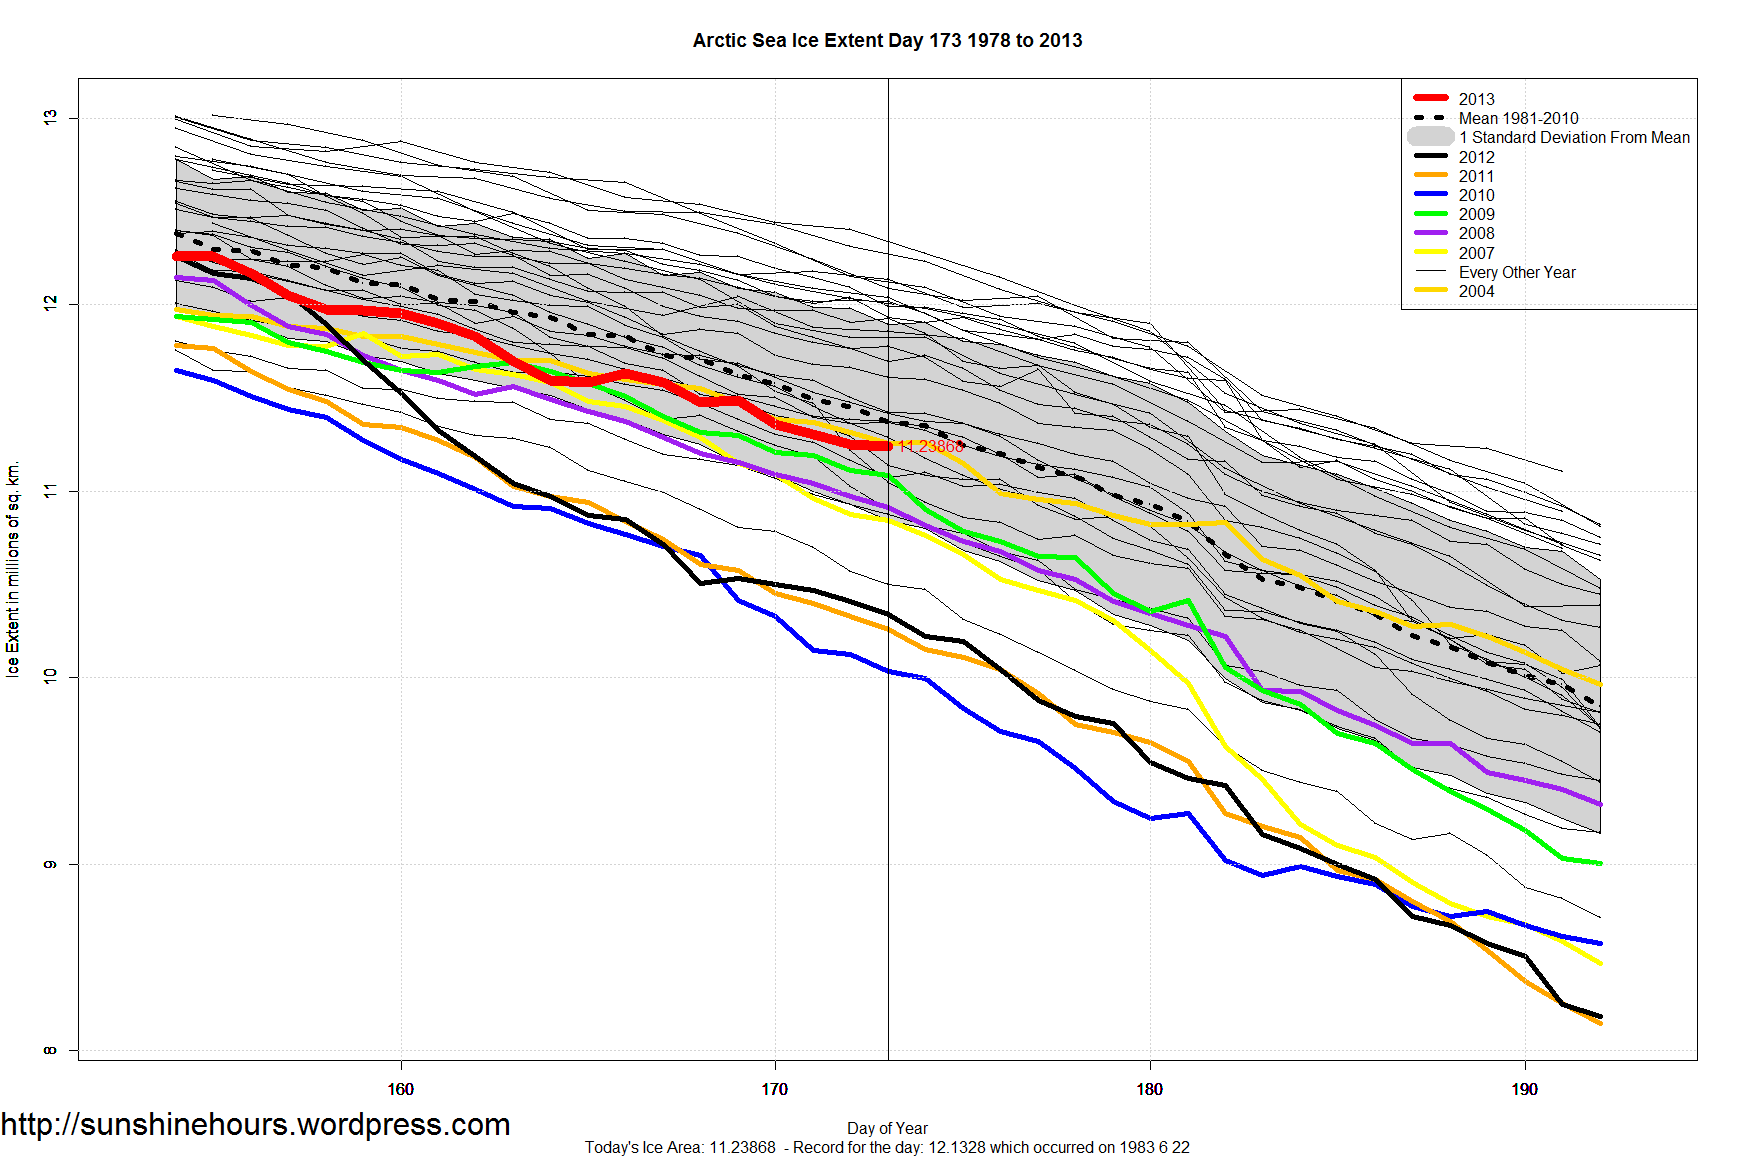
Arctic Sea Ice Extent for 2013 is only 130,000 sq km under the 11,367,000 mean for day 173. Thats 1.13%.
You have to go back to 2004 before it was closer to the mean.
