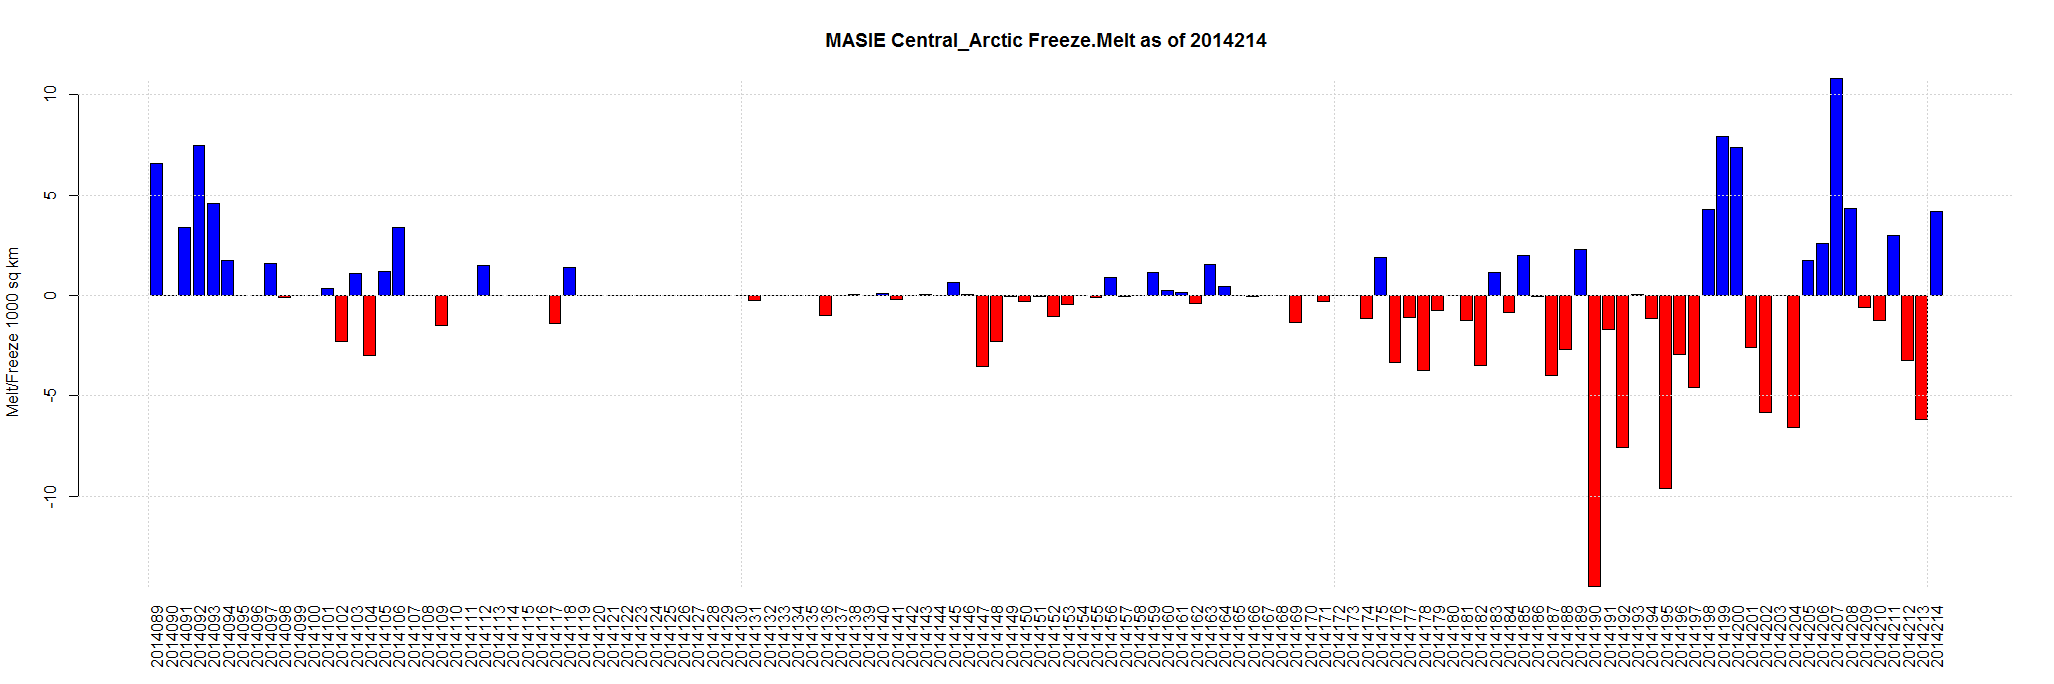
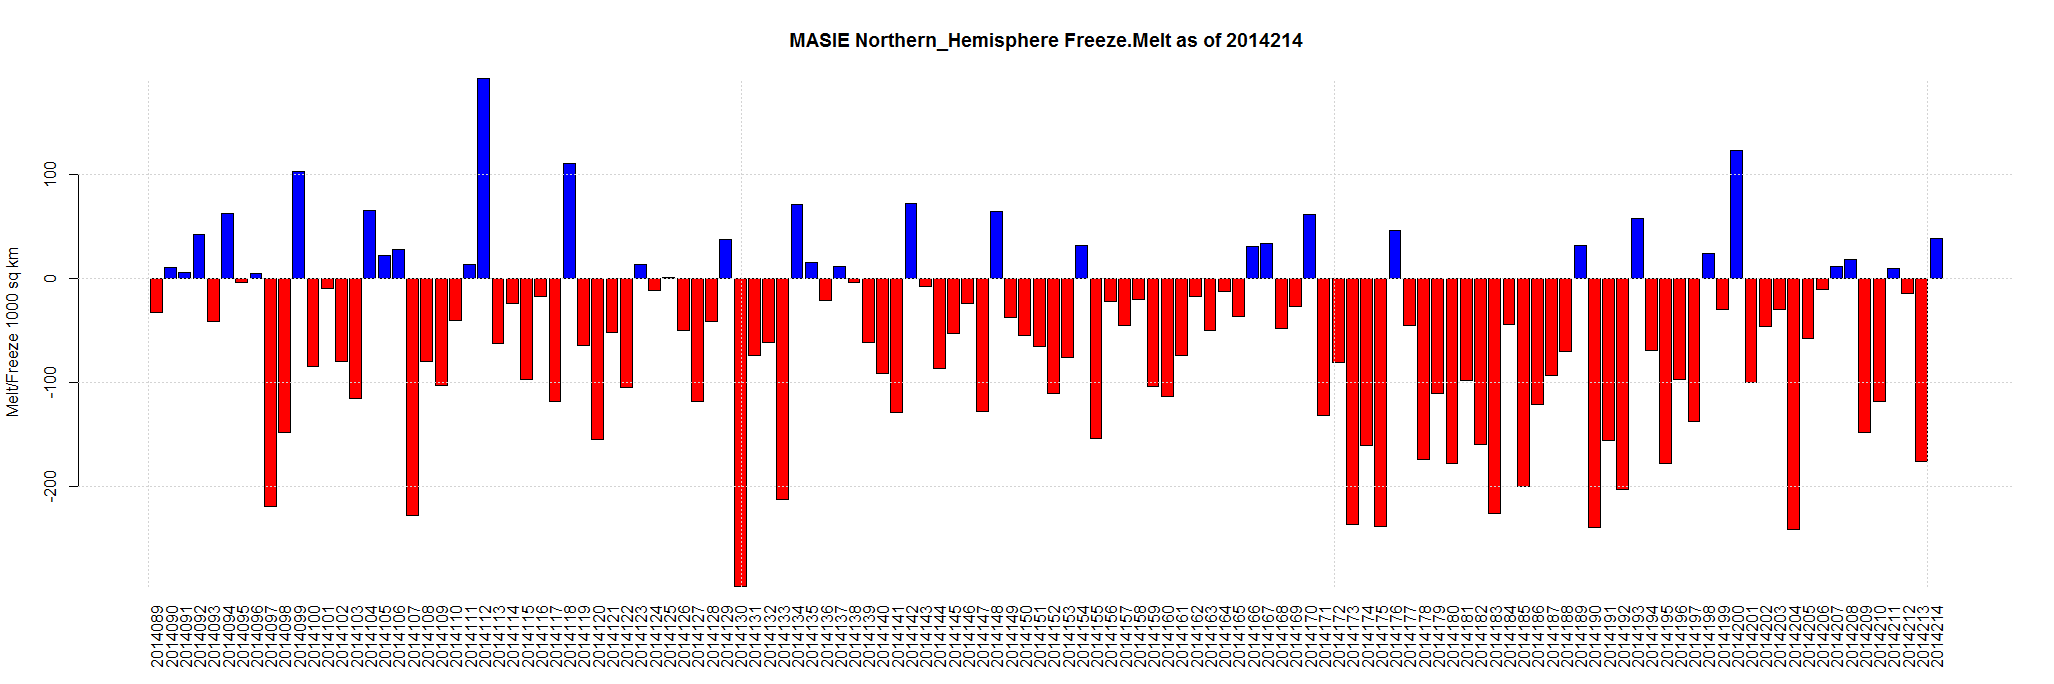
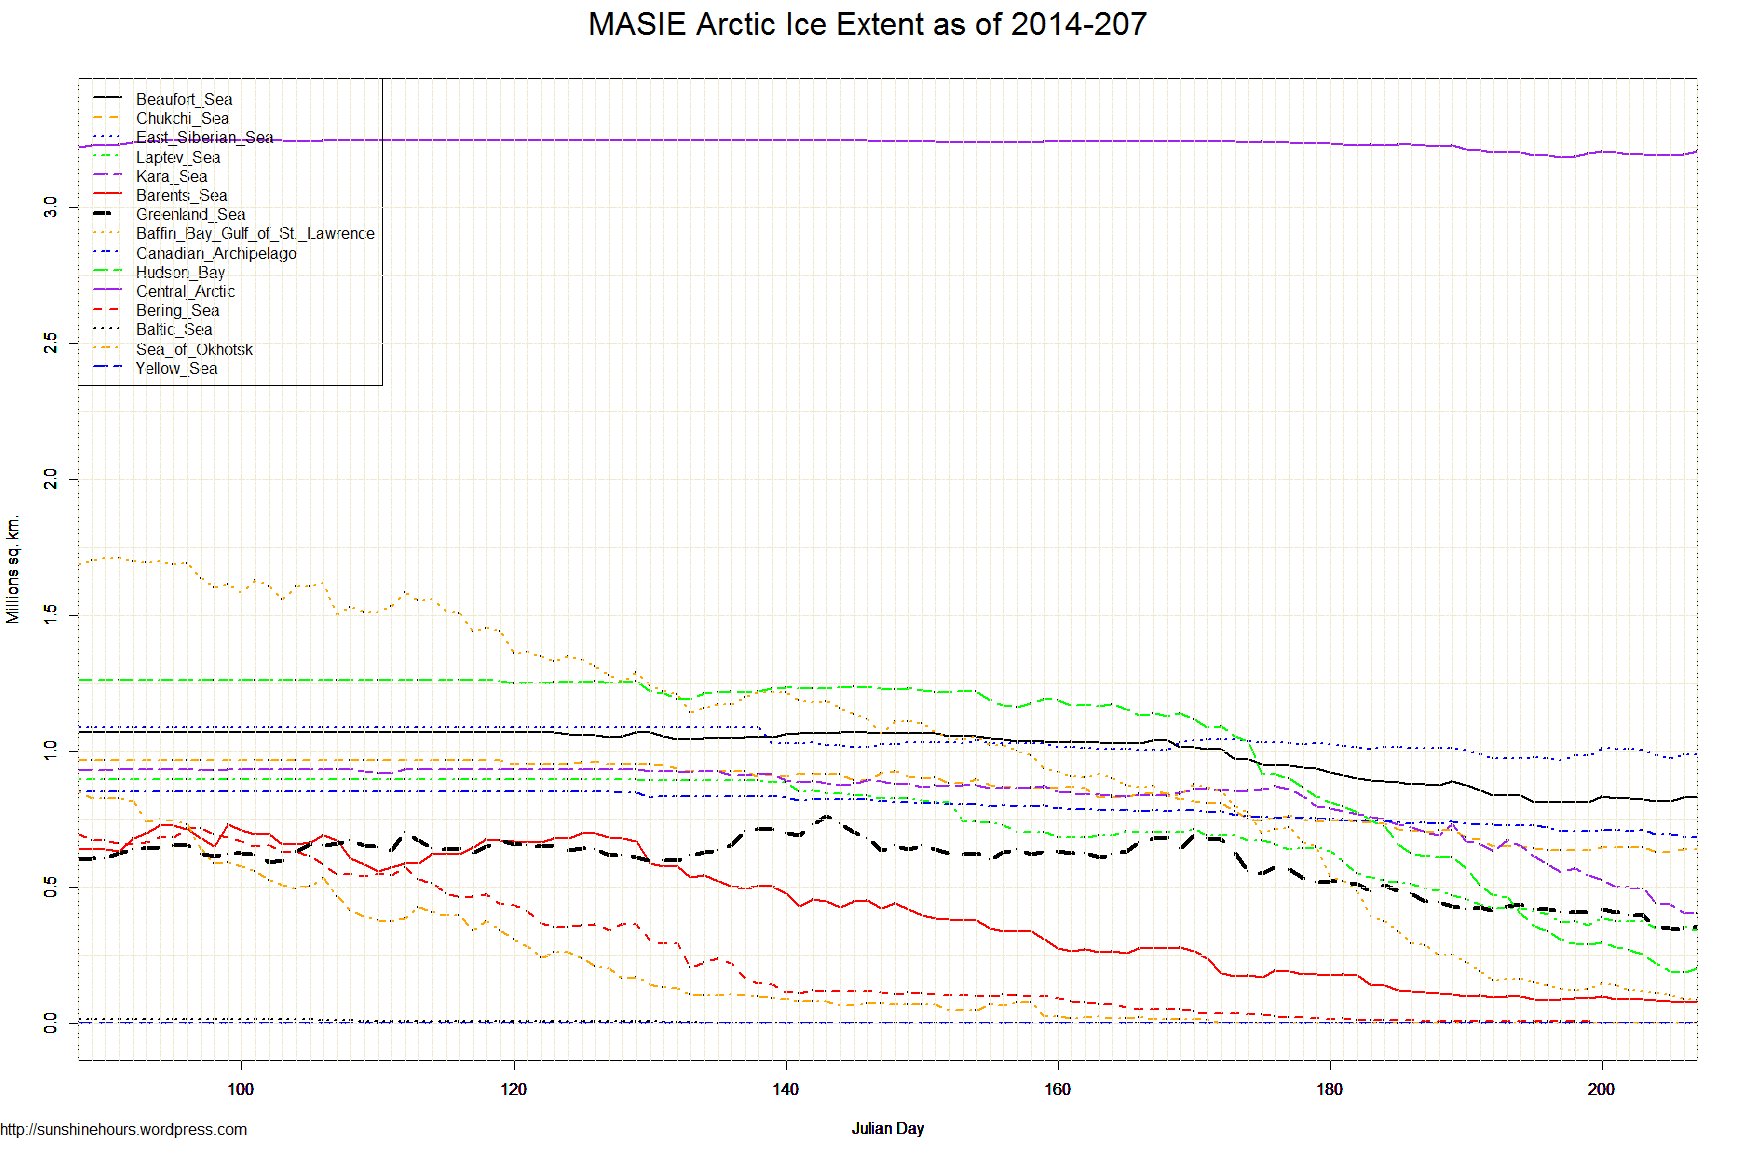
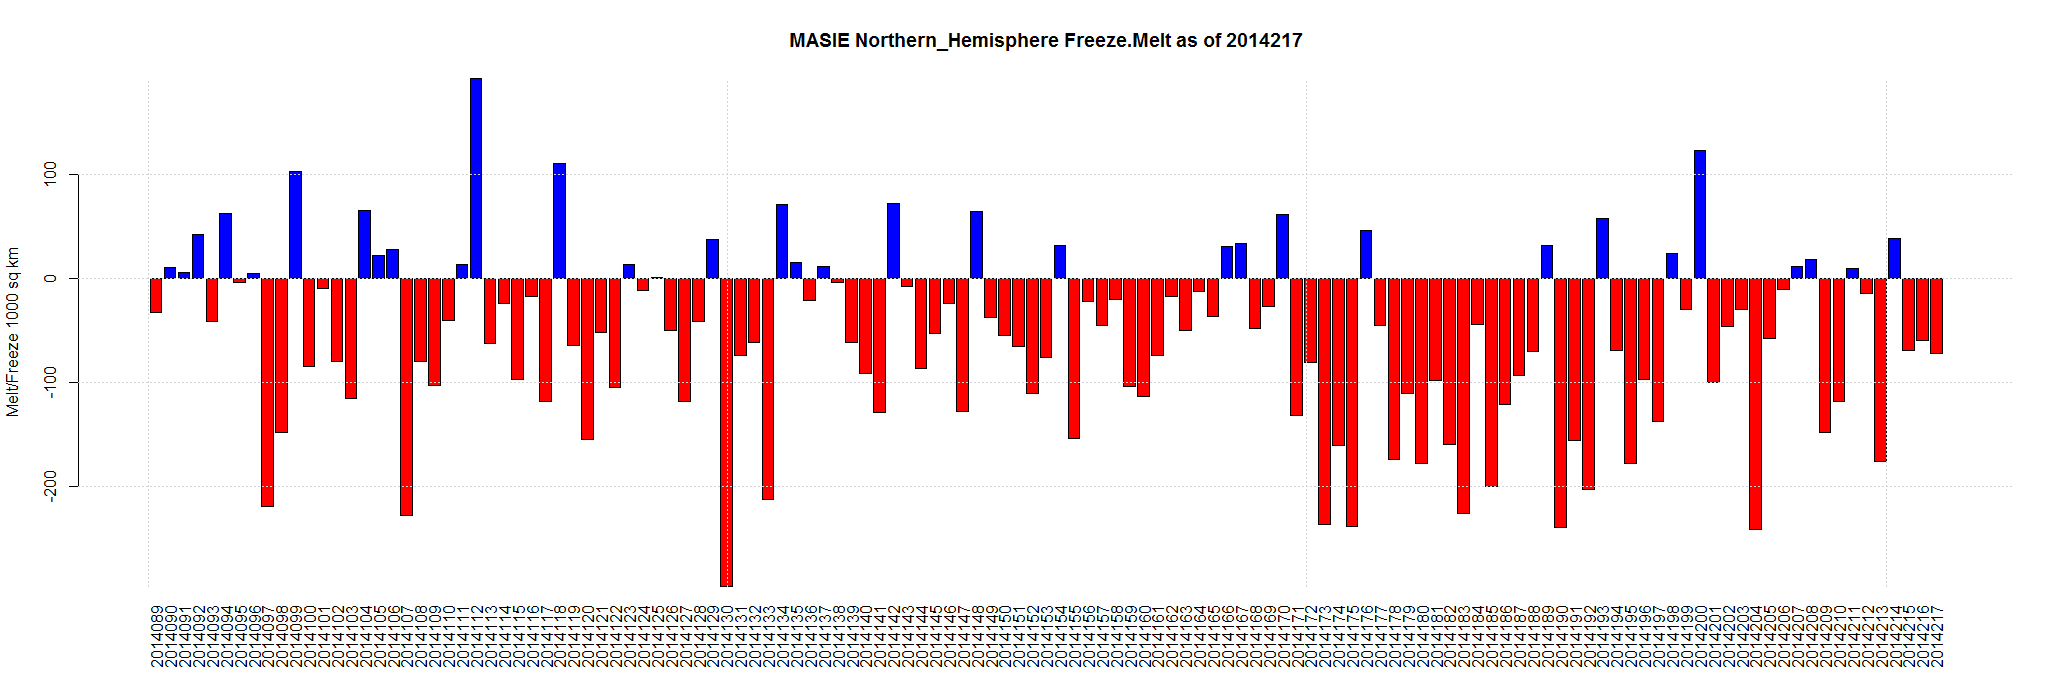
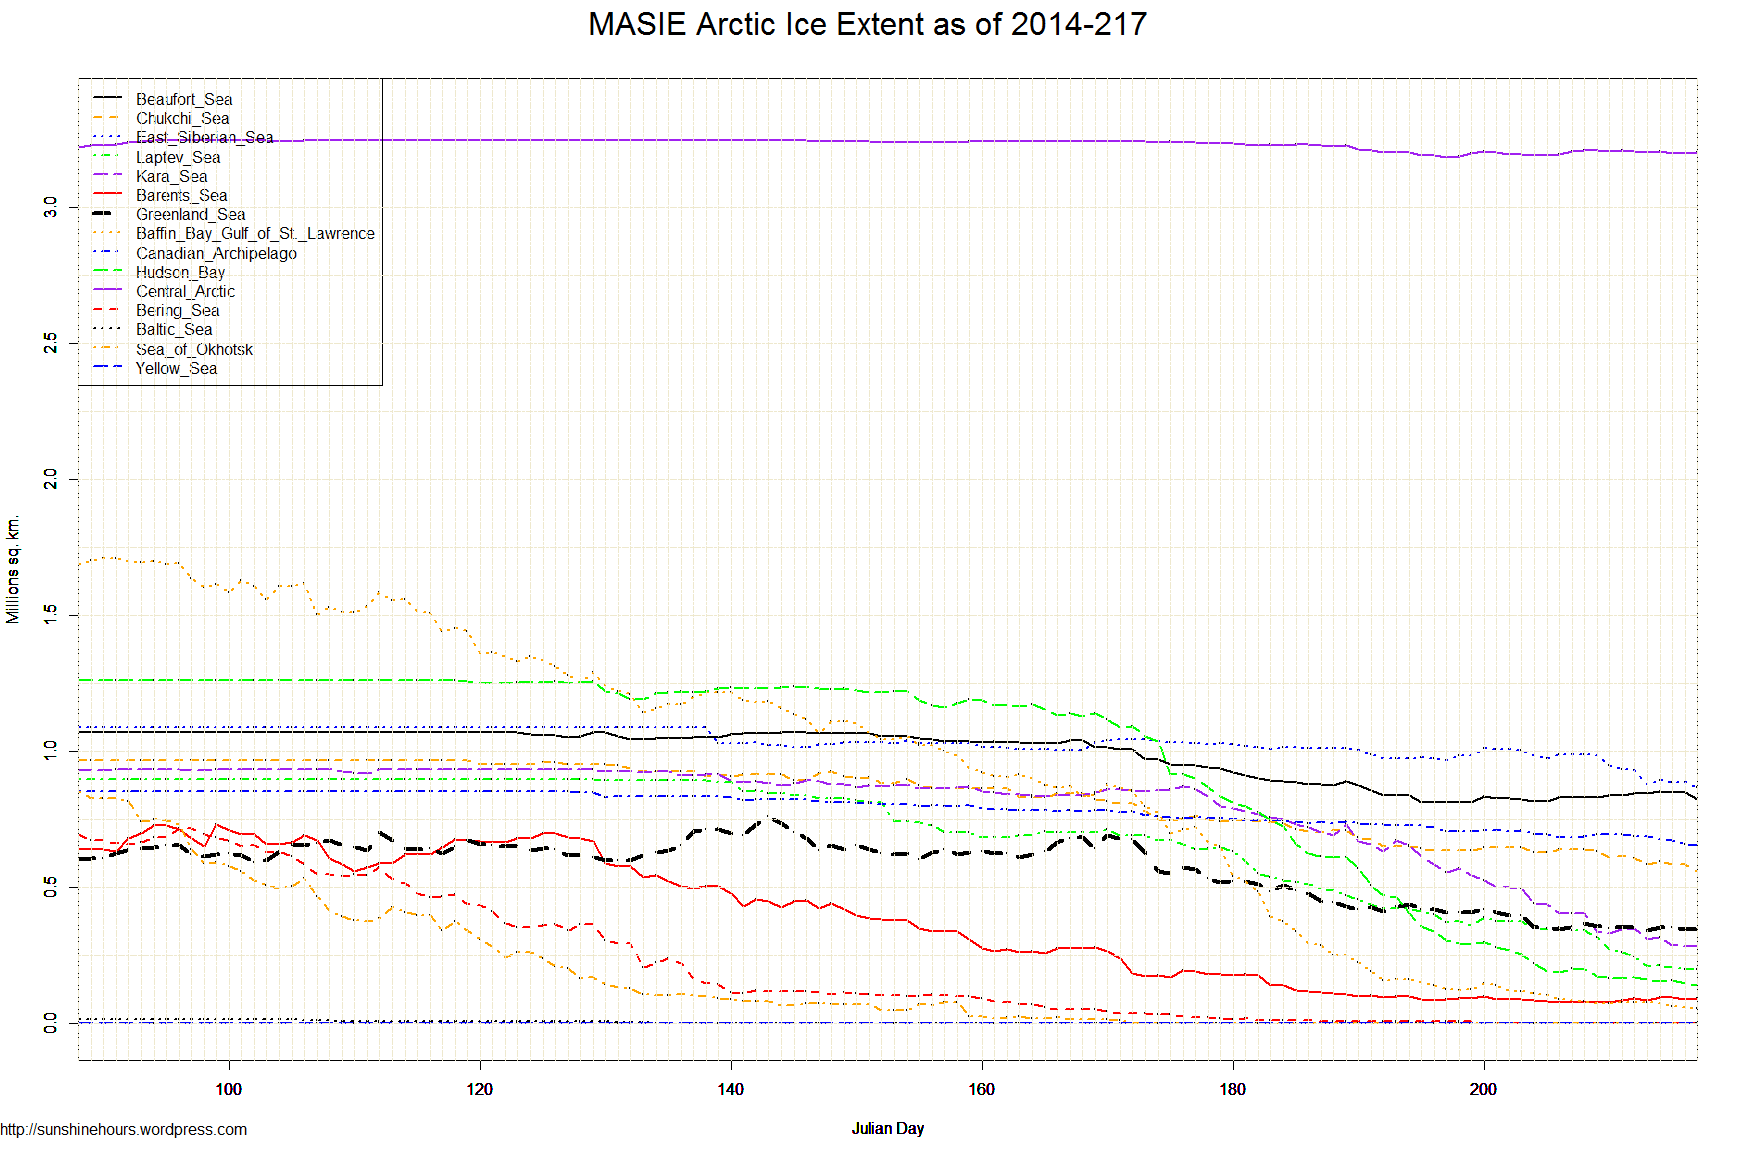
Aug 8 2014 MASIE Update – Steady Melting … but the Central Arctic is barely changing. In fact it is actually 4,463 sq km higher than it was 14 days ago.
NOTE: NSIDC/MASIE data for day 215 was missing (I assume for the same reason NSIDC data stopped being updated) and NSIDC were quick to fix it.
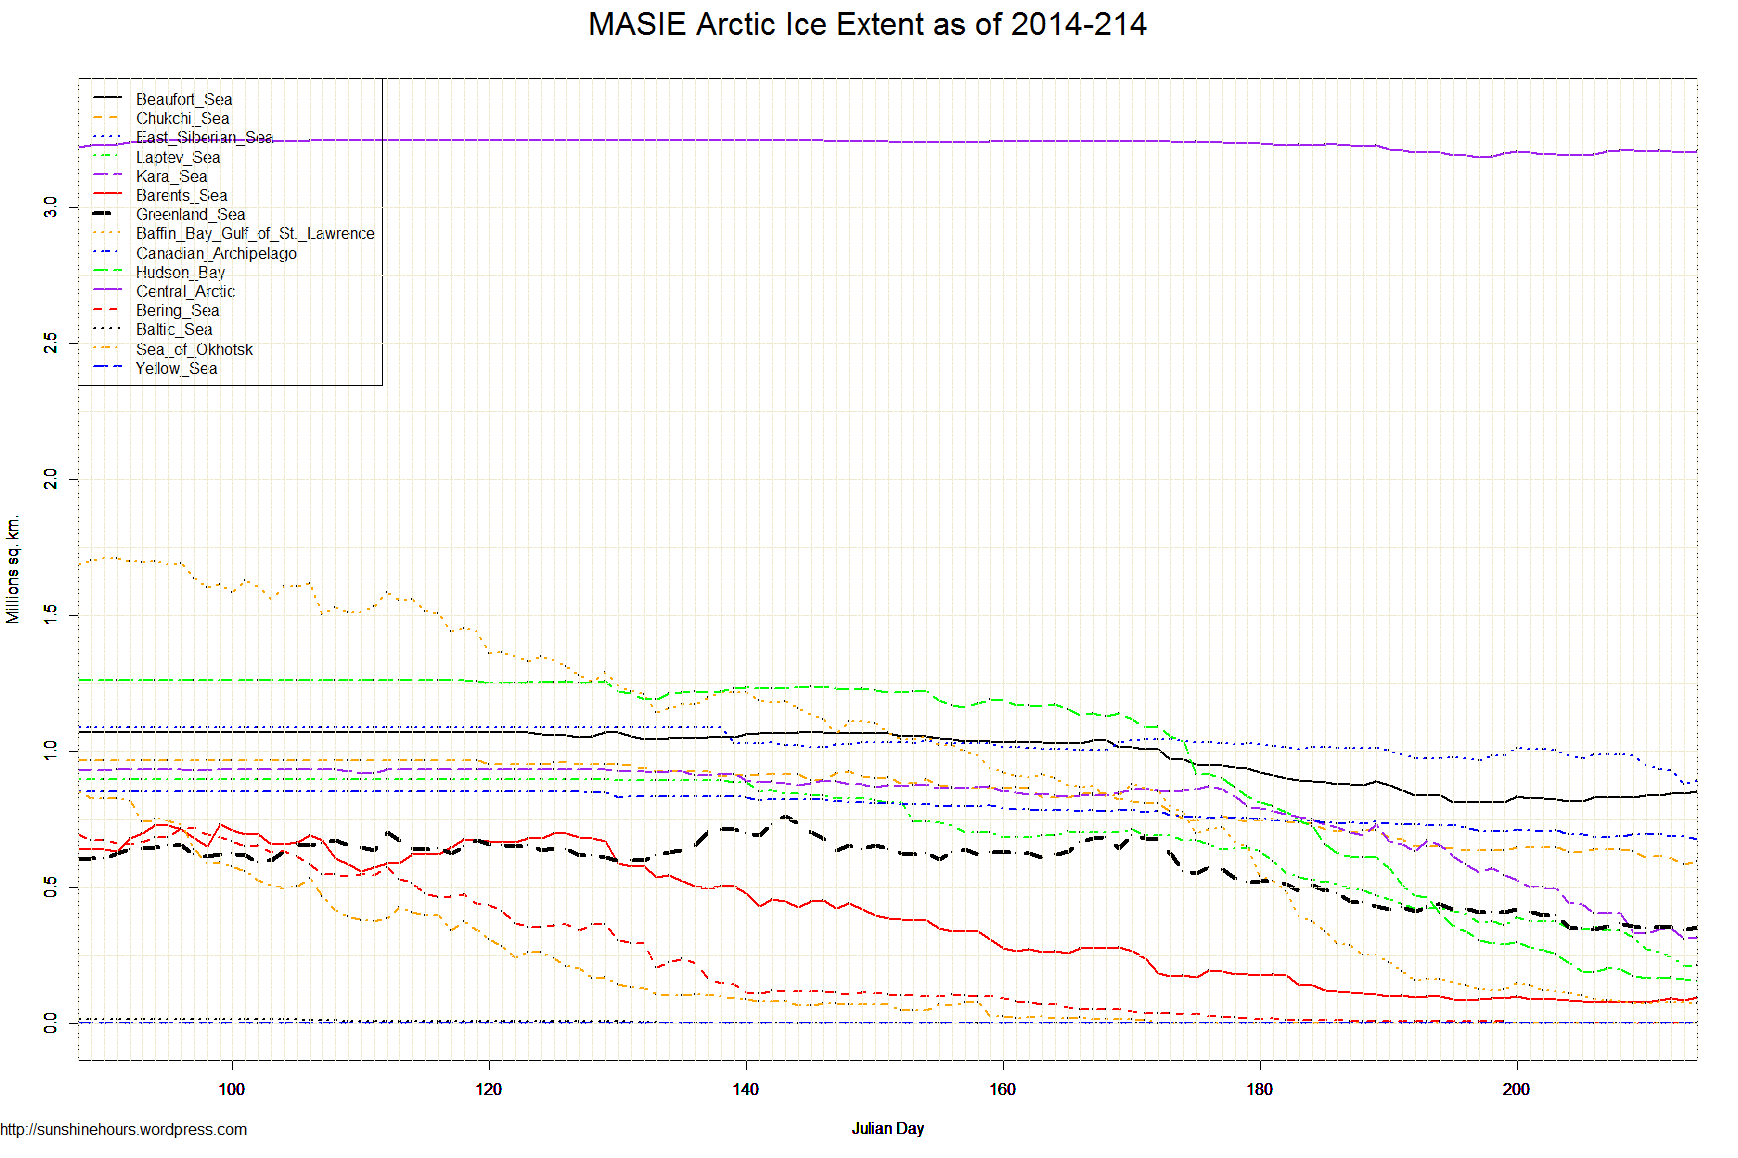
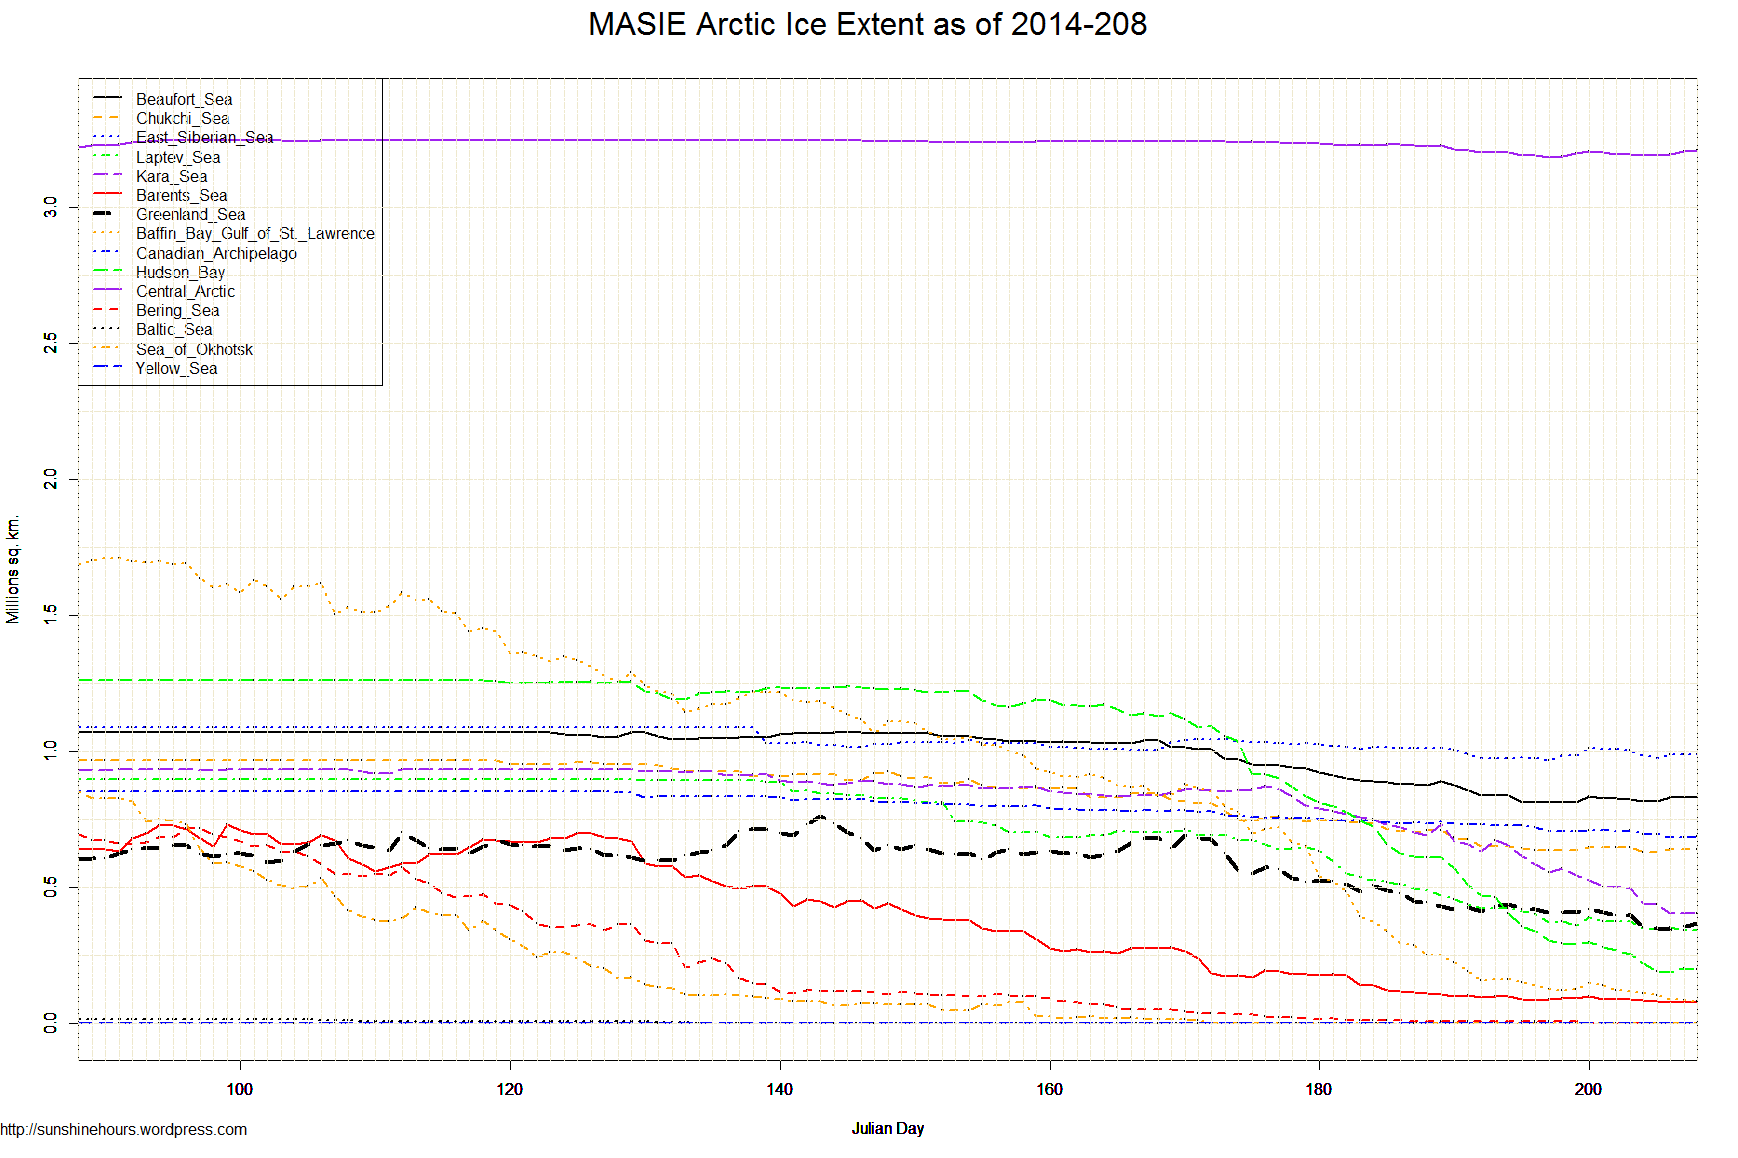
Data here. Click for bigger.

| Region | 130 days ago | End | Last 129 | Last 28 | Last 14 | Last 7 | Last 3 | Last 1 |
| Beaufort Sea | 1,070,445 | 822,445 | -248,000 | -69,244 | -3,166 | -17,569 | -31,204 | -28,565 |
| Chukchi Sea | 966,006 | 561,262 | -404,744 | -147,978 | -86,115 | -50,374 | -34,264 | -22,355 |
| East Siberian Sea | 1,087,137 | 868,784 | -218,353 | -144,199 | -137,194 | -79,372 | -26,721 | -17,484 |
| Hudson Bay | 1,260,903 | 140,166 | -1,120,738 | -470,713 | -113,117 | -25,550 | -14,703 | -6,106 |
| Canadian Archipelago | 853,214 | 656,561 | -196,653 | -87,247 | -53,545 | -39,432 | -21,661 | -3,203 |
| Baffin Bay Gulf of St. Lawrence | 1,688,530 | 55,677 | -1,632,853 | -195,060 | -61,857 | -18,821 | -16,871 | -3,105 |
| Kara Sea | 933,859 | 282,868 | -650,992 | -448,132 | -214,643 | -47,588 | -33,220 | 0 |
| Bering Sea | 697,324 | 0 | -697,324 | -8,943 | -1,339 | 0 | 0 | 0 |
| Baltic Sea | 15,337 | 0 | -15,337 | 0 | 0 | 0 | 0 | 0 |
| Sea of Okhotsk | 853,240 | 0 | -853,240 | 0 | 0 | 0 | 0 | 0 |
| Yellow Sea | 0 | 0 | 0 | 0 | 0 | 0 | 0 | 0 |
| Greenland Sea | 603,416 | 347,046 | -256,369 | -85,109 | -49,343 | -2,950 | -4,984 | 1,032 |
| Laptev Sea | 897,845 | 199,784 | -698,061 | -272,530 | -177,737 | -73,430 | -13,255 | 1,470 |
| Central Arctic | 3,221,921 | 3,200,691 | -21,230 | -26,401 | 4,463 | -6,564 | -4,297 | 1,962 |
| Barents Sea | 645,917 | 94,317 | -551,600 | -14,868 | 3,765 | 17,641 | -301 | 4,026 |
| Northern Hemisphere (Total) | 14,805,115 | 7,230,743 | -7,574,371 | -1,970,795 | -889,828 | -344,008 | -201,479 | -72,329 |
| NH (Average Loss per Day) | -58,264 | -70,386 | -63,559 | -49,144 | -67,160 | -72,329 |