After a few days of data problems on NOAA’s side the posts resume.


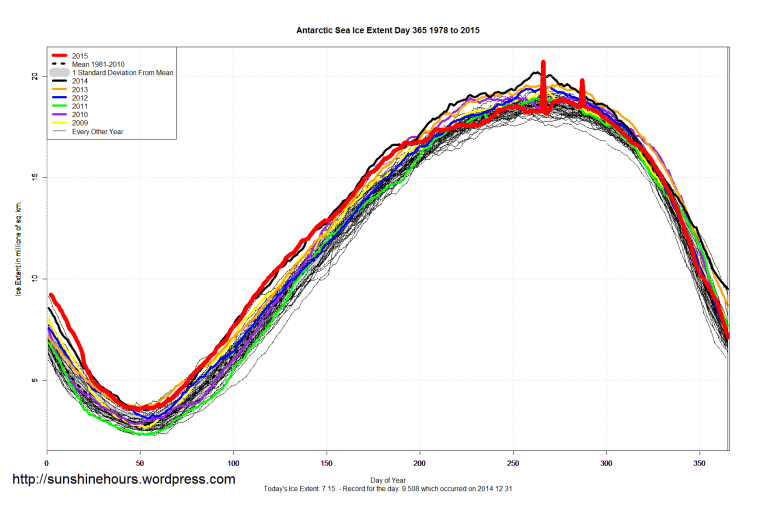
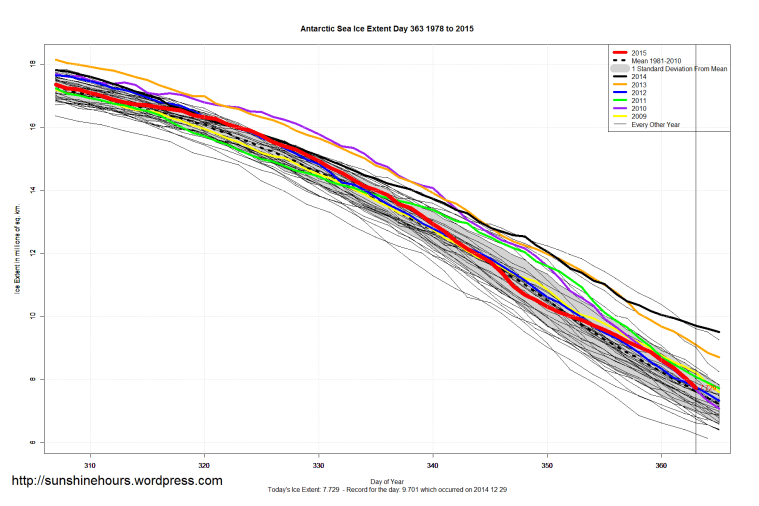
As regular readers of this blog knows, there are two weird spikes in the Antarctic data that the NOAA never corrected.
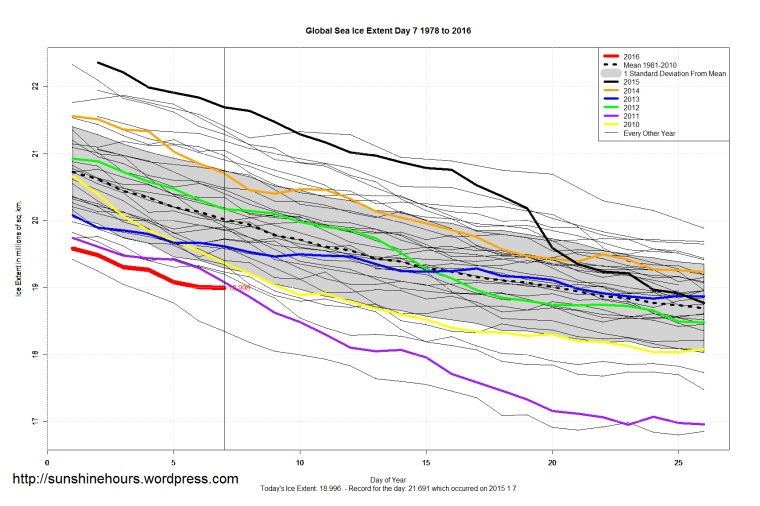
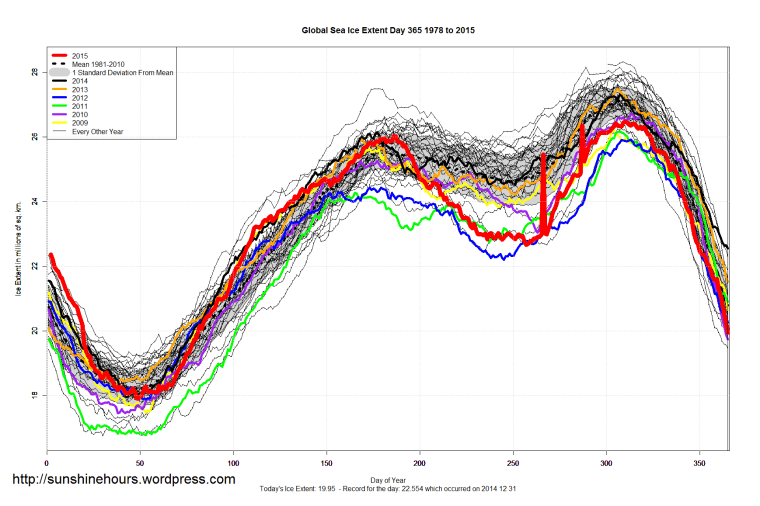
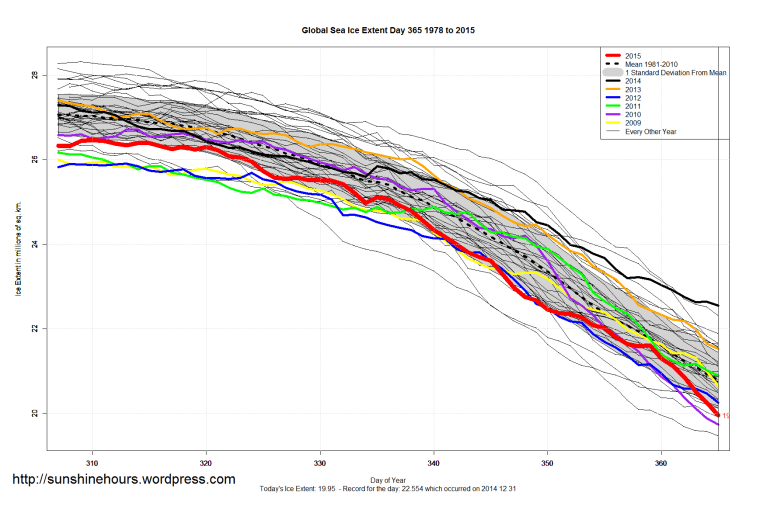
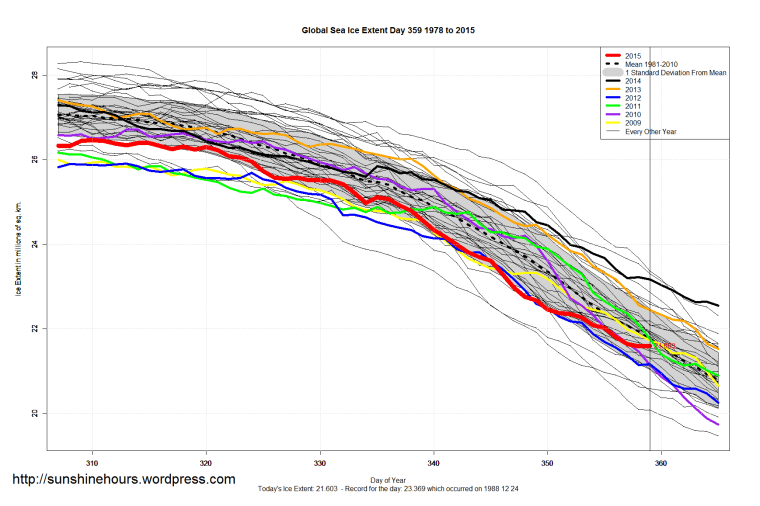
Since this is the Global Summary, the Antarctic Spikes do matter.
The only value that changed is the Avg Anomaly for 2015 was -0.25 with the spike and -0.26 without the spike.
This is the summary for 2015:
Lowest Minimum 16.766 2006
Highest Minimum 19.16 1979
Lowest day of Minimum 30 2006
Highest day of Minimum 63 1991
Lowest Maximum 25.914 2012
Highest Maximum 28.151 1980
Lowest day of Maximum 178 1979
Highest day of Maximum 322 1992
| Year | Min | Max | day of Max | day of Min | Avg Anomaly |
| 1979 | 19.16 | 27.49 | 178 | 38 | 0.8 |
| 1980 | 18.62 | 28.151 | 307 | 57 | 0.38 |
| 1981 | 18.248 | 27.531 | 291 | 45 | 0.36 |
| 1982 | 18.819 | 27.871 | 302 | 42 | 0.86 |
| 1983 | 18.889 | 27.918 | 307 | 41 | 0.51 |
| 1984 | 17.79 | 27.245 | 316 | 40 | 0.14 |
| 1985 | 17.979 | 27.636 | 306 | 50 | 0.38 |
| 1986 | 18.873 | 27.023 | 317 | 45 | 0.08 |
| 1987 | 19.064 | 27.157 | 317 | 46 | 0.46 |
| 1988 | 18.197 | 27.872 | 319 | 45 | 0.46 |
| 1989 | 18.038 | 27.536 | 299 | 48 | 0.17 |
| 1990 | 18.407 | 27.407 | 294 | 46 | -0.12 |
| 1991 | 18.003 | 27.088 | 291 | 63 | 0.07 |
| 1992 | 18.012 | 27.608 | 322 | 60 | 0.29 |
| 1993 | 17.877 | 27.994 | 310 | 57 | 0.12 |
| 1994 | 18.621 | 28 | 309 | 46 | 0.56 |
| 1995 | 18.543 | 27.135 | 306 | 46 | -0.01 |
| 1995 | 18.543 | 27.135 | 306 | 45 | -0.01 |
| 1996 | 17.844 | 27.505 | 293 | 57 | 0.39 |
| 1997 | 17.705 | 27.047 | 310 | 57 | -0.17 |
| 1998 | 18.521 | 27.603 | 297 | 47 | 0.27 |
| 1999 | 17.983 | 27.626 | 295 | 62 | 0.23 |
| 2000 | 17.642 | 26.972 | 302 | 49 | 0.04 |
| 2001 | 18.602 | 26.748 | 319 | 38 | 0.05 |
| 2002 | 18.123 | 26.83 | 297 | 55 | -0.64 |
| 2003 | 18.781 | 27.105 | 306 | 37 | 0.14 |
| 2004 | 18.341 | 27.094 | 316 | 51 | -0.01 |
| 2005 | 17.137 | 27.383 | 308 | 38 | -0.62 |
| 2006 | 16.766 | 27.121 | 298 | 30 | -0.99 |
| 2007 | 17.238 | 26.257 | 308 | 47 | -1.06 |
| 2008 | 18.488 | 27.312 | 310 | 46 | 0 |
| 2009 | 17.471 | 26.2 | 303 | 53 | -0.24 |
| 2010 | 17.467 | 26.72 | 313 | 38 | -0.4 |
| 2011 | 16.789 | 26.173 | 307 | 53 | -1.24 |
| 2012 | 17.891 | 25.914 | 313 | 53 | -0.81 |
| 2013 | 18.295 | 27.49 | 306 | 37 | 0.2 |
| 2014 | 17.957 | 27.3 | 307 | 43 | 0.34 |
| 2015 | 17.914 | 26.473 | 310 | 49 | -0.25 / -0.26 |
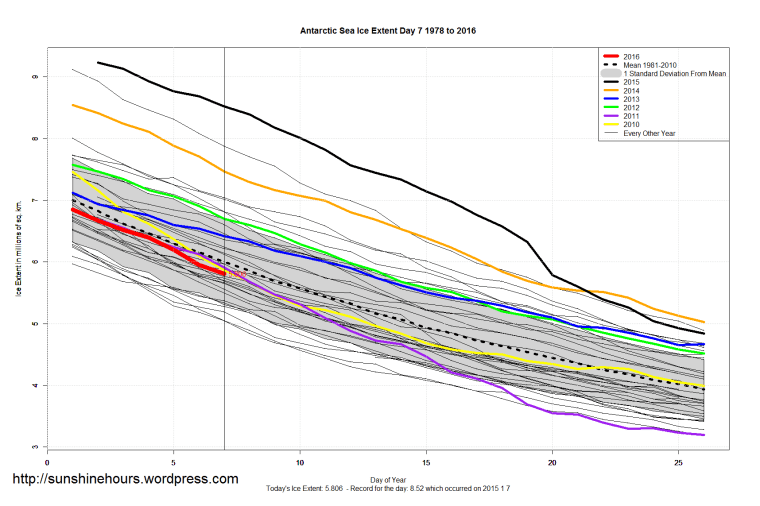
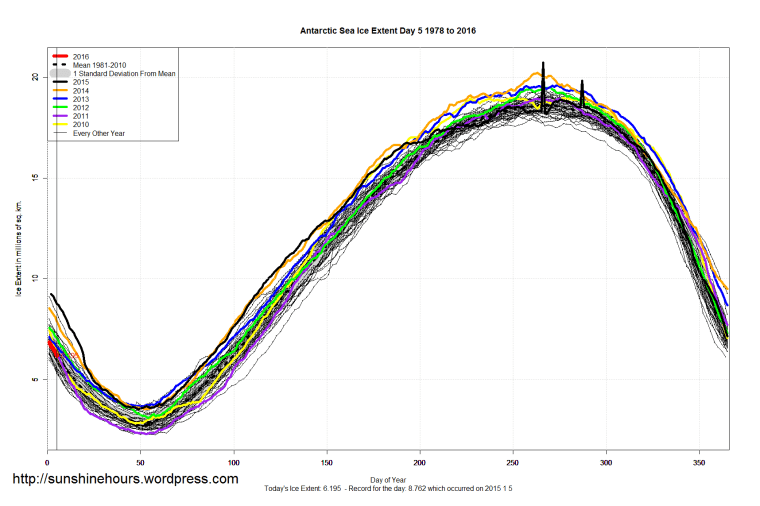
As regular readers of this blog knows, there are two weird spikes in the Antarctic data that the NOAA never corrected.
I will show both sets of data: With spikes and with spikes averaged away by replacing them with the data from the day before and day after averaged.
This is the summary for 2015 if the spikes are not included:
Lowest Minimum 2.264 1997
Highest Minimum 3.692 2008
Lowest day of Minimum 43 1994
Highest day of Minimum 65 1986
Lowest Maximum 18.027 1986
Highest Maximum 20.201 2014
Lowest day of Maximum 243 1994
Highest day of Maximum 277 1988
| Year | Min | Max | day of Max | day of Min | Avg Anomaly |
| 1979 | 2.915 | 18.368 | 256 | 48 | 0.04 |
| 1980 | 2.527 | 19.092 | 267 | 57 | -0.39 |
| 1981 | 2.695 | 18.86 | 261 | 51 | -0.21 |
| 1982 | 2.893 | 18.551 | 246 | 52 | -0.02 |
| 1983 | 2.847 | 18.811 | 263 | 55 | -0.25 |
| 1984 | 2.383 | 18.378 | 266 | 58 | -0.2 |
| 1985 | 2.602 | 18.933 | 254 | 50 | -0.04 |
| 1986 | 2.954 | 18.027 | 261 | 65 | -0.55 |
| 1987 | 3.016 | 18.524 | 258 | 52 | -0.24 |
| 1988 | 2.639 | 18.785 | 277 | 55 | -0.14 |
| 1989 | 2.723 | 18.274 | 266 | 51 | -0.23 |
| 1990 | 2.784 | 18.379 | 273 | 53 | -0.24 |
| 1991 | 2.554 | 18.671 | 273 | 58 | -0.11 |
| 1992 | 2.492 | 18.467 | 255 | 54 | -0.24 |
| 1993 | 2.281 | 18.71 | 263 | 50 | -0.23 |
| 1994 | 3.083 | 18.827 | 243 | 43 | 0.12 |
| 1995 | 3.33 | 18.736 | 269 | 55 | 0.15 |
| 1996 | 2.597 | 18.831 | 267 | 56 | 0.13 |
| 1997 | 2.264 | 18.792 | 265 | 58 | -0.26 |
| 1998 | 2.772 | 19.244 | 258 | 56 | 0.08 |
| 1999 | 2.707 | 18.981 | 273 | 51 | 0.11 |
| 2000 | 2.582 | 19.159 | 272 | 49 | 0.11 |
| 2001 | 3.441 | 18.494 | 271 | 50 | 0.02 |
| 2002 | 2.697 | 18.116 | 252 | 51 | -0.43 |
| 2003 | 3.626 | 18.68 | 268 | 48 | 0.32 |
| 2004 | 3.259 | 19.124 | 252 | 51 | 0.32 |
| 2005 | 2.804 | 19.295 | 272 | 49 | 0.04 |
| 2006 | 2.487 | 19.36 | 264 | 51 | -0.19 |
| 2007 | 2.723 | 19.086 | 272 | 50 | 0.03 |
| 2008 | 3.692 | 18.298 | 247 | 51 | 0.6 |
| 2009 | 2.671 | 19.299 | 267 | 53 | 0.39 |
| 2010 | 2.842 | 18.998 | 249 | 47 | 0.45 |
| 2011 | 2.319 | 18.954 | 266 | 53 | -0.15 |
| 2012 | 3.111 | 19.478 | 266 | 54 | 0.36 |
| 2013 | 3.679 | 19.608 | 274 | 50 | 0.87 |
| 2014 | 3.548 | 20.201 | 263 | 52 | 1.12 |
| 2015 | 3.532 | 18.874 | 275 | 49 | 0.74 |
This is the summary for 2015 if the spikes are included:
Lowest Minimum 2.264 1997
Highest Minimum 3.692 2008
Lowest day of Minimum 43 1994
Highest day of Minimum 65 1986
Lowest Maximum 18.027 1986
Highest Maximum 20.723 2015
Lowest day of Maximum 243 1994
Highest day of Maximum 277 1988
| Year | Min | Max | day of Max | day of Min | Avg Anomaly |
| 1979 | 2.915 | 18.368 | 256 | 48 | 0.04 |
| 1980 | 2.527 | 19.092 | 267 | 57 | -0.39 |
| 1981 | 2.695 | 18.86 | 261 | 51 | -0.21 |
| 1982 | 2.893 | 18.551 | 246 | 52 | -0.02 |
| 1983 | 2.847 | 18.811 | 263 | 55 | -0.25 |
| 1984 | 2.383 | 18.378 | 266 | 58 | -0.2 |
| 1985 | 2.602 | 18.933 | 254 | 50 | -0.04 |
| 1986 | 2.954 | 18.027 | 261 | 65 | -0.55 |
| 1987 | 3.016 | 18.524 | 258 | 52 | -0.24 |
| 1988 | 2.639 | 18.785 | 277 | 55 | -0.14 |
| 1989 | 2.723 | 18.274 | 266 | 51 | -0.23 |
| 1990 | 2.784 | 18.379 | 273 | 53 | -0.24 |
| 1991 | 2.554 | 18.671 | 273 | 58 | -0.11 |
| 1992 | 2.492 | 18.467 | 255 | 54 | -0.24 |
| 1993 | 2.281 | 18.71 | 263 | 50 | -0.23 |
| 1994 | 3.083 | 18.827 | 243 | 43 | 0.12 |
| 1995 | 3.33 | 18.736 | 269 | 55 | 0.15 |
| 1996 | 2.597 | 18.831 | 267 | 56 | 0.13 |
| 1997 | 2.264 | 18.792 | 265 | 58 | -0.26 |
| 1998 | 2.772 | 19.244 | 258 | 56 | 0.08 |
| 1999 | 2.707 | 18.981 | 273 | 51 | 0.11 |
| 2000 | 2.582 | 19.159 | 272 | 49 | 0.11 |
| 2001 | 3.441 | 18.494 | 271 | 50 | 0.02 |
| 2002 | 2.697 | 18.116 | 252 | 51 | -0.43 |
| 2003 | 3.626 | 18.68 | 268 | 48 | 0.32 |
| 2004 | 3.259 | 19.124 | 252 | 51 | 0.32 |
| 2005 | 2.804 | 19.295 | 272 | 49 | 0.04 |
| 2006 | 2.487 | 19.36 | 264 | 51 | -0.19 |
| 2007 | 2.723 | 19.086 | 272 | 50 | 0.03 |
| 2008 | 3.692 | 18.298 | 247 | 51 | 0.6 |
| 2009 | 2.671 | 19.299 | 267 | 53 | 0.39 |
| 2010 | 2.842 | 18.998 | 249 | 47 | 0.45 |
| 2011 | 2.319 | 18.954 | 266 | 53 | -0.15 |
| 2012 | 3.111 | 19.478 | 266 | 54 | 0.36 |
| 2013 | 3.679 | 19.608 | 274 | 50 | 0.87 |
| 2014 | 3.548 | 20.201 | 263 | 52 | 1.12 |
| 2015 | 3.532 | 20.723 | 266 | 49 | 0.74 |
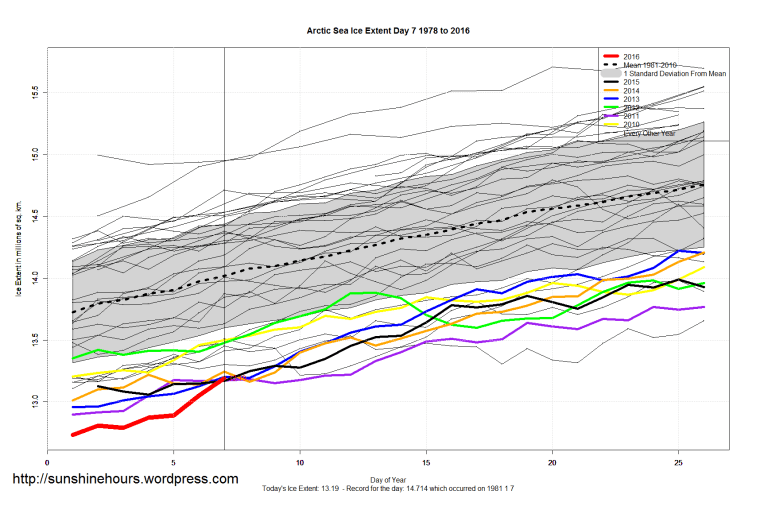
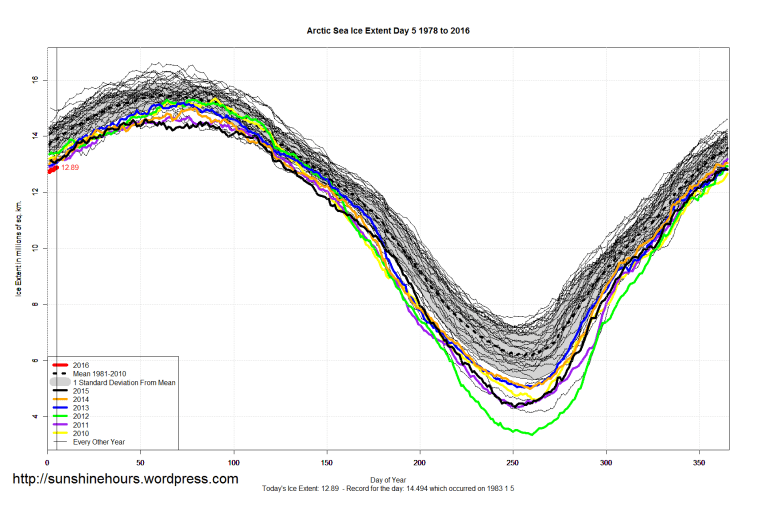
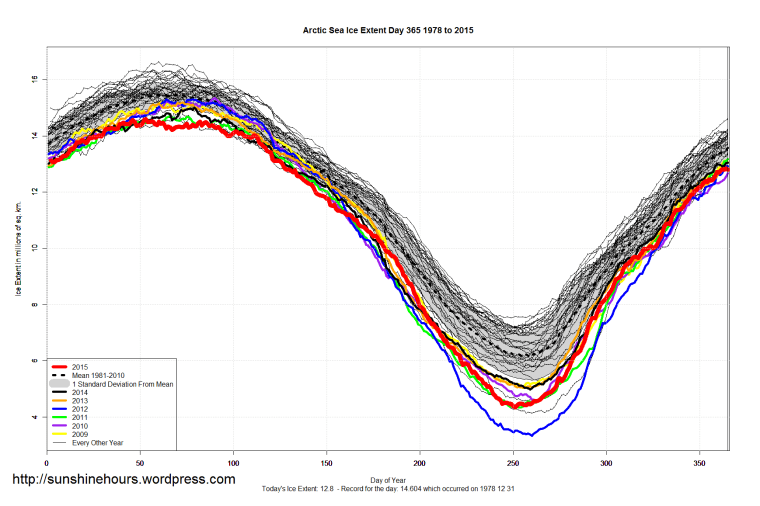
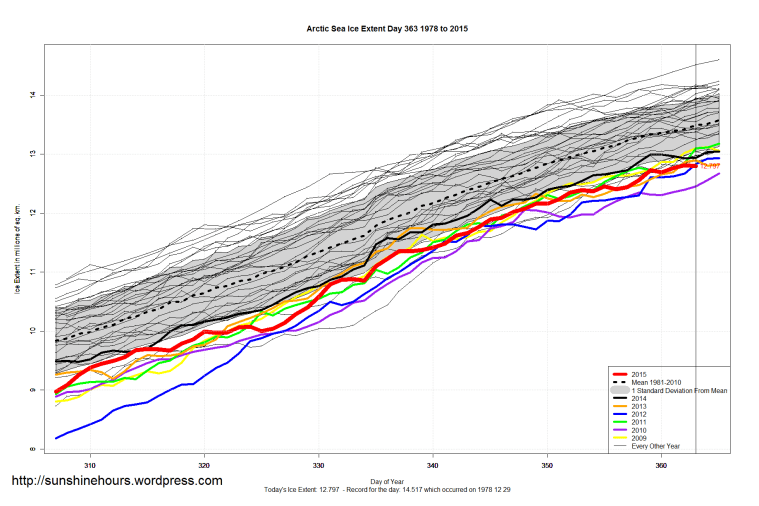
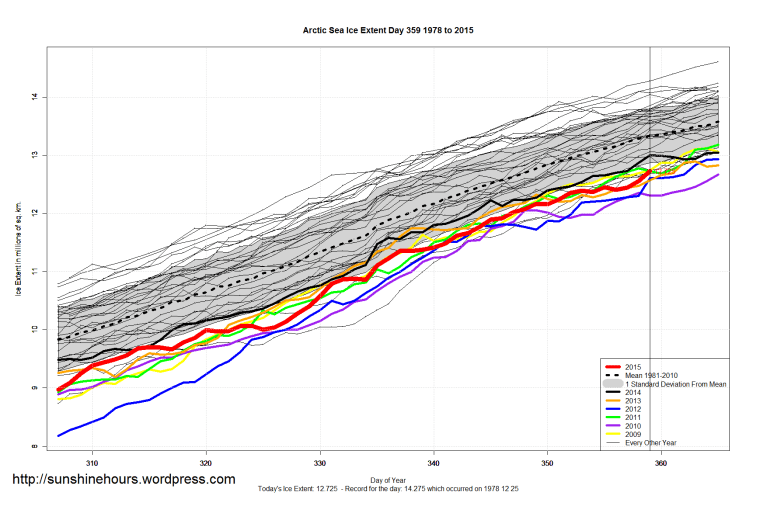
Arctic 2015 Set one all-time record. It was 4th lowest average anomaly.
Lowest Minimum 3.34 2012
Highest Minimum 7.533 1980
Lowest day of Minimum 245 1987
Highest day of Minimum 265 1989
Lowest Maximum 14.595 2015
Highest Maximum 16.635 1979
Lowest day of Maximum 52 1987
Highest day of Maximum 90 1995
| Year | Min | Max | day of Max | day of Min | Avg Anomaly |
| 1979 | 6.895 | 16.635 | 60 | 264 | 0.69 |
| 1980 | 7.533 | 16.302 | 65 | 249 | 0.7 |
| 1981 | 6.902 | 15.801 | 73 | 253 | 0.5 |
| 1982 | 7.16 | 16.325 | 58 | 256 | 0.81 |
| 1983 | 7.204 | 16.412 | 73 | 251 | 0.7 |
| 1984 | 6.396 | 15.809 | 78 | 260 | 0.27 |
| 1985 | 6.486 | 16.163 | 76 | 252 | 0.36 |
| 1986 | 7.122 | 16.158 | 69 | 249 | 0.57 |
| 1987 | 6.89 | 16.293 | 52 | 245 | 0.62 |
| 1988 | 7.048 | 16.309 | 70 | 255 | 0.53 |
| 1989 | 6.888 | 15.766 | 65 | 265 | 0.33 |
| 1990 | 6.011 | 16.249 | 71 | 264 | 0.06 |
| 1991 | 6.259 | 15.647 | 56 | 259 | 0.11 |
| 1992 | 7.159 | 15.576 | 72 | 251 | 0.47 |
| 1993 | 6.161 | 16.048 | 72 | 256 | 0.29 |
| 1994 | 6.934 | 15.77 | 52 | 248 | 0.38 |
| 1995 | 5.99 | 15.384 | 90 | 250 | -0.22 |
| 1996 | 7.147 | 15.484 | 52 | 254 | 0.2 |
| 1997 | 6.602 | 15.684 | 79 | 246 | 0.03 |
| 1998 | 6.293 | 16.07 | 56 | 260 | 0.12 |
| 1999 | 5.676 | 15.627 | 89 | 255 | 0.06 |
| 2000 | 5.943 | 15.498 | 63 | 255 | -0.13 |
| 2001 | 6.567 | 15.742 | 63 | 262 | -0.04 |
| 2002 | 5.625 | 15.624 | 68 | 261 | -0.27 |
| 2003 | 5.969 | 15.629 | 79 | 260 | -0.24 |
| 2004 | 5.77 | 15.3 | 70 | 262 | -0.4 |
| 2005 | 5.314 | 14.993 | 68 | 263 | -0.73 |
| 2006 | 5.746 | 14.777 | 70 | 257 | -0.86 |
| 2007 | 4.147 | 14.842 | 69 | 257 | -1.16 |
| 2008 | 4.548 | 15.354 | 58 | 262 | -0.66 |
| 2009 | 5.047 | 15.195 | 61 | 255 | -0.7 |
| 2010 | 4.59 | 15.351 | 90 | 262 | -0.92 |
| 2011 | 4.333 | 14.704 | 66 | 251 | -1.15 |
| 2012 | 3.34 | 15.307 | 78 | 260 | -1.23 |
| 2013 | 5.04 | 15.196 | 73 | 256 | -0.74 |
| 2014 | 4.988 | 15.007 | 79 | 259 | -0.84 |
| 2015 | 4.341 | 14.595 | 53 | 251 | -1.05 |