NOAA May 2013 – Southeast States Were Cold!!!

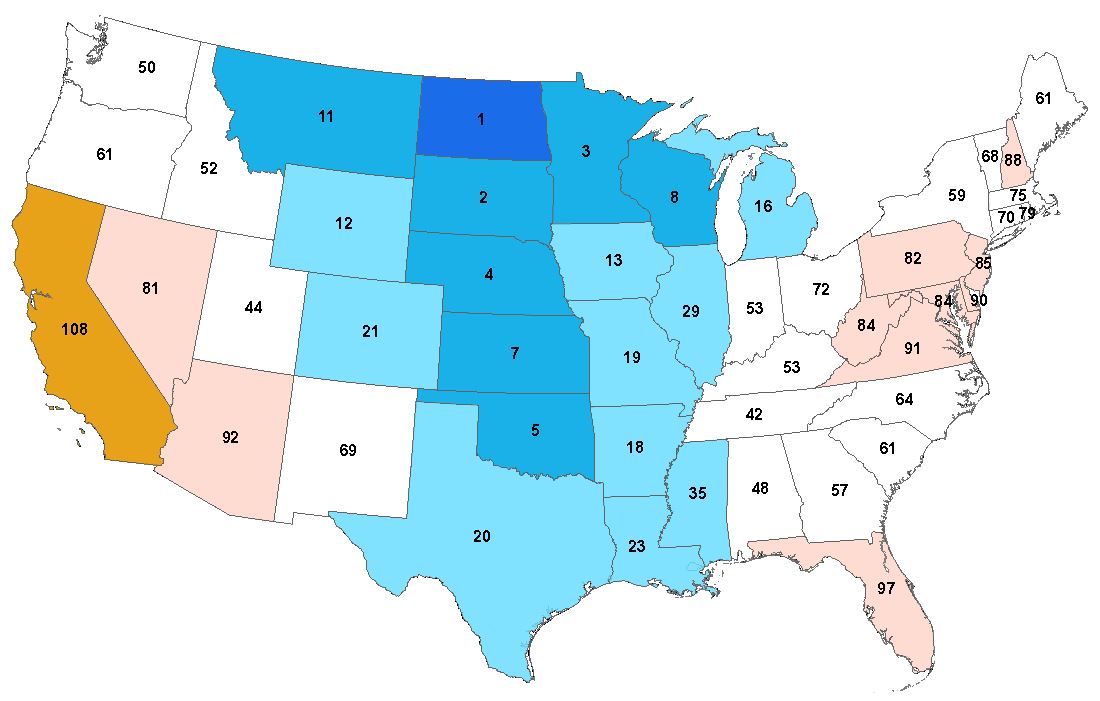
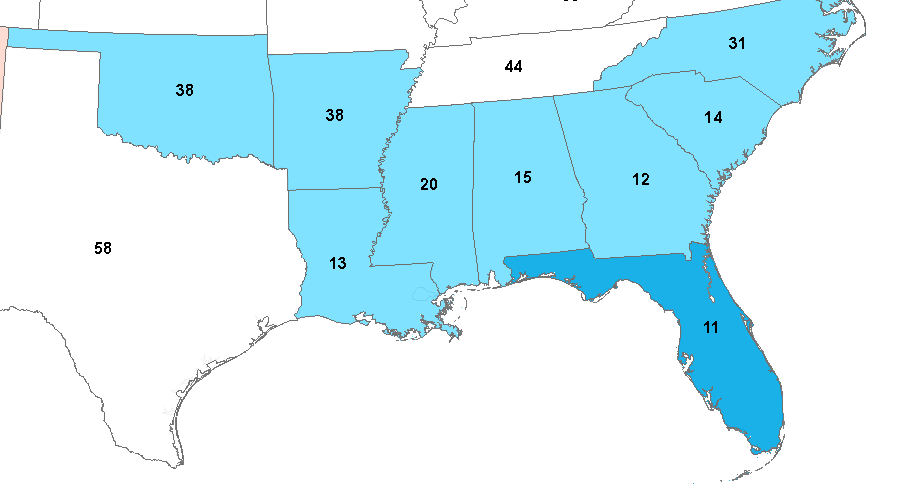
The Southeast states were cold in May 2013 according to the NOAA. Florida had the 11th coldest May in its history. Which means 108 were warmer.

Georgia had its 12th coldest, Louisiana 13th, South Carolina 14th and Alabama 15th.

Brrr.

NOAA_MAY_2013_SouthEast

None of the states were ranked higher than 99 out of 119. Which means only California snuck into the top 20 warmest May’s.

Rank:  (1=Coldest & 119 = Warmest)

State May_2013 May Rank Coldest May Coldest May F
Florida 73.9 11 1940 72.5
Georgia 68.6 12 1997 66.8
Louisiana 71.4 13 1917 69.2
South Carolina 67.6 14 1997 65.8
Alabama 68.3 15 1976 65.2
Mississippi 69.2 20 1976 66
North Carolina 65.2 31 1917 62.1
Arkansas 67.4 38 1917 63.2
Oklahoma 66.9 38 1907 61.5
Minnesota 53.1 44 1907 44.3
Tennessee 65.2 44 1917 60.2
Virginia 62.6 44 1917 58.4
Missouri 63.5 50 1924 58
Missouri 63.5 50 1917 58
West Virginia 60.4 55 1997 54.3
Iowa 59.2 56 1907 52.7
Nebraska 58.4 57 1935 51.8
North Dakota 53.2 57 1907 43.3
Kansas 63.2 58 1917 56.7
South Dakota 55.7 58 1907 47.9
Texas 72.5 58 1907 67.3
Kentucky 64.6 59 1917 58.1
Wisconsin 55 61 1907 46.9
New Jersey 60.6 63 1917 53.5
Maryland 62.6 68 1967 56.5
Maryland 62.6 68 1917 56.5
Colorado 53.2 70 1917 45.4
Pennsylvania 59.1 72 1967 51
Illinois 63.7 75 1917 55.9
Nevada 56.7 75 1896 47
Utah 56.8 75 1917 49.1
Connecticut 58.3 76 1917 49.8
Maine 52.5 80 1967 44.3
Michigan 55.9 80 1907 44.7
Montana 52.9 80 1916 46.4
Montana 52.9 80 1927 46.4
New Hampshire 55.2 82 1917 45
New Mexico 61.6 83 1917 52.4
Massachusetts 57.6 84 1917 48.8
Oregon 54.2 84 1933 47.9
Wyoming 51.5 85 1917 43.2
Delaware 64.3 87 1917 56.2
Idaho 53.1 88 1896 45.5
Arizona 67.8 90 1917 58.6
Rhode Island 57.8 90 1917 48.1
Vermont 55.8 90 1917 44.8
Washington 55.5 91 1955 49.4
New York 57.4 93 1917 46.9
Indiana 64.4 94 1917 54.7
Ohio 63.1 95 1917 53.4
California 65.3 99 1933 56.1

NOAA 2013 – Brutally Cold Spring

What a brutal Spring. in the USA according to the NOAA.

Look at all those single digit rankings. Rank: (1 = Coldest and 119 = Warmest)

3rd coldest Spring out of 119 in Minnesota.

4th coldest in North and South Dakota. 5th coldest in Arkansas.

This should not be possible if AGW was real.

State Spring_2013 Spring Rank Coldest Spring Coldest Spring F
Minnesota 35.9 3 1950 34.43
North Dakota 33.83 4 1899 31.33
South Carolina 59.3 4 1960 58.87
Arkansas 57.33 5 1960 56.47
Alabama 60.1 6 1960 59.07
Georgia 60.67 6 1960 59.77
Mississippi 60.53 6 1960 59.97
Iowa 43.87 7 1960 42.83
Louisiana 63.7 7 1931 61.9
Missouri 51.17 7 1960 49.77
North Carolina 55.93 7 1960 54.9
Tennessee 54.9 8 1960 52.93
South Dakota 40.23 9 1950 37.6
Wisconsin 38.8 9 1950 37.3
Oklahoma 56.27 11 1924 54.3
Kansas 50.5 12 1924 48.3
Florida 68.1 13 1931 66.4
Kentucky 52.8 14 1960 50.53
Nebraska 44.9 16 1917 42.97
Illinois 49.17 19 1960 46.6
Virginia 53.03 34 1960 51.03
West Virginia 49.87 34 1960 46.8
Michigan 40.97 39 1950 37.6
Michigan 40.97 39 1940 37.6
Indiana 50.03 40 1960 46.53
Texas 64.2 40 1931 60.13
Colorado 42.73 42 1917 37.23
Montana 40.57 45 1917 35.5
Maryland 51.77 50 1940 48.63
Wyoming 39.67 57 1917 32.37
Ohio 49.5 58 1926 45.07
Pennsylvania 47.47 62 1984 43.57
New Jersey 50.3 63 1940 46.27
Connecticut 47.1 71 1967 42.13
New York 43.83 75 1926 38.57
Delaware 53.33 76 1940 48.63
Utah 47.8 76 1917 39.47
Massachusetts 46.17 77 1967 40.97
Washington 48.07 82 1955 41.5
Oregon 47.4 83 1917 42
Idaho 43.97 85 1917 36.17
Rhode Island 47.5 85 1917 40.97
New Mexico 53.47 92 1917 47.53
Maine 40.83 93 1926 33.7
Vermont 42.67 94 1926 34.03
Nevada 49.93 97 1917 41.17
New Hampshire 43.43 98 1926 35.4
Arizona 60.87 108 1917 52.4
California 60.13 113 1917 52.37

NOAA May 2013 – 39 Other Mays Were Warmer Including 1896,1897,1900,1902,1911,1914 ….

The NOAA ranked May 2013 80th out of 119. Which means 39 other Mays were warmer.

Here they are: 1896,1897,1900,1902,1911,1914,1922,1928,1934,1936,1937,1939,1941,1944,1949,1955,1956,1958,1962,1964,1969,1970,1977,1985,1986,1987,1988,1991,1992,1996,1998,2000,2001,2003,2004,2006,2007,2009,2012

May of 2013 was 3.5F colder than 1934 and even 1.24F colder than 1896.

May in the USA has been cooling at -0.55F per decade.

NOAA_MAY_2013

Coldest April Ever in North Dakota – NOAA USA April 2013 (updated ranking table)

After looking at the national ranking (23rd coldest) it is time to look at the State data:

In the last 119 Aprils, it was the coldest April ever in North Dakota. 2nd coldest ever in South Dakota. 3rd coldest ever in Minnesota, 4th coldest ever in Nebraska, 7th coldest ever in Oklahoma, 8th coldest ever in Wisconsin.

North Dakota was 18.5F colder than the warmest April (which occurred in 1915).

26 out of 48 states had an April ranked below 60. Which means they were ranked in the bottom half of the 119 Aprils measured by the NOAA.

Only one state (California) had an April in the top 20.

NOAA_April_2013_Map

State Apr 2013 Avg F Apr Rank (1=Coldest) Coldest Apr Coldest Apr F
North Dakota 31 1 2013 31
South Dakota 36.7 2 1920 35.6
Minnesota 33.9 3 1950 32.5
Nebraska 42.3 4 1920 38.9
Oklahoma 54.6 5 1983 53.2
Kansas 48.3 7 1983 46.9
Wisconsin 37.6 8 1950 35.2
Montana 37.7 11 1975 33.7
Wyoming 35.8 12 1920 32.2
Iowa 43.7 13 1907 40.1
Michigan 39.1 16 1907 35
Arkansas 58.4 18 1907 54.1
Missouri 51.8 19 1907 47.6
Texas 63.1 20 1997 59.7
Colorado 40.4 21 1920 34.3
Louisiana 64.5 23 1983 61.4
Illinois 49.8 29 1907 43.2
Mississippi 62.2 35 1983 58.4
Tennessee 56.9 42 1907 50.6
Utah 45.6 44 1975 39.9
Alabama 62.1 48 1901 57.4
Washington 46.7 50 1955 41.5
Idaho 42.5 52 1975 36.5
Indiana 50.7 53 1907 42.2
Kentucky 54.9 53 1907 46.9
Georgia 63.1 57 1901 57.4
New York 43.5 59 1943 36.8
Maine 39.3 60 1926 33.2
South Carolina 62.1 60 1901 55.1
Oregon 46.3 61 1975 40.1
Oregon 46.3 61 1967 40.1
North Carolina 58.5 63 1907 51
Vermont 41.9 66 1926 33.3
Connecticut 47 68 1943 40
New Mexico 52.3 68 1973 45.8
Ohio 50.4 71 1907 41.3
Massachusetts 46.2 75 1943 40.3
Rhode Island 47.1 79 1907 40.9
Nevada 48.5 80 1967 38.6
Pennsylvania 49 80 1943 41.6
Maryland 53.7 82 1907 45.9
New Jersey 51.5 83 1907 44.5
West Virginia 52.9 83 1907 44.4
New Hampshire 43.3 87 1926 34.6
Arizona 59.7 89 1975 50.6
Virginia 56.2 89 1907 47.1
Delaware 54.5 90 1907 46.4
Florida 71.4 97 1987 65.1
Florida 71.4 97 1901 65.1
California 59.9 108 1967 46.5

Coldest April Ever in North Dakota – NOAA USA April 2013

After looking at the national ranking (23rd coldest) it is time to look at the State data:

In the last 119 Aprils, it was the coldest April ever in North Dakota. 2nd coldest ever in South Dakota. 3rd coldest ever in Minnesota, 4th coldest ever in Nebraska, 7th coldest ever in Oklahoma, 8th coldest ever in Wisconsin.

North Dakota was 18.5F colder than the warmest April (which occurred in 1915).

26 out of 48 states had an April ranked below 60. Which means they were ranked in the bottom half of the 119 Aprils measured by the NOAA.

Only one state (California) had an April in the top 20.

NOAA_April_2013_Map

My rankings are below. You may ask yourself why the table rank doesn’t match the above map from the NOAA?

The answer is ties. NOAA (and I) are counting from 119 to 1 for data table. This is Nebraska (where the two months tied at 4th coldest are ranked 5th):

Nebraska_NOAA_April_2013_Rank

I try and keep my table in synch with NOAA’s table. But I will rethink that.

State Apr 2013 Average F. Apr Rank (Coldest = 1) Warmest April Warmest April Temp Difference
North Dakota 31 1 1915 49.5 18.5
South Dakota 36.7 2 1915 52 15.3
Minnesota 33.9 3 1987 50.2 16.3
Nebraska 42.3 5 1946 55 12.7
Oklahoma 54.6 6 1981 65.4 10.8
Kansas 48.3 7 1948 59.8 11.5
Wisconsin 37.6 8 2010 49.8 12.2
Montana 37.7 11 1910 49.1 11.4
Wyoming 35.8 12 1930 46.5 10.7
Iowa 43.7 14 1955 55.2 11.5
Michigan 39.1 16 1955 49.1 10
Missouri 51.8 20 1954 61.2 9.4
Arkansas 58.4 21 1925 66.6 8.2
Colorado 40.4 21 1981 49.3 8.9
Texas 63.1 22 1967 70.8 7.7
Louisiana 64.5 24 1981 71.3 6.8
Illinois 49.8 34 1955 58.2 8.4
Mississippi 62.2 36 1981 68.9 6.7
Utah 45.6 44 1989 52.4 6.8
Tennessee 56.9 45 1954 63.3 6.4
Washington 46.7 50 1926 52.8 6.1
Alabama 62.1 51 1896 67.9 5.8
Idaho 42.5 53 1987 49.5 7
Indiana 50.7 53 2010 57.3 6.6
Kentucky 54.9 54 1954 61.1 6.2
Georgia 63.1 57 1908 67.8 4.7
Maine 39.3 61 1910 44.5 5.2
New York 43.5 61 2010 49.6 6.1
Oregon 46.3 61 1926 52.7 6.4
South Carolina 62.1 61 1896 66.5 4.4
North Carolina 58.5 64 1954 62.5 4
Vermont 41.9 67 1921 47.2 5.3
New Mexico 52.3 69 1946 57.1 4.8
Connecticut 47 70 1921 51.9 4.9
Ohio 50.4 72 1955 55.5 5.1
Massachusetts 46.2 75 2010 50.4 4.2
Rhode Island 47.1 79 1976 51.1 4
Nevada 48.5 81 1992 53.4 4.9
Pennsylvania 49 81 1941 53.3 4.3
Maryland 53.7 84 2010 57.3 3.6
New Jersey 51.5 84 1921 55.6 4.1
West Virginia 52.9 84 1896 56.5 3.6
New Hampshire 43.3 88 1945 46.8 3.5
Delaware 54.5 90 1994 57.9 3.4
Virginia 56.2 91 1994 58.6 2.4
Arizona 59.7 92 2002 63 3.3
Florida 71.4 97 1947 74 2.6
California 59.9 108 1989 62.1 2.2

NOAA April 2013 – 23rd Coldest April Since 1895

According to the NOAA, April 2013 was the 23rd coldest April since 1895.

The following Aprils were warmer: 1895, 1896, 1897, 1898, 1899, 1900, 1902, 1903, 1905, 1906, 1908, 1910, 1911, 1912, 1913, 1914, 1915, 1916, 1919, 1921, 1922, 1923, 1924, 1925, 1926, 1927, 1929, 1930, 1931, 1932, 1933, 1934, 1936, 1937, 1938, 1939, 1940, 1941, 1942, 1943, 1945, 1946, 1947, 1948, 1949, 1951, 1952, 1954, 1955, 1957, 1958, 1959, 1960, 1962, 1963, 1964, 1965, 1966, 1967, 1968, 1969, 1971, 1972, 1974, 1976, 1977, 1978, 1979, 1980, 1981, 1985, 1986, 1987, 1988, 1989, 1990, 1991, 1992, 1993, 1994, 1996, 1998, 1999, 2000, 2001, 2002, 2003, 2004, 2005, 2006, 2007, 2008, 2009, 2010, 2011, 2012

April’s have been cooling at -.21F per Decade since 1998


NOAA_April_2013

The January-April period has been cooling at -.74F/decade since 1998

NOAA_January-April_2013

NOAA March 2013 – Coldest 25 March’s By State

25 Coldest March’s By State. Out of 119.

20xx Years Highlighted.

2013 Highlighted

Order by Coldest March to 25th Coldest

State Coldest
Alabama 1960 1915 1969 1947 1926 1941 1931 2013 1971 1914 1996 1924 2010 1962 1993 2001 1978 1958 1906 1932 1965 1983 1930 1920 1959
Arizona 1952 1924 1973 1917 1948 1962 1964 1958 1969 1913 1945 1922 1977 1909 1923 1919 1991 1965 1920 1944 1942 1975 1970 1987 1912
Arkansas 1960 1915 1965 1947 1906 1958 1969 1912 1924 1943 1996 2013 1941 1931 1962 1970 1980 1975 1978 1937 1926 1932 1971 2002 1896
California 1917 2006 1948 1952 1958 1935 1945 1962 1973 1938 1991 1977 1897 1975 1964 1909 1949 1954 1922 1912 1898 1985 1963 1907 1919
Colorado 1924 1965 1948 1917 1969 1964 1923 1912 1952 1958 1906 1915 1897 1962 1970 1932 1913 1942 1944 1898 1920 1930 1931 1980 1927
Connecticut 1916 1923 1960 1896 1940 1906 1941 1937 1956 1926 1900 1967 1944 1950 1984 1899 1904 1932 1939 2005 1947 1978 1915 1993 1911
Delaware 1960 1916 1941 1947 1896 1900 1906 1914 1940 1915 1984 1926 1970 1937 1969 1958 1932 1934 2005 1996 1931 1965 1993 1911 1950
Florida 1915 1969 1931 2010 2013 1960 1914 1941 1924 1968 1926 1996 1947 1930 1971 1932 1983 1916 1981 1901 1978 1937 1962 1966 1998
Georgia 1960 1915 1947 1969 1926 1941 2013 1971 1931 1996 2010 1914 1962 1930 1958 1924 1906 1993 1932 1966 1981 1950 1978 1959 1900
Idaho 1917 1955 1964 1897 1952 1922 1951 1976 1906 1965 1985 1943 1948 1898 1962 1969 1944 1923 1942 1913 1971 1936 1954 1895 1912
Illinois 1960 1906 1912 1965 1984 1932 1978 1899 1947 1926 2013 1996 1900 1969 1915 1896 1924 1975 1941 1980 1943 1962 1931 1958 1934
Indiana 1960 1906 1912 1984 1932 1926 1965 1947 1978 1915 1896 1996 1900 1941 2013 1969 1924 1931 1980 1934 1937 1958 1899 1916 1940
Iowa 1960 1899 1965 1912 1906 1951 1969 1975 1932 1962 1915 1923 1984 2013 1944 1900 1896 1950 1943 1996 2001 2002 1940 1924 1913
Kansas 1912 1960 1915 1906 1958 1965 1924 1969 1948 1932 1899 1952 1970 1931 1896 1944 1996 1947 1975 1998 1943 1951 1984 1913 1937
Kentucky 1960 1915 1947 1906 1969 2013 1926 1941 1965 1896 1932 1931 1996 1958 1912 1924 1914 1937 1971 1984 2001 1900 1978 1980 1999
Louisiana 1915 1960 1969 1947 1931 1941 1965 1962 1996 1937 1914 1926 1958 2010 1924 2013 1932 1978 1968 2001 1930 1906 1912 1971 1983
Maine 1923 1939 1926 1916 1967 1956 1984 1972 1989 2008 1992 1997 1911 1900 1950 1978 1943 1906 1941 1937 1912 1960 2001 2003 1899
Maryland 1960 1916 1896 1915 1906 1941 1947 1900 1914 1926 1940 1932 1984 1934 1970 1958 1931 1996 1912 1937 1969 1911 1895 1965 2013
Massachusetts 1916 1960 1896 1906 1940 1923 1984 1941 1956 1926 1900 1950 1967 1939 1895 2005 1937 1911 1899 1978 1904 1944 1897 1993 1932
Michigan 1960 1912 1900 1916 1899 1923 1940 1934 1926 1965 1906 1984 1932 1950 1943 1895 1941 1972 1937 1996 1978 1896 1944 1956 1947
Minnesota 1899 1965 1960 1923 1951 1932 1912 1943 2002 1975 1913 1897 1955 1906 1969 1996 1950 1896 1970 1940 1964 2013 1956 1916 1944
Mississippi 1960 1915 1969 1947 1965 2013 1931 1958 1941 1926 1924 1996 1906 1962 1914 1971 1978 2001 1932 1912 2010 1937 1993 1968 1980
Missouri 1960 1965 1906 1912 1915 1899 1947 1958 1969 1924 1984 1932 1996 2013 1896 1978 1975 1926 1943 1931 1962 1970 1937 1923 1900
Montana 1965 1951 1912 1897 2002 1917 1899 1955 1943 1932 1898 1906 1913 1952 1904 1954 1944 1969 1996 1948 1962 1950 1896 1903 1964
Nebraska 1912 1965 1906 1915 1960 1899 1958 1969 1924 1944 1932 2002 1962 1951 1896 1952 1996 1948 1975 1943 1970 1913 1998 1964 1950
Nevada 1897 1917 1952 1898 1902 1948 1964 1924 1962 1969 1977 1913 1958 1912 1945 1895 1922 2006 1944 1985 1907 1973 1976 1906 1935
New Hampshire 1923 1926 1916 1900 1906 1896 1950 1956 1939 1960 1899 1911 1937 1984 1912 1967 1941 1928 1944 1940 1904 1932 1918 1978 1895
New Jersey 1916 1960 1896 1906 1941 1940 1926 1914 1984 1900 1915 1937 1934 1895 1932 1947 1950 1912 1904 1970 1956 1967 1944 1996 1978
New Mexico 1969 1915 1948 1958 1924 1965 1923 1962 1952 1913 1964 1917 1970 1937 1930 1932 1942 1919 1977 1897 1973 1931 1987 1902 1912
New York 1916 1960 1896 1900 1984 1940 1906 1941 1912 1926 1937 1895 1950 1923 1932 1956 1978 1944 1915 1909 1914 1972 1992 2005 1904
North Carolina 1960 1915 1947 1926 1941 2013 1969 1931 1914 1958 1996 1906 1971 1962 1981 1965 1924 1932 1980 1940 1993 1999 1900 1896 1930
North Dakota 1899 1897 1951 1965 1912 1896 1944 1943 2002 1960 1969 1913 1948 1919 1996 2013 1952 1970 1904 1923 1906 1932 1955 1950 2011
Ohio 1960 1906 1984 1896 1900 1912 1947 1941 1915 1926 1932 1978 1996 1916 1965 1937 1934 1940 1895 1969 1950 1914 2013 1971 1980
Oklahoma 1915 1912 1906 1965 1960 1958 1924 1969 1948 1947 1913 1931 1932 1943 1970 1896 1899 1941 1996 1937 1926 1975 1923 1998 2002
Oregon 1917 1897 1955 1952 1951 1922 1935 1971 1906 1898 1948 1976 1964 1985 1975 1913 1954 1945 1958 1962 1904 1950 1924 1977 1938
Pennsylvania 1960 1896 1916 1984 1900 1941 1906 1940 1947 1915 1950 1926 1932 2005 1912 1996 1895 1978 1970 1937 1914 1965 1993 1971 1944
Rhode Island 1895 1916 1906 1923 1896 1960 1926 1940 1956 1941 1911 1900 1915 1984 1912 1950 1967 1914 1917 1904 2005 1920 1978 1944 1899
South Carolina 1960 1915 1947 1941 2013 1969 1926 1931 1971 1958 1914 1996 1962 1924 1993 1900 1930 1980 1981 1932 1999 1906 1940 1965 1978
South Dakota 1899 1965 1951 1960 1915 1912 1906 2002 1952 1969 1944 1897 1896 1950 1932 1996 1962 1913 1943 1975 1970 1917 1998 1924 1964
Tennessee 1960 1915 1947 1969 1926 2013 1965 1941 1924 1906 1931 1996 1958 1971 1914 1896 1932 1912 1999 1962 2001 1980 1943 1937 1993
Texas 1915 1969 1965 1958 1931 1960 1941 1912 1947 1970 1932 1924 1937 1906 1996 2001 1987 1923 1926 1930 1962 1913 1943 2010 1968
Utah 1917 1964 1952 1897 1948 1924 1922 1962 1969 1923 1898 1942 1944 1902 1976 1955 1965 1913 1920 1958 1977 1973 1945 1935 1932
Vermont 1916 1926 1900 1923 1906 1912 1984 1911 1896 1950 1956 1960 1937 1941 1939 1915 1940 1932 1944 1899 1992 1909 1967 1904 1905
Virginia 1960 1947 1915 1941 1906 1931 1914 1926 1969 2013 1996 1958 1896 1916 1932 1900 1984 1993 1934 1940 1978 2005 1965 1970 1981
Washington 1955 1917 1951 1897 1971 1922 1904 1956 1976 1954 2009 1913 1935 1975 1943 1950 2002 1948 1962 1964 1936 1952 1944 1945 1912
West Virginia 1960 1947 1915 1941 1926 1896 1969 1932 1931 1996 1906 1914 2013 1958 1999 1984 2001 1971 1981 2005 1993 1900 1916 1937 1940
Wisconsin 1899 1960 1923 1912 1932 1965 1926 1943 1896 1940 1906 1950 1996 1975 1900 1916 2013 1984 1913 1941 1951 1969 1972 1956 2002
Wyoming 1965 1917 1912 1906 1924 1932 1964 1955 1943 1952 1969 1899 1923 1913 1948 2002 1944 1898 1897 1951 1954 1962 1958 1896 1970

USA NOAA March 2013 State Temperatures – Florida and South Carolina 5th coldest out of 119 – 114 Were Warmer.

Florida and South Carolina was coldest state by ranking. 5th coldest out of 119 for March 2013. 114 were warmer.

Kentucky, Mississippi, North Carolina, Tennessee, Georgia and Alabama were amazingly cold at 6th/7th coldest out of 119.

In fact the list of really cold states was very long. Twelve states had an average temperature below freezing!

31 of the lower 48 states were ranked less than 60 out of 119, which is pretty cold.

The warmest state in terms of ranking was California at 111, still colder than 8 March’s.

The biggest difference between March 2013 and the warmest March was North Dakota, 23F colder than 2012.

No state broke a warm record. No sign of “global warming” in March 2013 in the USA.

State Mar_2013 Current Rank Warmest Year Warmest Temp Difference From Warmest
Florida 59 5 1997 70.6 11.6
South Carolina 48.2 5 1945 63.1 14.9
Kentucky 38.9 6 1945 55.6 16.7
Mississippi 50.2 6 1907 65.1 14.9
North Carolina 44.1 6 2012 58.7 14.6
Tennessee 42.6 6 1921 58.6 16
Georgia 50.3 7 1921 64.6 14.3
Alabama 49.9 8 2012 64.3 14.4
Virginia 40.3 10 1921 55 14.7
Illinois 34 11 1946 51.6 17.6
Arkansas 46.2 12 1907 61.2 15
West Virginia 36.3 13 1921 51.6 15.3
Iowa 28.7 14 1910 47.7 19
Missouri 38.2 14 1910 55 16.8
Indiana 35 15 1946 52.1 17.1
Louisiana 55.2 16 1921 67.6 12.4
North Dakota 17.3 16 2012 40.3 23
Wisconsin 23.8 17 1910 40.7 16.9
Minnesota 20.7 22 1910 40.6 19.9
Ohio 35 23 1946 49.5 14.5
Maryland 39 25 2012 52.3 13.3
Kansas 40 34 1910 54.7 14.7
Pennsylvania 34.3 35 1945 47.2 12.9
South Dakota 28.3 35 1910 46.3 18
Nebraska 34 37 1910 50 16
Oklahoma 47.3 38 2007 58.3 11
Delaware 41.2 40 1945 52.6 11.4
Michigan 27.9 42 1945 41.2 13.3
New Jersey 38.8 47 1945 49.5 10.7
Texas 57 53 1904 63.7 6.7
New York 30.6 57 1946 42 11.4
Massachusetts 34.7 60 2012 43.8 9.1
Montana 31.1 60 1910 41.4 10.3
Connecticut 36 63 1946 44 8
Colorado 34.6 66 2012 42 7.4
Rhode Island 37.6 67 1946 44 6.4
Wyoming 31.7 77 1986 39.8 8.1
Oregon 41.7 79 1986 46.2 4.5
Vermont 30.3 83 1946 38.9 8.6
Idaho 36.3 85 1992 42.8 6.5
Washington 42 87 1934 46.2 4.2
New Hampshire 31.8 88 1946 39.4 7.6
New Mexico 46.5 95 2004 49.7 3.2
Utah 41 95 1986 45.6 4.6
Maine 30.7 99 1903 34.5 3.8
Arizona 55.1 110 1895 57.1 2
Nevada 44.6 110 2004 47.8 3.2
California 55.2 111 2004 58.5 3.3

USA NOAA March 2013 – Damned Cold – Only 43rd Coldest out of 119

According to the NOAA, March 2013 was ranked 43rd coldest out of 119.

76 March’s have been warmer. Here is a list:

1898 1900 1901 1902 1903 1904 1905 1907 1908 1910 1911 1914 1916 1918 1919
1921 1925 1927 1928 1929 1933 1934 1935 1936 1938 1939 1940 1942 1945 1946
1949 1953 1956 1957 1959 1961 1963 1966 1967 1968 1972 1973 1974 1976 1977
1978 1979 1981 1982 1983 1985 1986 1987 1988 1989 1990 1991 1992 1993 1994
1995 1997 1998 1999 2000 2001 2003 2004 2005 2006 2007 2008 2009 2010 2011
2012

March 2013 was 10F colder than 2012. Will it make the news?

(1 = Coldest / 119 = Warmest / Highlighted Were Warmer Than 2013)

year Mar Mar Rank 
2013 40.76 43
2012 50.4 119
2011 43.04 80
2010 43.54 87
2009 42.88 77
2008 41.94 61
2007 47.53 117
2006 42.71 75
2005 42.35 65
2004 47.26 116
2003 43.27 82
2002 39.4 29
2001 41.36 53
2000 46.08 112
1999 42.87 76
1998 41.29 51
1997 44.59 104
1996 38.95 26
1995 43.43 85
1994 44.47 101
1993 41.62 56
1992 44.7 105
1991 43.49 86
1990 44.73 106
1989 42.59 72
1988 42.5 71
1987 42.64 74
1986 46.22 113
1985 43.57 88
1984 40.11 36
1983 42.49 70
1982 42.05 63
1981 42.97 79
1980 39.43 32
1979 42.18 64
1978 41.28 50
1977 43.37 84
1976 42.41 68
1975 38.81 20
1974 44.47 102
1973 44.49 103
1972 44.07 98
1971 39.77 34
1970 38.61 15
1969 36.16 4
1968 43.71 92
1967 43.69 91
1966 43.07 81
1965 35.55 1
1964 38.93 25
1963 43.87 96
1962 38.01 12
1961 43.61 90
1960 35.91 2
1959 41.63 58
1958 37.83 10
1957 41.43 54
1956 40.85 44
1955 40.16 37
1954 39.41 31
1953 43.87 95
1952 37.9 11
1951 38.7 18
1950 39.02 28
1949 40.96 46
1948 38.89 22
1947 38.86 21
1946 46.96 115
1945 45.76 109
1944 38.72 19
1943 38.69 17
1942 41.54 55
1941 39.41 30
1940 41.63 57
1939 42.63 73
1938 45.22 107
1937 38.97 27
1936 43.59 89
1935 43.75 93
1934 42.9 78
1933 42.04 62
1932 37.53 8
1931 39.59 33
1930 40.59 41
1929 43.81 94
1928 43.28 83
1927 42.41 67
1926 39.86 35
1925 44.4 100
1924 37.39 7
1923 38.52 14
1922 40.62 42
1921 46.71 114
1920 40.43 39
1919 41 48
1918 45.96 111
1917 38.66 16
1916 42.37 66
1915 37.27 6
1914 40.99 47
1913 38.92 24
1912 35.96 3
1911 44.23 99
1910 49.62 118
1909 40.5 40
1908 44.01 97
1907 45.79 110
1906 36.31 5
1905 45.29 108
1904 41.75 59
1903 42.42 69
1902 41.9 60
1901 40.9 45
1900 41.32 52
1899 37.72 9
1898 41.14 49
1897 38.91 23
1896 38.19 13
1895 40.17 38