A quick update for sea ice extent:
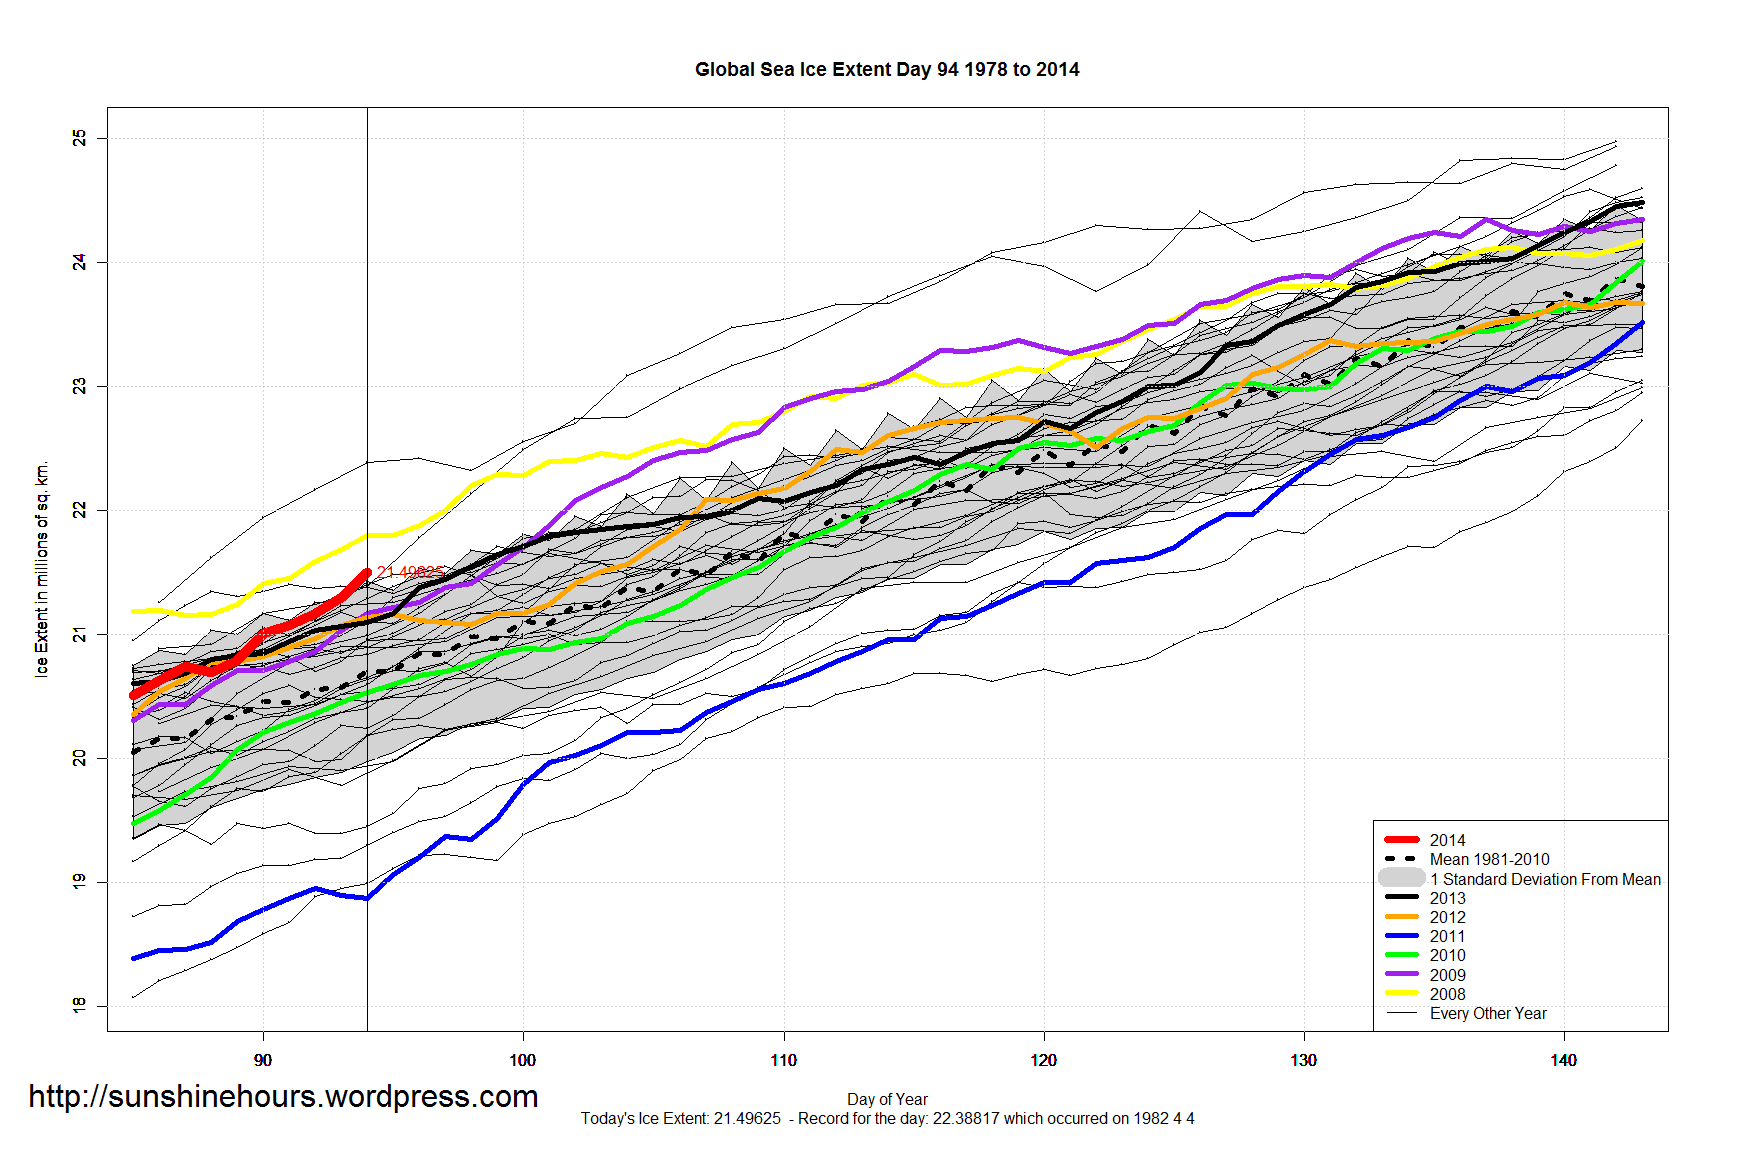
- Global Sea Ice is 797,000 sq km above the 1981-2010 mean. That is the 3rd highest for the day! And above one standard deviation.
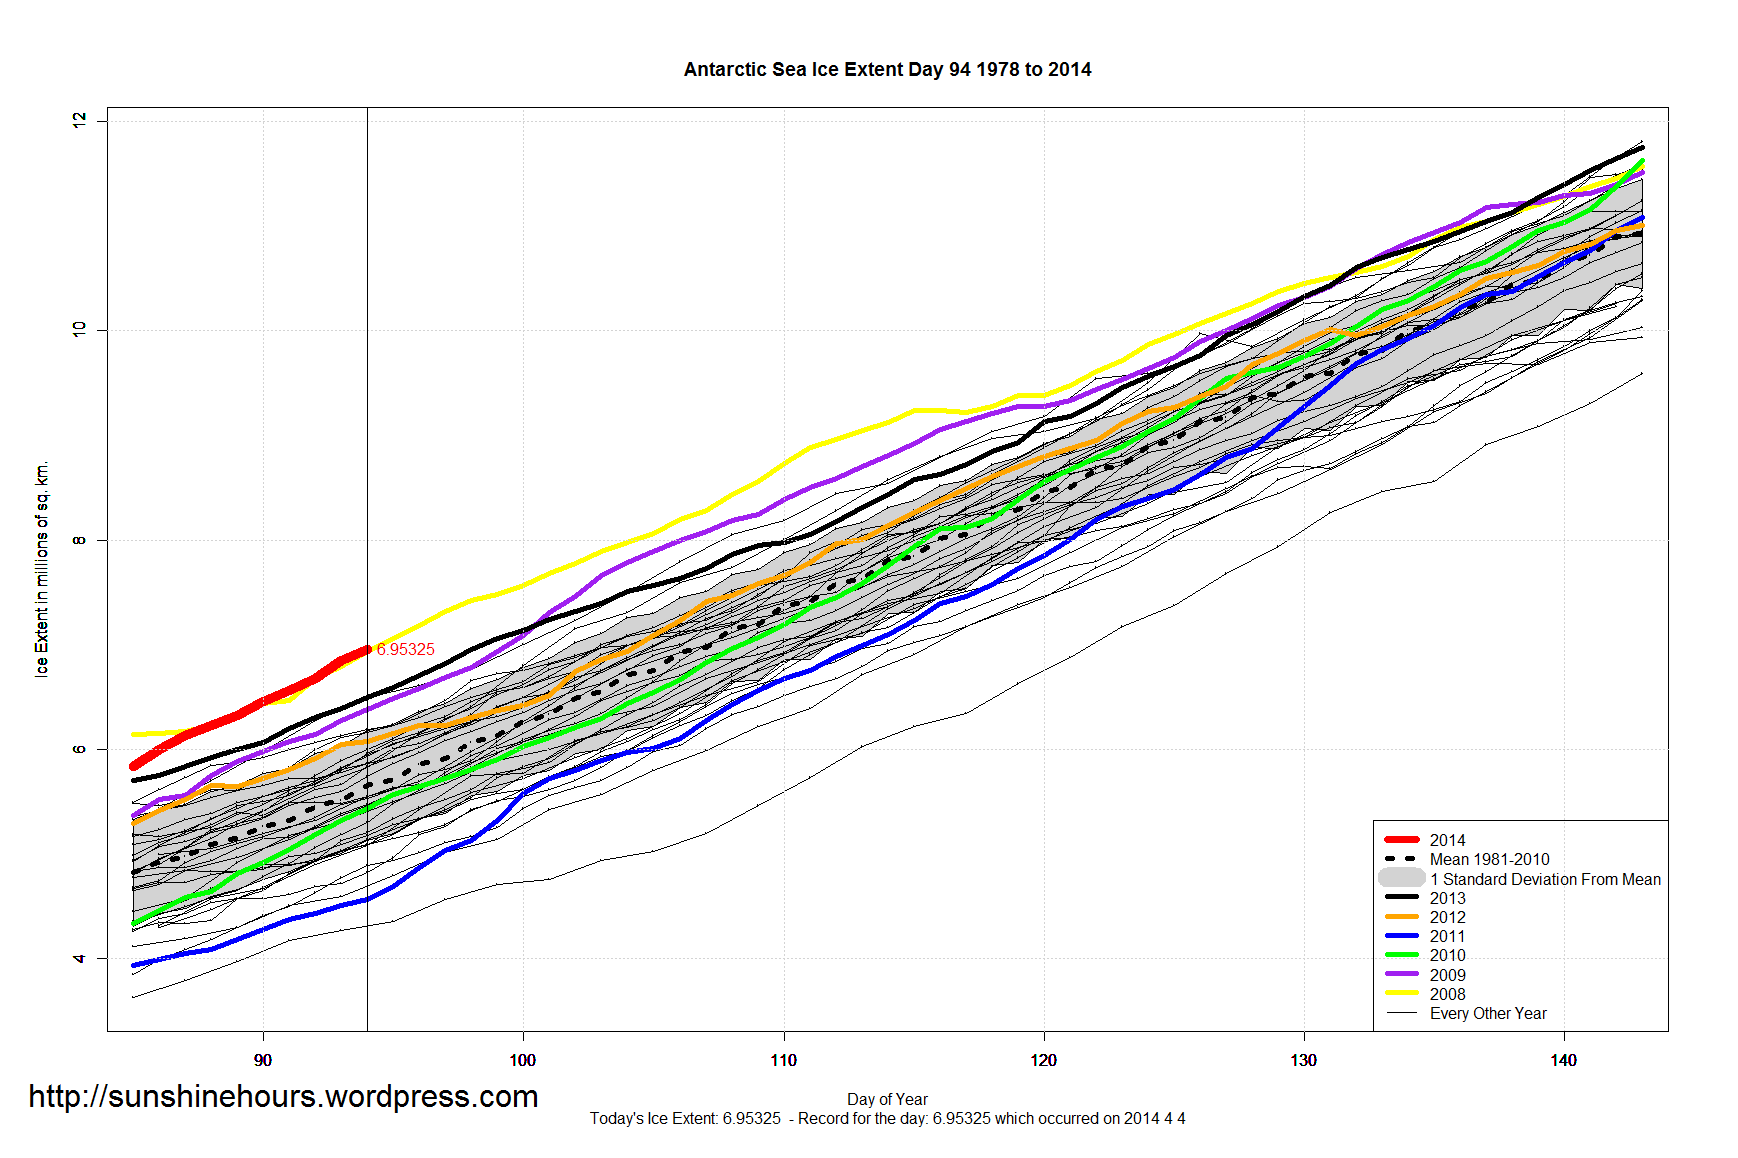
- Antarctic Sea Ice is 1,298,000 sq km above the 1981-2010 mean.Highest for this day.
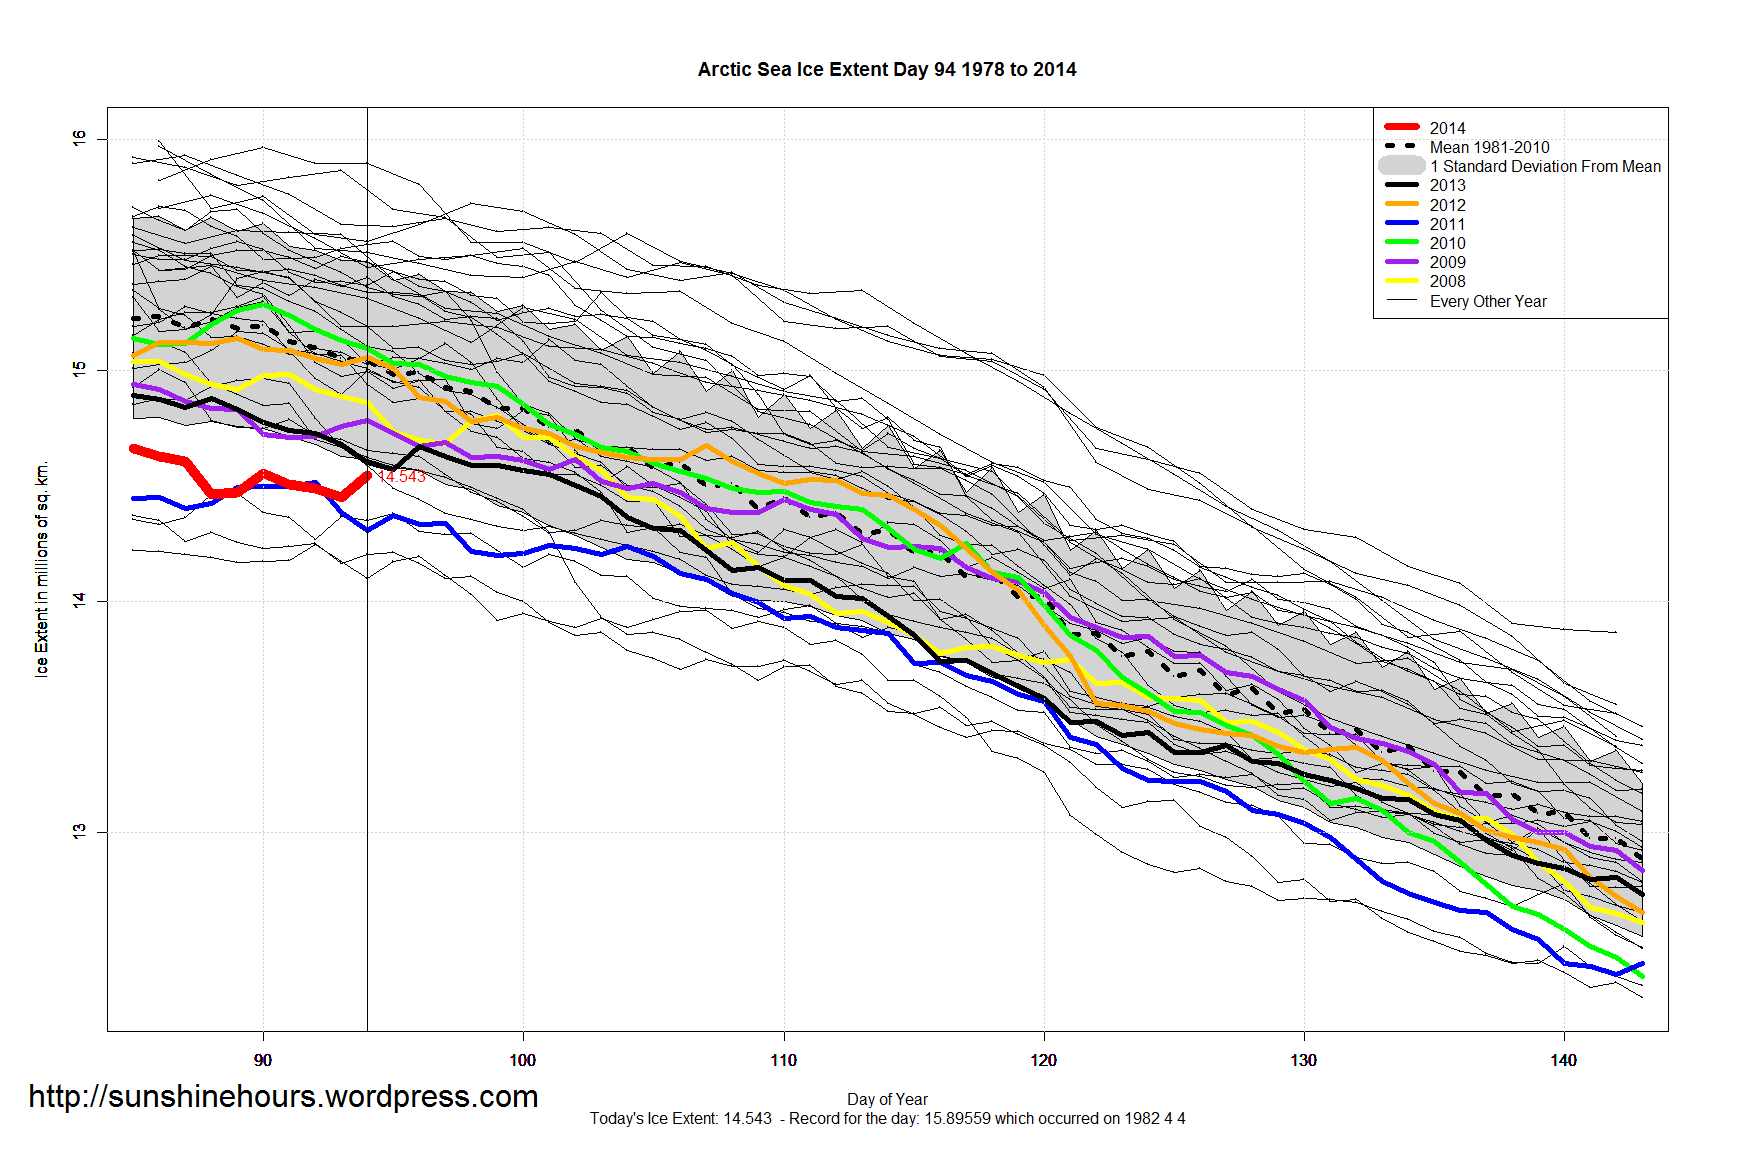
- Arctic Sea Ice is 500,000 sq km below the 1981-2010 mean. That is only 70,000 sq km outside the one standard deviation mark.
Data here. Graphs below. Click for bigger.

Why does the standard deviation do the “Triangle” thing?
I’ll check it out.
It is an artifact caused by there not being data every year for each day in the early 1980s..
I use 1981-2010 as the period for the 30 year mean.
Day 100 (for example) had Arctic data for 1982, 1984, 1985 and 1987 and then every year from 1988 on.
Day 101 (for example) had Arctic data for 1981, 1983, 1986 and then every year from 1988 on.
I tested my code with a mean from 1988 to 2010 and the triangles disappeared.