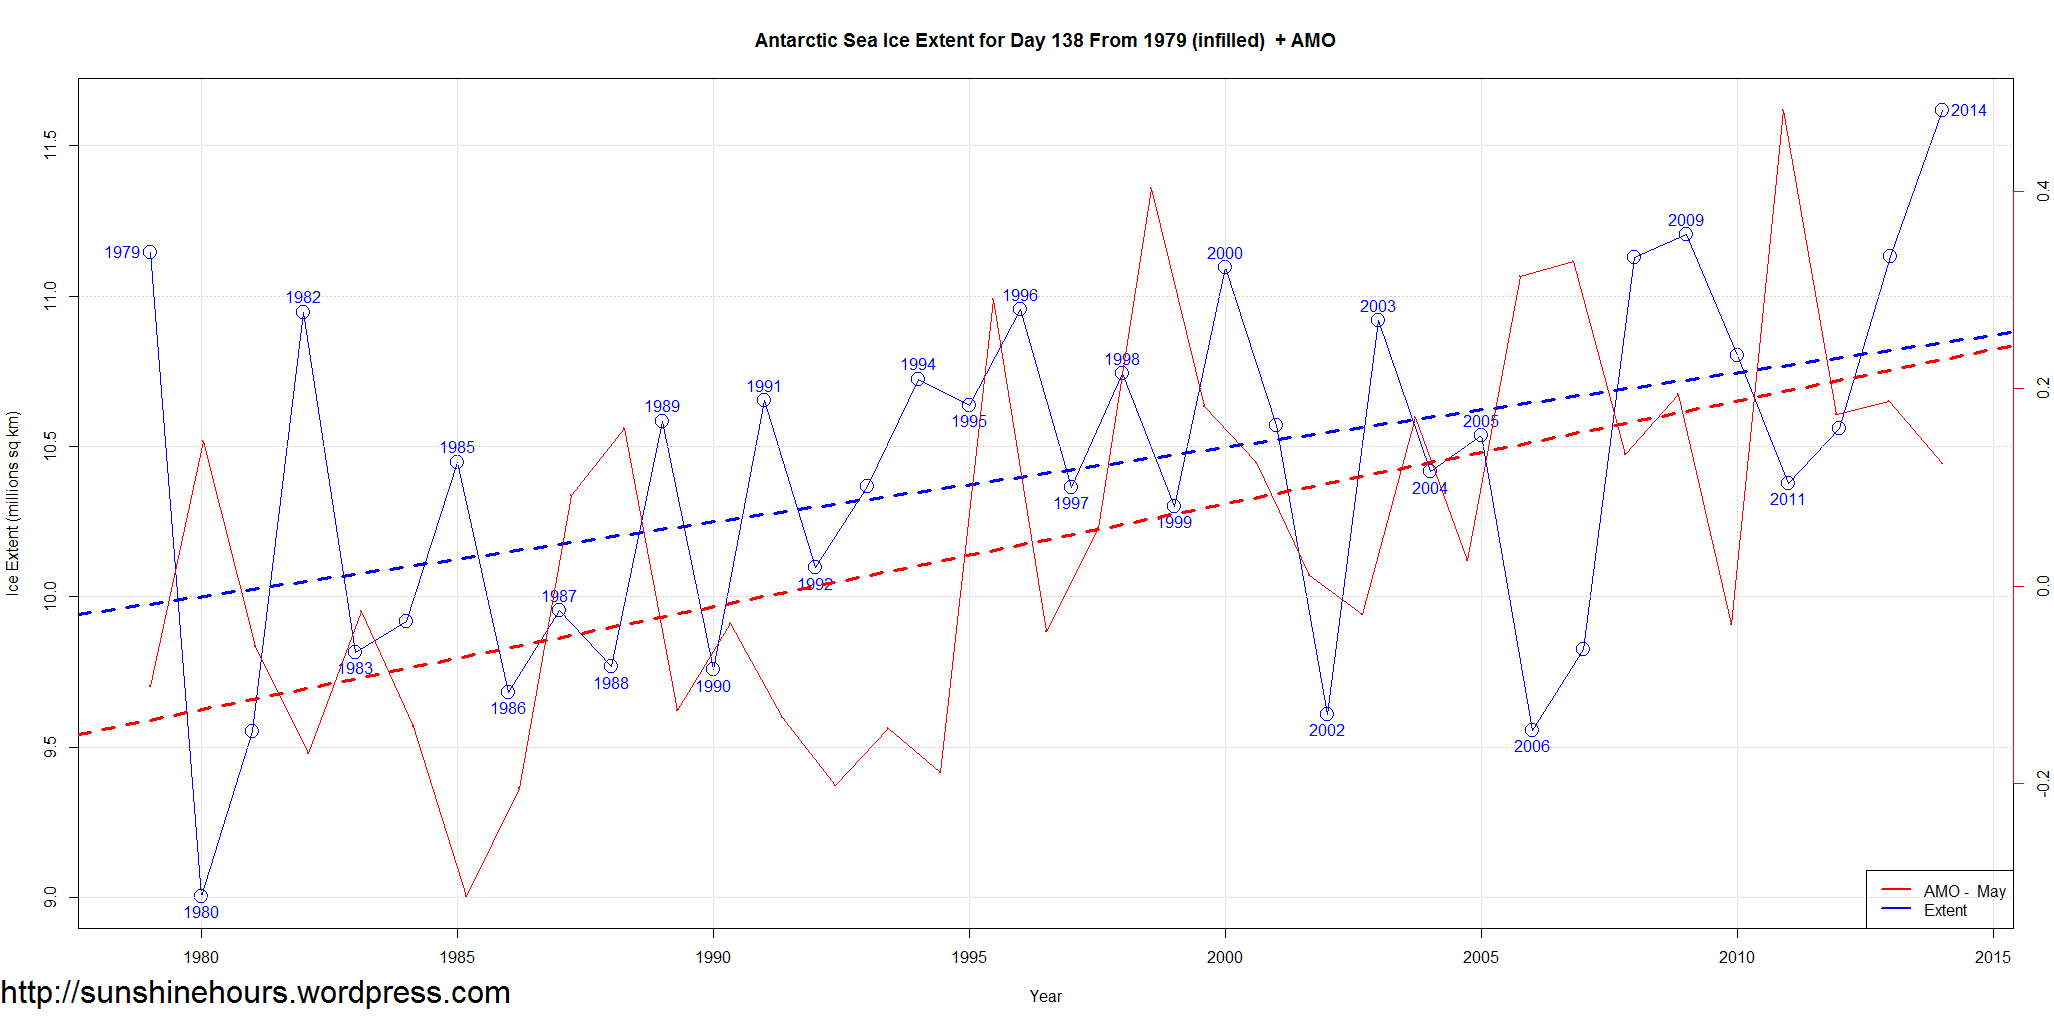
The graph is in thise post compares sea ice extent for just one day of each year – 138 to the AMO for the month day 138 is in – in this case May. There isn’t any AMO data for May 2014 yet.
AMO data comes from NOAA, Sea Ice data comes from NSIDC.
The red is the May AMO – Atlantic Multidecadal Oscillation. The blue is Antarctic Sea Ice Extent just for day 138.
The dashed lines are the liner trends for each.
Click on the graph for a larger size.