UPDATE: Sorry about the title. Not sure what happened. Fixed now.
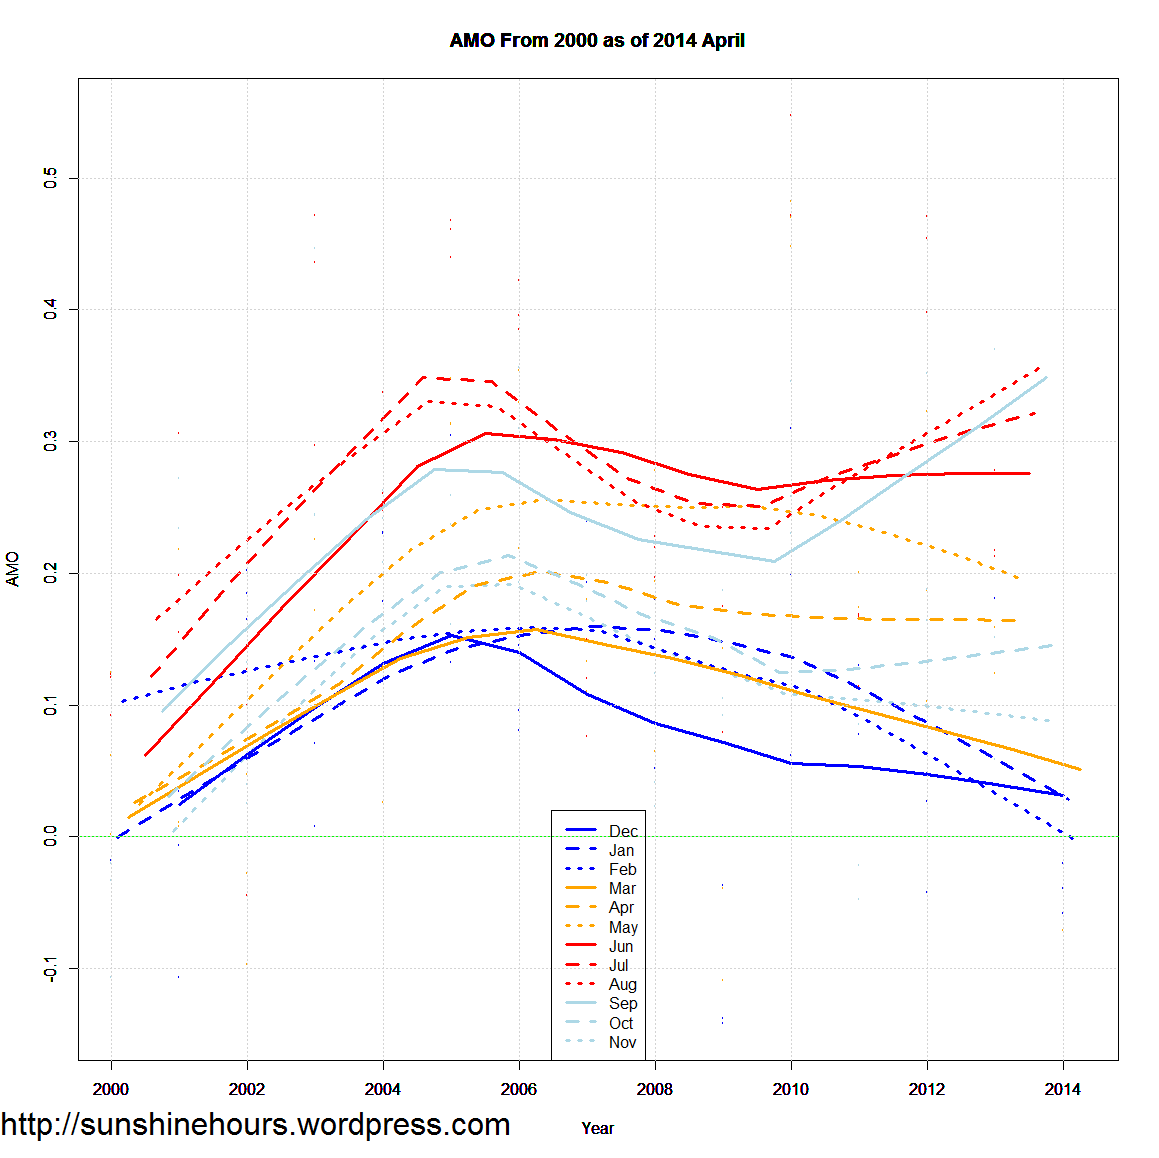
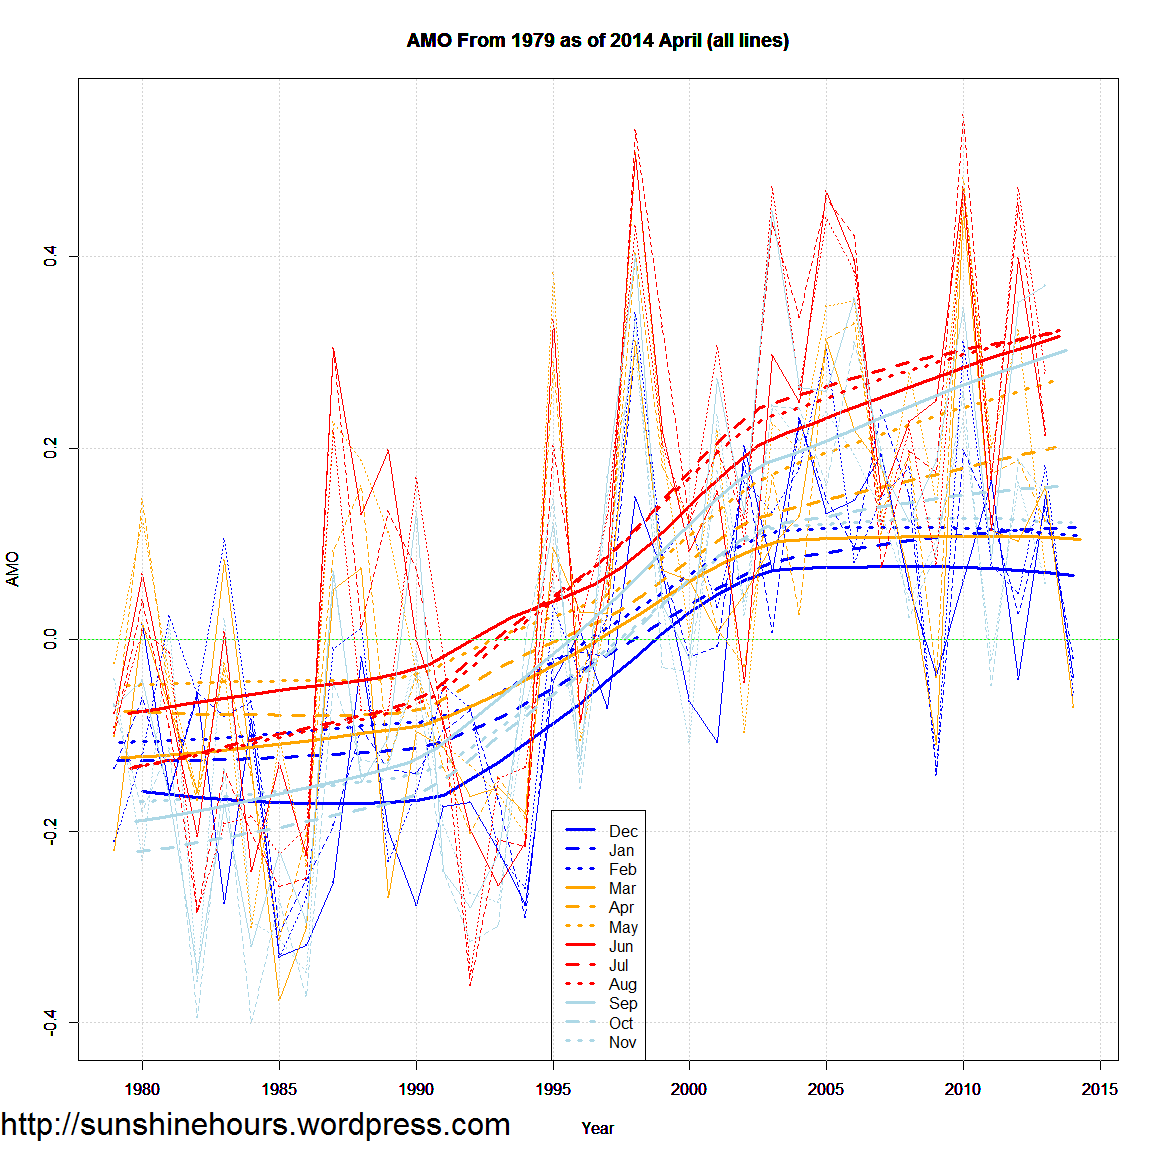
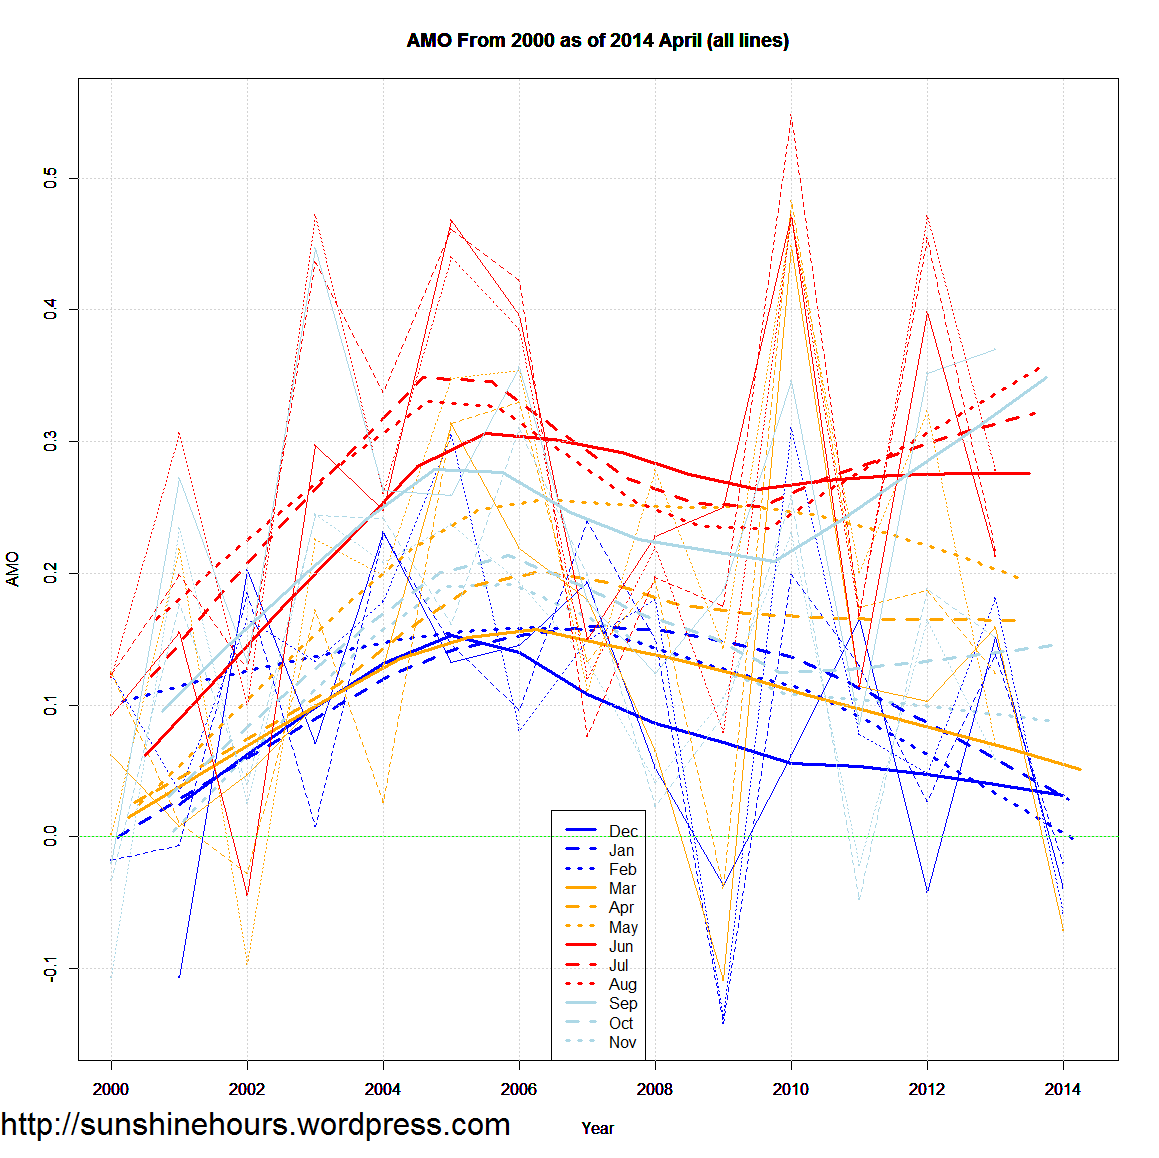
The AMO is definitely linked with climate cycles. And probably has more to do with Arctic Sea Ice than any other factor. This is loess trend of each month of the AMO on the same graph.
The winter months started trending down around 2005/2008. Spring months have been flattish since the same time. Only July-Sept have stayed high. June has been flat.
The first four months of 2014 were all negative.
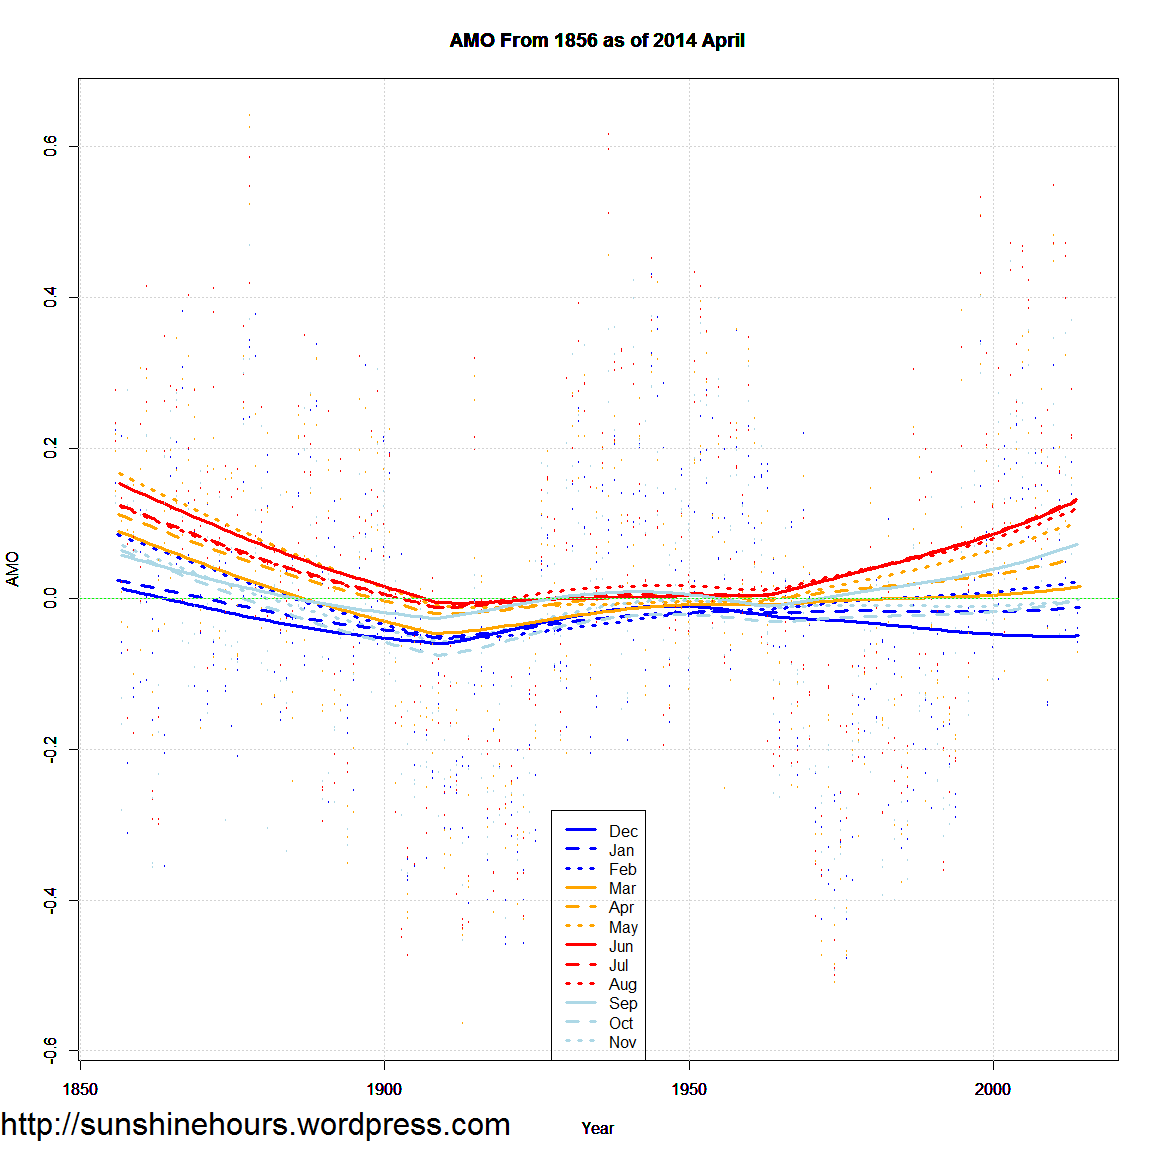
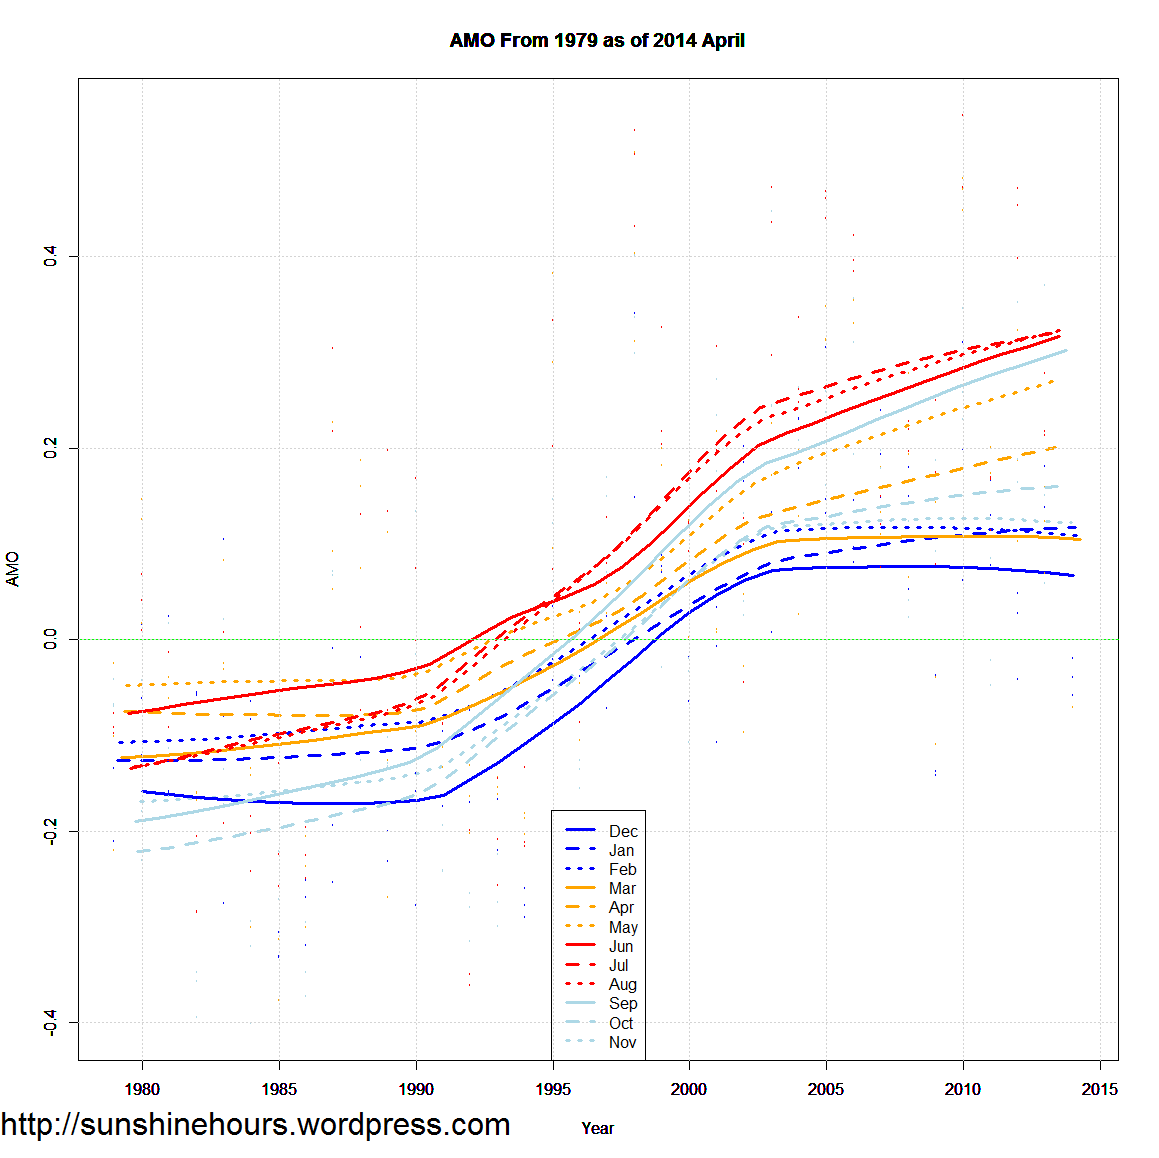
Same graph, but from 1856 and 1979. The spread in months now seems to be repeating the pattern way back in 1856. But that could be an endpoint artifact.
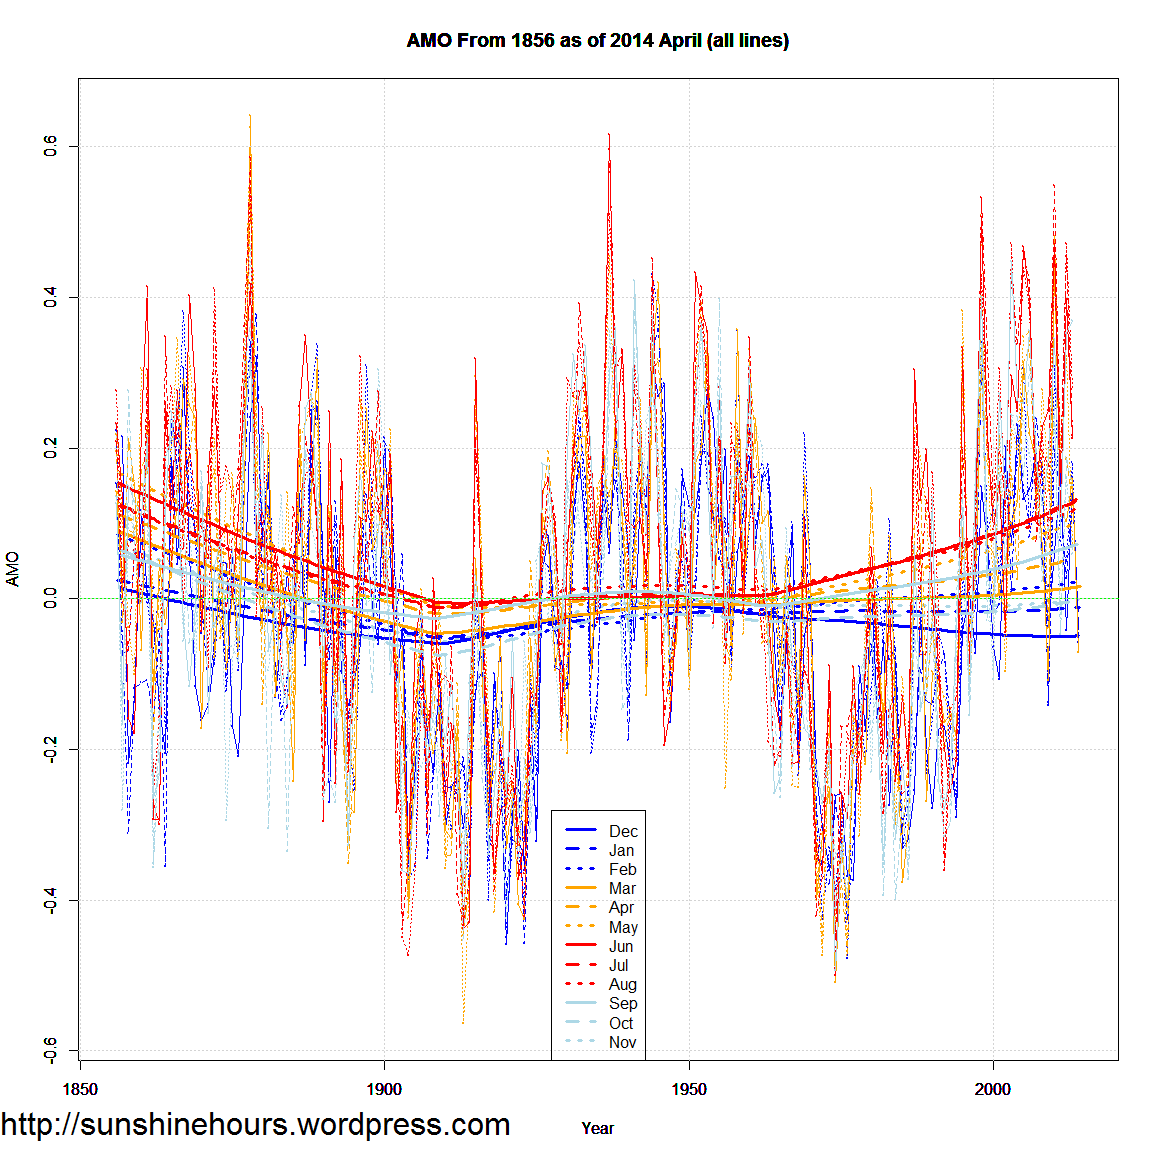
Same graphs, but the data and the trends.

A short time ago I commented on the same thing over at Pierre’s. I’ll reprise that by saying there also appears to be a solar cycle modulation of the AMO as well.
For anyone who would like to easily explore these things you can do so using the Woodfortrees site. Here’s a graph of AMO vs inverted Arctic sea ice extent vs the solar cycle. Anyone can play with the settings to see for yourselves what you get.