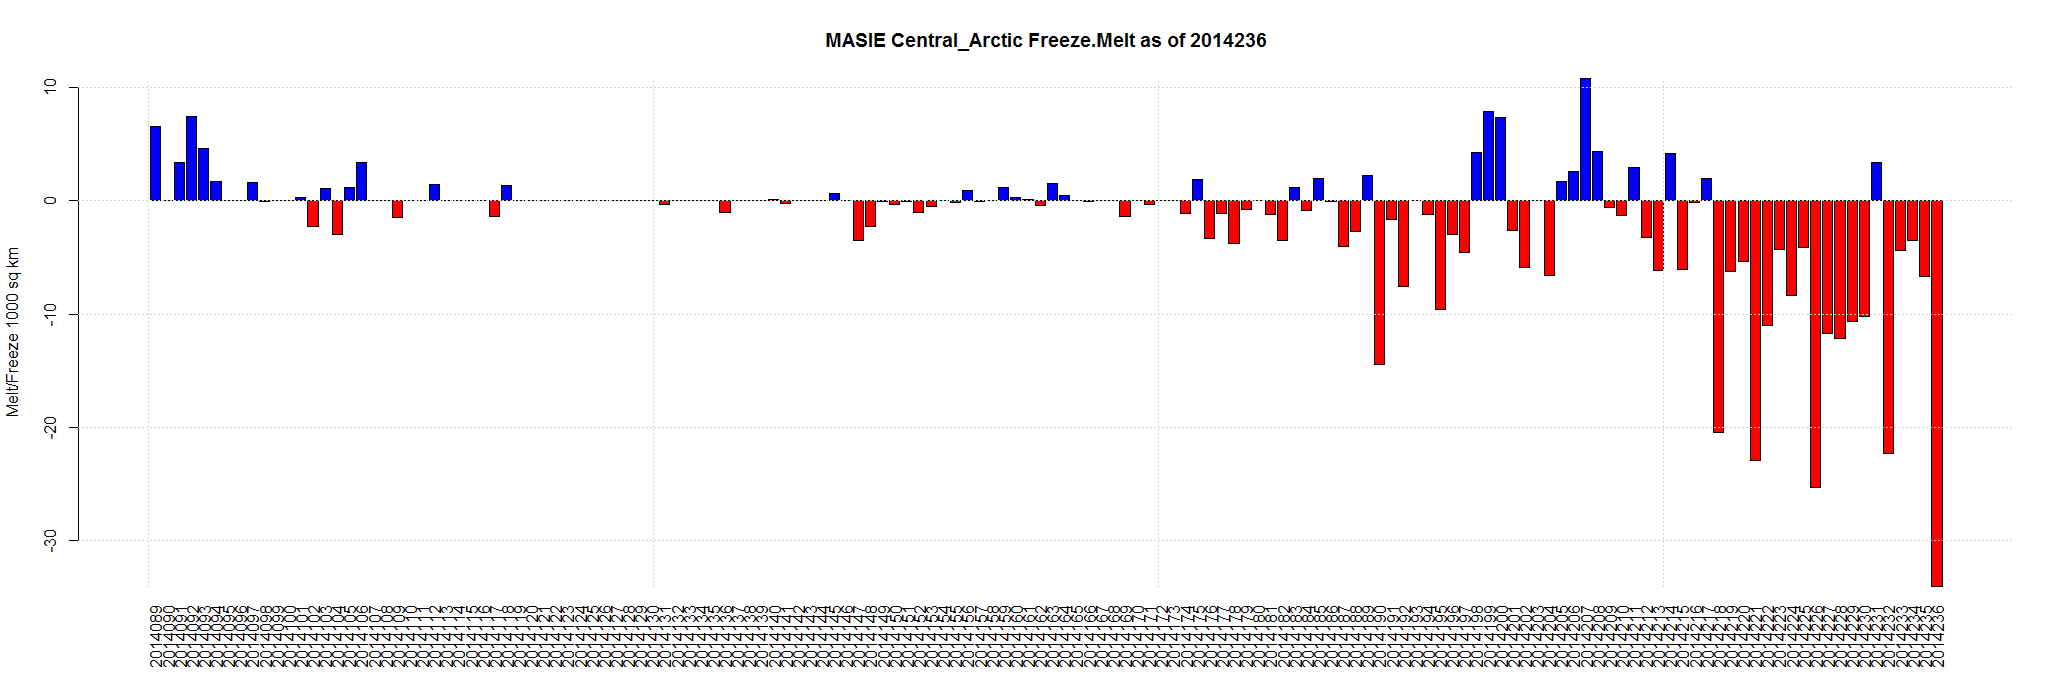
Aug 25 2014 MASIE Update – Biggest Central Arctic Drop This Year
Data here. Click for bigger.
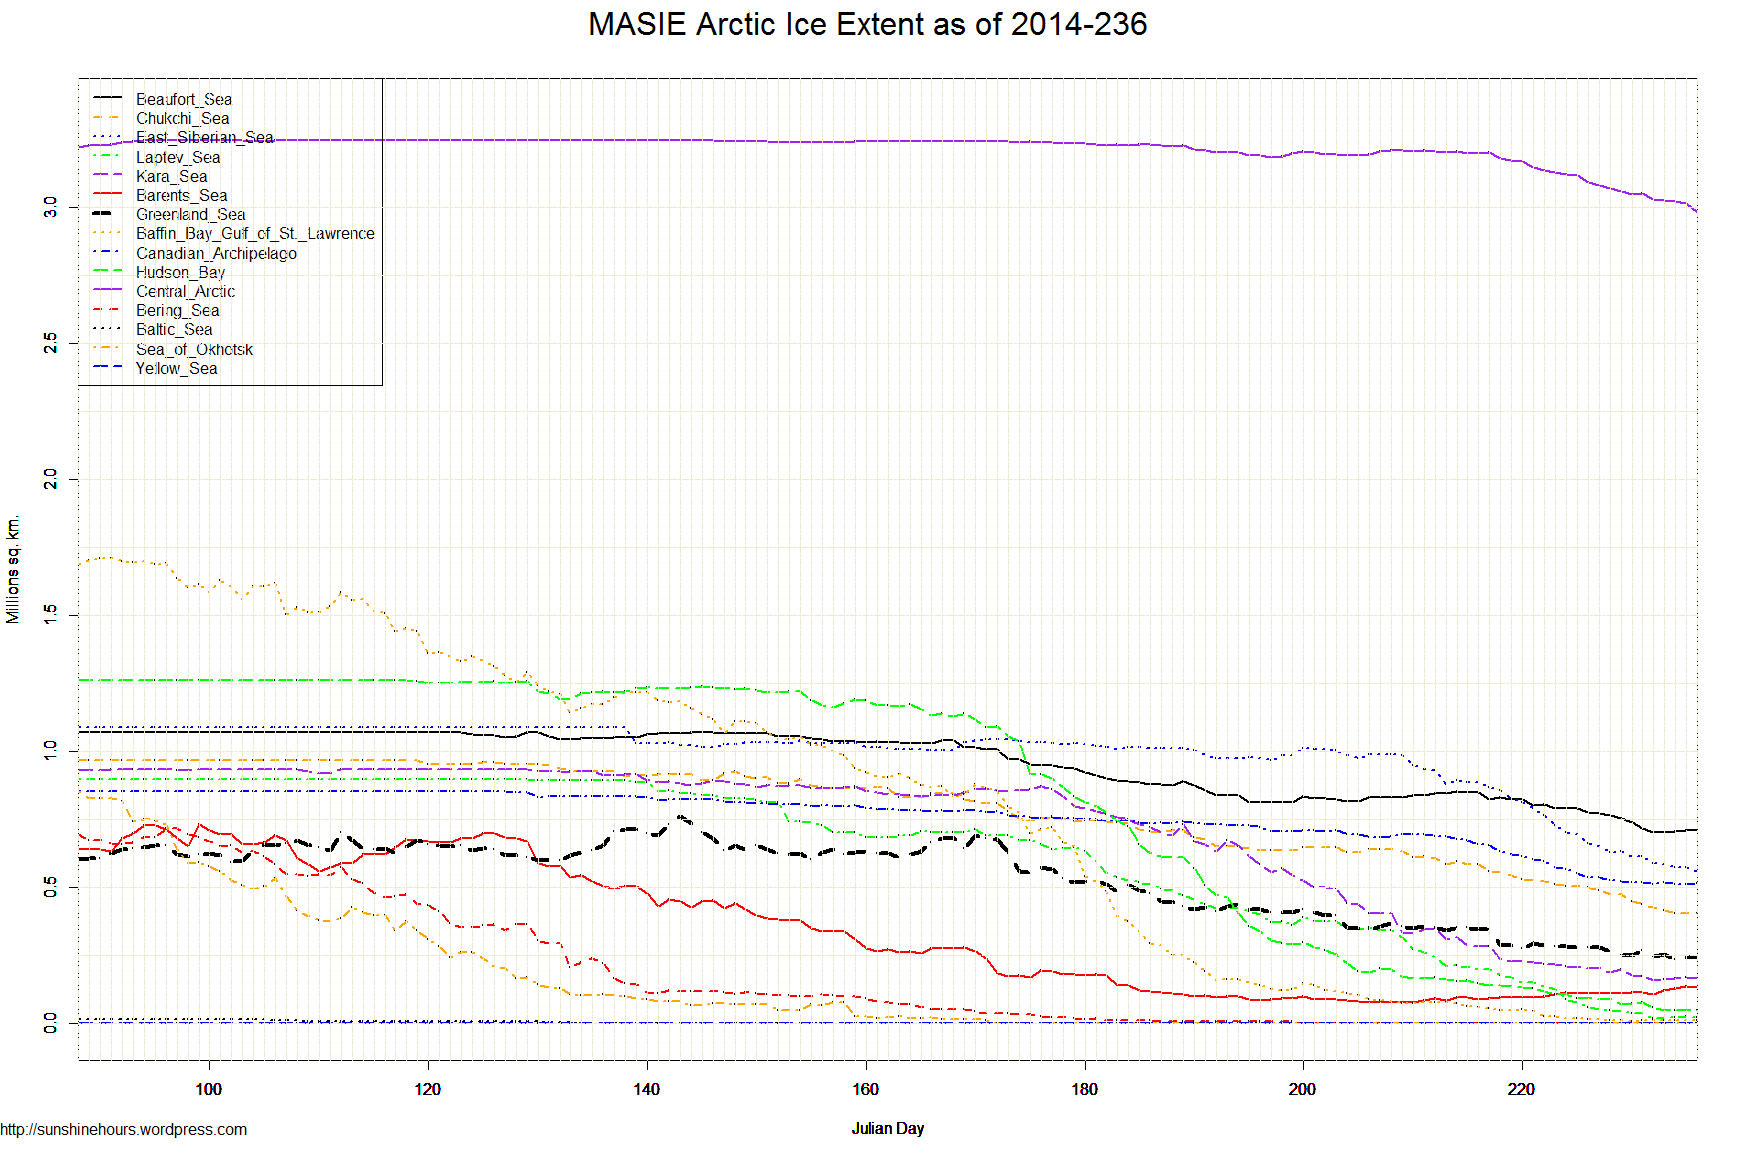
| Region | 149 days ago | End | Last 148 | Last 28 | Last 14 | Last 7 | Last 3 | Last 1 |
| Central Arctic | 3,221,921 | 2,980,531 | -241,390 | -228,576 | -154,207 | -77,721 | -44,247 | -34,005 |
| East Siberian Sea | 1,087,137 | 560,060 | -527,077 | -430,860 | -206,737 | -72,835 | -24,128 | -13,493 |
| Barents Sea | 645,917 | 131,579 | -514,338 | 51,732 | 31,988 | 21,634 | 7,783 | -5,630 |
| Laptev Sea | 897,845 | 21,424 | -876,421 | -319,660 | -116,495 | -21,706 | 3,223 | -3,789 |
| Kara Sea | 933,859 | 166,456 | -767,404 | -238,193 | -50,725 | -34,147 | 5,146 | -3,536 |
| Hudson Bay | 1,260,903 | 49,738 | -1,211,165 | -150,716 | -67,049 | -19,528 | -145 | -145 |
| Beaufort Sea | 1,070,445 | 711,272 | -359,173 | -121,260 | -94,676 | -41,662 | 6,670 | 0 |
| Chukchi Sea | 966,006 | 404,852 | -561,154 | -236,954 | -117,703 | -71,376 | -10,035 | 0 |
| Baffin Bay Gulf of St. Lawrence | 1,688,530 | 10,242 | -1,678,288 | -72,380 | -17,325 | -1,565 | -18 | 0 |
| Bering Sea | 697,324 | 0 | -697,324 | -15 | 0 | 0 | 0 | 0 |
| Baltic Sea | 15,337 | 0 | -15,337 | 0 | 0 | 0 | 0 | 0 |
| Sea of Okhotsk | 853,240 | 0 | -853,240 | 0 | 0 | 0 | 0 | 0 |
| Yellow Sea | 0 | 0 | 0 | 0 | 0 | 0 | 0 | 0 |
| Greenland Sea | 603,416 | 246,278 | -357,137 | -122,999 | -42,691 | -6,295 | -7,963 | 1,456 |
| Canadian Archipelago | 853,214 | 515,494 | -337,720 | -172,094 | -80,334 | -8,049 | -2,127 | 3,471 |
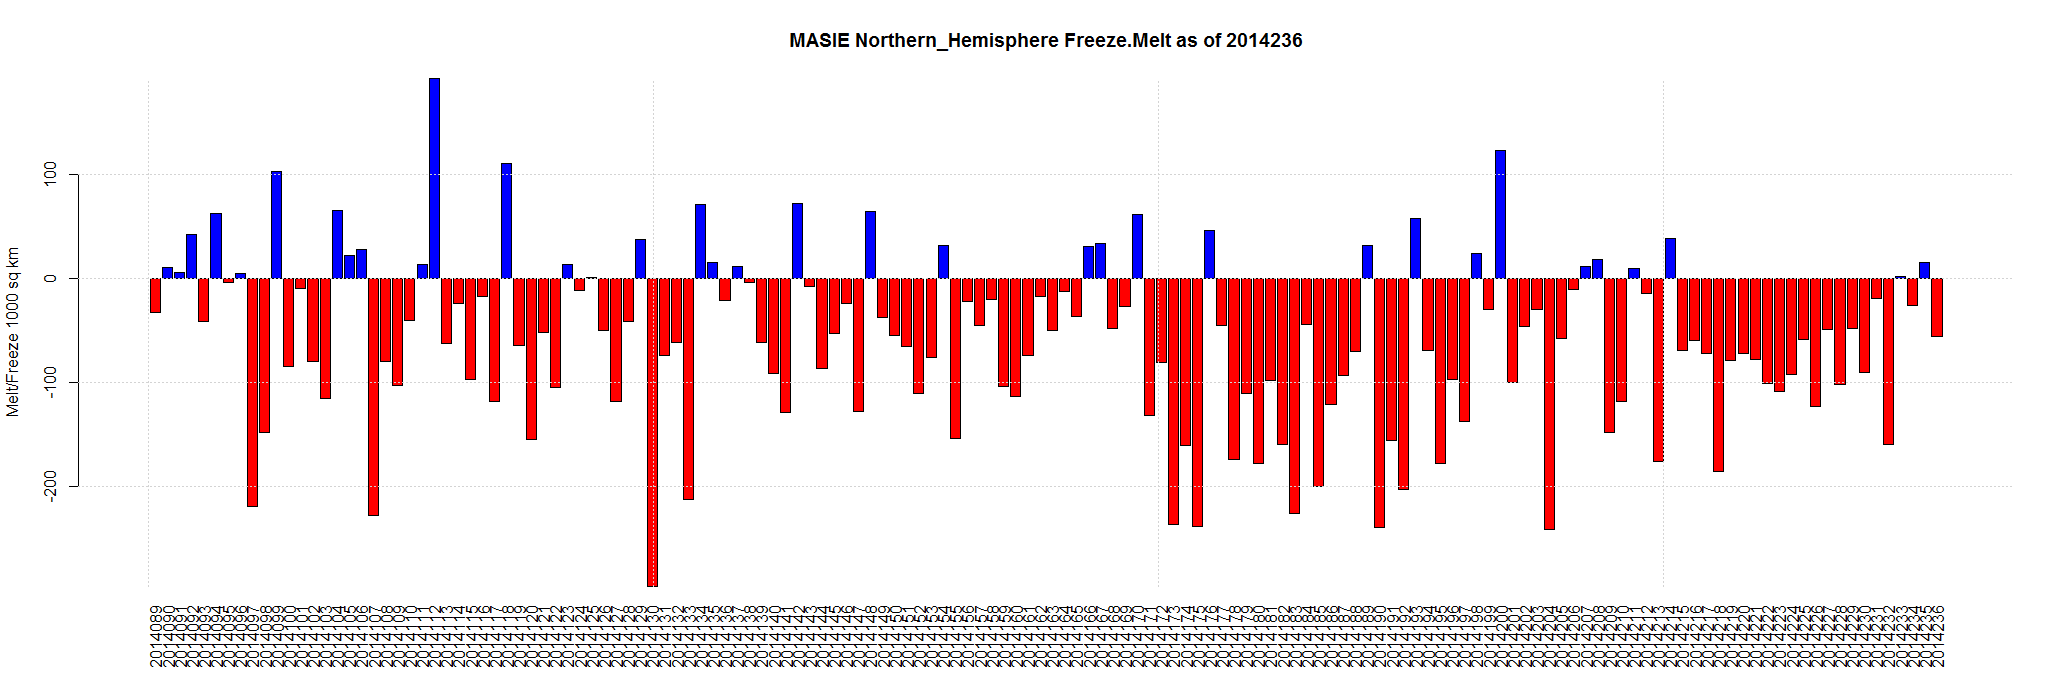
| Northern Hemisphere (Total) | 14,805,115 | 5,799,070 | -9,006,045 | -2,041,975 | -915,954 | -333,251 | -65,842 | -55,671 |
| NH (Average Loss per Day) | -60,443 | -72,928 | -65,425 | -47,607 | -21,947 | -55,671 |

Please excuse my ignorance and I’m sure you have stated this before. What does MASSIE tell us? “Biggest Central Arctic Drop” means what? I want to read this correctly but I’m a knuckle dragger.
“MASIE-NH stands for the Multisensor Analyzed Sea Ice Extent – Northern Hemisphere. It is similar to the Sea Ice Index (SII) product in that it is easy to use and gives a graphical view of ice extent in various formats. However, it relies more on visible imagery than on passive microwave data, so the ice edge position will generally be more accurate than that of the Sea Ice Index. ”
http://nsidc.org/data/masie/about_masie.html
Ah. Thanks.