Sept 15 2014 MASIE Update – Big Melting (Unlike the NSIDC which showed a small gain)
Data here. Click for bigger.
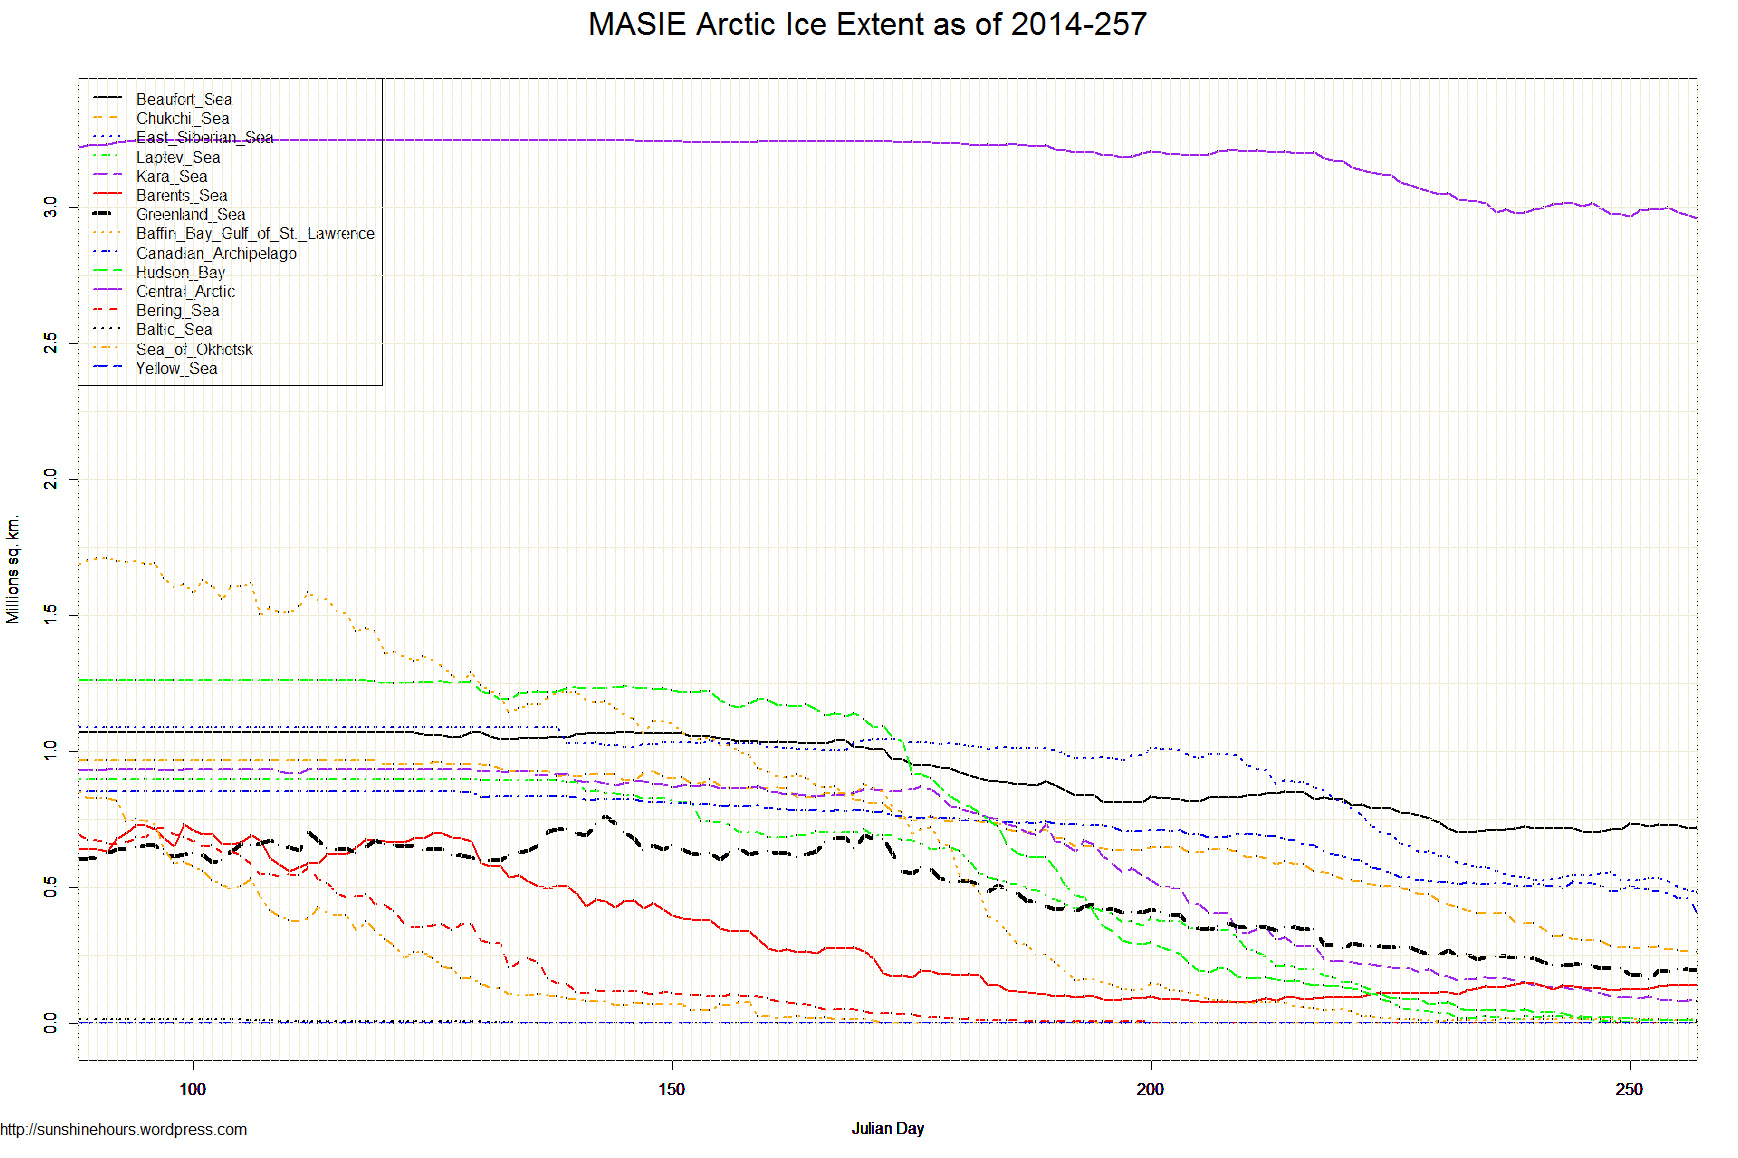
| Region | 170 days ago | End | Last 169 | Last 28 | Last 14 | Last 7 | Last 3 | Last 1 |
| Canadian Archipelago | 853,214 | 410,154 | -443,060 | -113,390 | -85,264 | -93,621 | -69,749 | -49,456 |
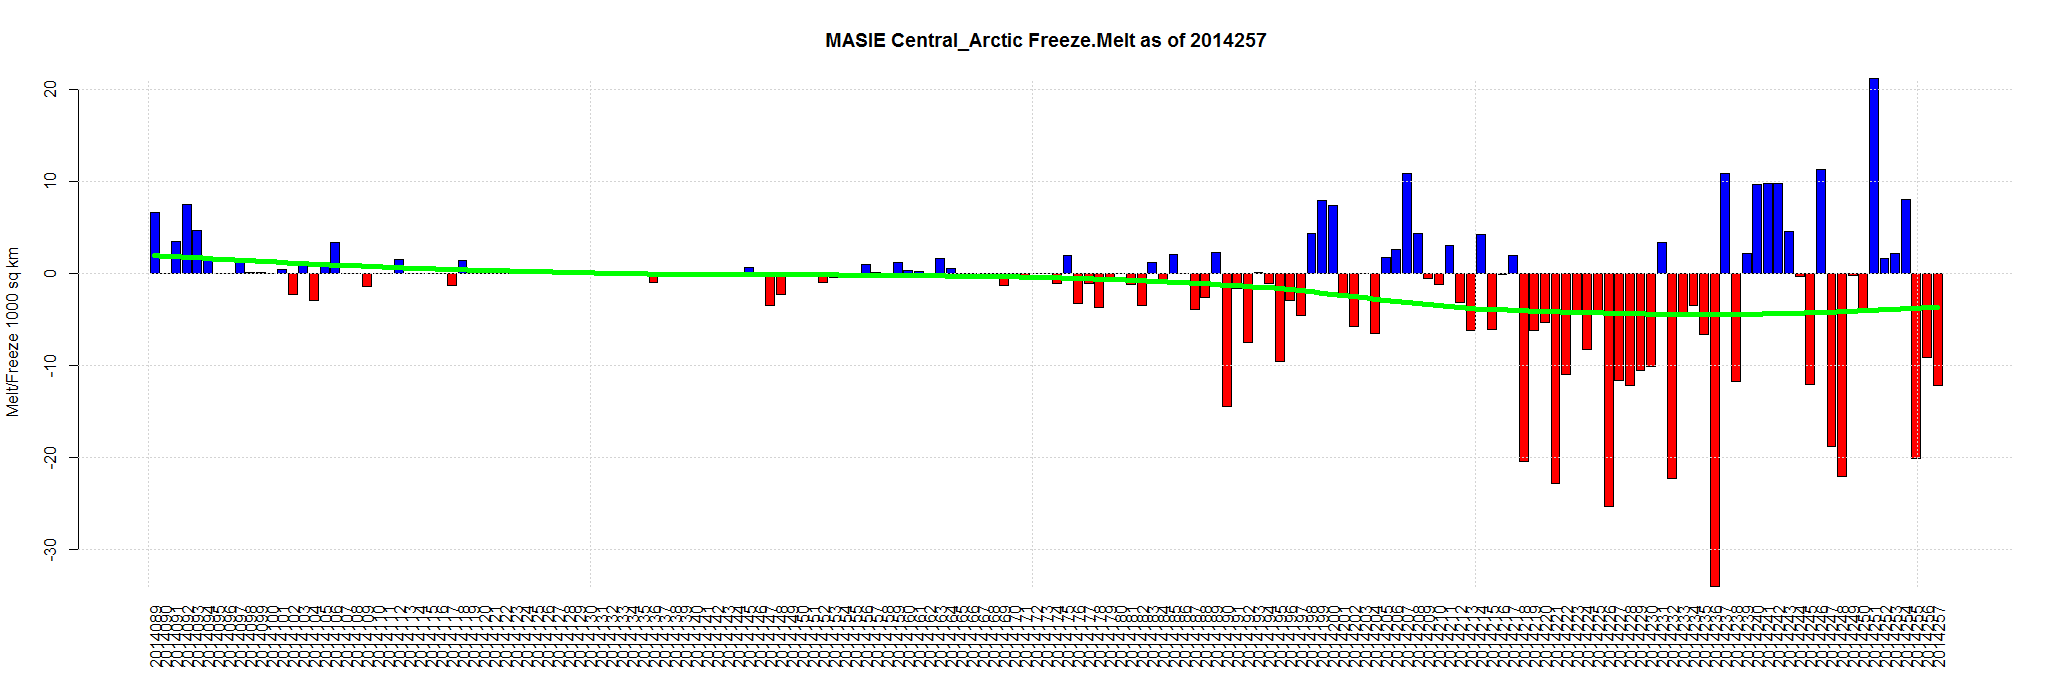
| Central Arctic | 3,221,921 | 2,960,014 | -261,907 | -98,238 | -55,263 | -8,786 | -41,586 | -12,261 |
| Greenland Sea | 603,416 | 194,174 | -409,241 | -58,400 | -20,178 | 13,124 | 3,858 | -6,766 |
| Kara Sea | 933,859 | 81,091 | -852,769 | -119,512 | -50,315 | -15,125 | -3,266 | -5,227 |
| East Siberian Sea | 1,087,137 | 483,793 | -603,344 | -149,103 | -55,548 | -43,748 | -38,896 | -5,178 |
| Chukchi Sea | 966,006 | 260,919 | -705,087 | -215,310 | -63,991 | -20,612 | -13,466 | -4,485 |
| Hudson Bay | 1,260,903 | 7,037 | -1,253,867 | -62,229 | -31,724 | -13,313 | -5,748 | -3,373 |
| Baffin Bay Gulf of St. Lawrence | 1,688,530 | 11,153 | -1,677,377 | -654 | -6,326 | -6,857 | -3,283 | -2,753 |
| Barents Sea | 645,917 | 139,567 | -506,350 | 29,622 | 212 | 14,868 | -95 | -1,974 |
| Laptev Sea | 897,845 | 2,032 | -895,813 | -41,098 | -25,041 | -4,053 | -17 | -217 |
| Bering Sea | 697,324 | 0 | -697,324 | 0 | 0 | 0 | 0 | 0 |
| Baltic Sea | 15,337 | 0 | -15,337 | 0 | 0 | 0 | 0 | 0 |
| Sea of Okhotsk | 853,240 | 0 | -853,240 | 0 | 0 | 0 | 0 | 0 |
| Yellow Sea | 0 | 0 | 0 | 0 | 0 | 0 | 0 | 0 |
| Beaufort Sea | 1,070,445 | 722,391 | -348,054 | -30,543 | 4,457 | -11,800 | -5,098 | 5,997 |
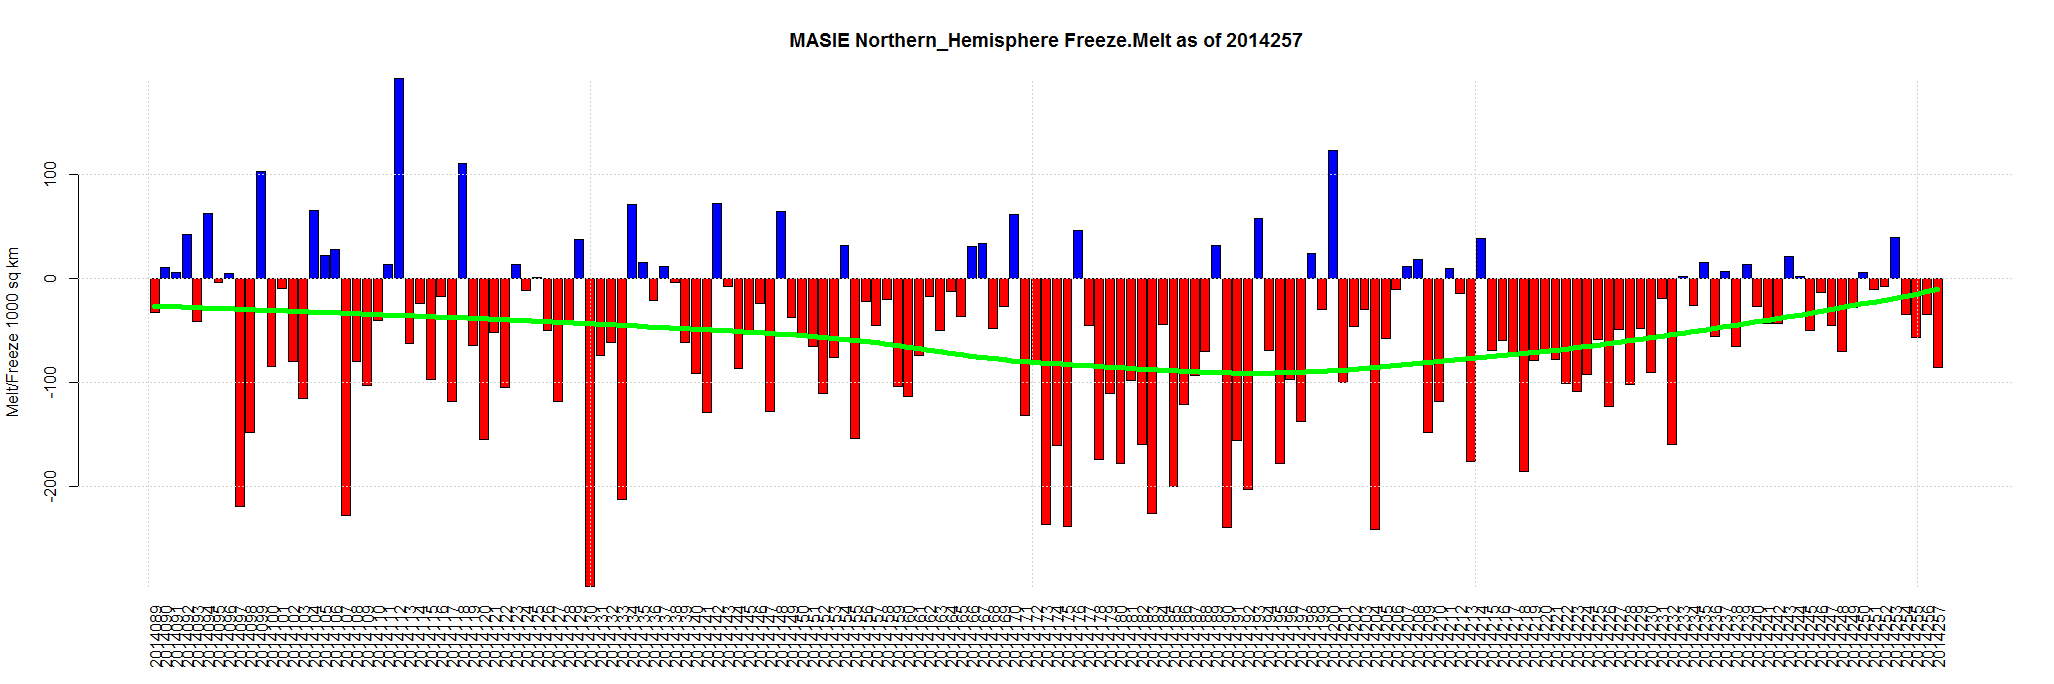
| Northern Hemisphere (Total) | 14,805,115 | 5,273,467 | -9,531,647 | -858,854 | -388,980 | -189,920 | -177,074 | -85,694 |
| NH (Average Loss per Day) | -56,069 | -30,673 | -27,784 | -27,131 | -59,025 | -85,694 |

How about extreme winds compacting the existing ice sheet? The atmospheric temperature has dropped below 267K [ -6C ] -> http://ocean.dmi.dk/arctic/meant80n.uk.php . The Sun is nearly beneath the horizon. The Ocean temperatures are dropping -> http://ocean.dmi.dk/arctic/satellite/index.uk.php .
Supposedly MASIE is better at some things.
http://nsidc.org/data/masie/masie_faq.html
Surprising that MASIE keeps showing declining extent, drawing close to NOAA results.
Day 258: MASIE shows another sizeable loss of 56,257 Km2 for a new 2014 minimum of 5.22 M Km2, or 33.6% of March max.
Losses were widespread with new 2014 minimums in several regions: Chukchi, East Siberian, Laptev, Kara, Canadian Archipelago, Central Arctic.
MASIE extent is still higher than NOAA at 5.02 M Km2 on day 258.
Region Date Reported Ann Min %of Max
(0) Northern_Hemisphere 2014258 5217211 33.6%
(1) Beaufort_Sea 2014246 704681 65.8%
(2) Chukchi_Sea 2014258 254047 26.3%
(3) East_Siberian_Sea 2014258 473472 43.6%
(4) Laptev_Sea 2014258 923 0.1%
(5) Kara_Sea 2014258 73663 7.9%
(6) Barents_Sea 2014248 121208 16.5%
(7) Greenland_Sea 2014252 162018 21.3%
(8) Baffin_Bay_Gulf_of_St._Lawrence 2014230 9776 0.5%
(9) Canadian_Archipelago 2014258 386384 45.3%
(10) Hudson_Bay 2014257 7037 0.6%
(11) Central_Arctic 2014258 2956261 91.0%
I’m not seeing huge losses on the Canadian Ice Service maps for Canadian Archipelago between sep 14 and 15. Wonder who is right?
http://www.bsis-ice.de/IcePortal/CanadianArchipelago.html
Dave, good question. MASIE shows almost 24,000 Km2 lost; you’d think that a loss of 6% of that region’s ice would be noticeable.
Arctic sea is has started to reform. Latest sat picture shows new sea ice forming. All the ice tat did not melt is now multi year ice.
https://mobile.twitter.com/NJSnowFan/status/511878644407754752