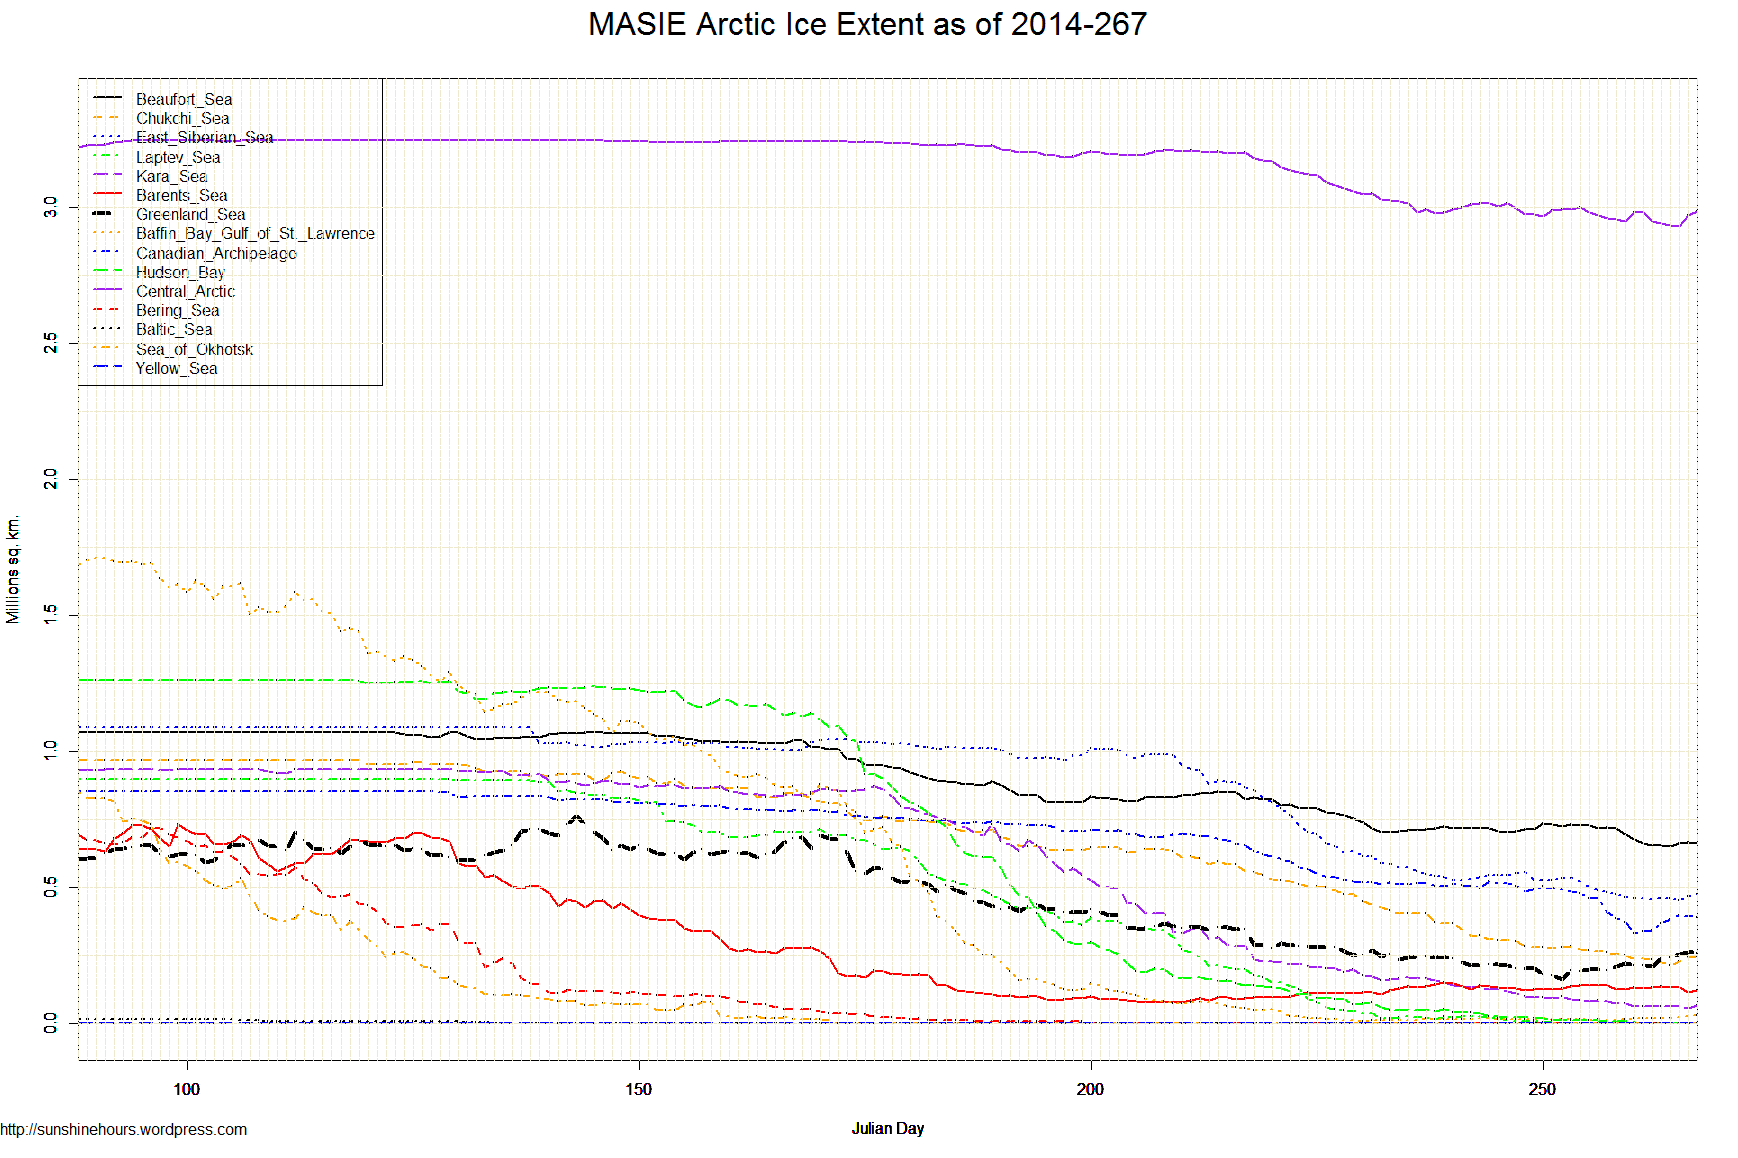
Arctic Sea Ice Extent Sep 27 2014 – -1,146,000 sq km below the 1981-2010 mean. Data for Day 269. Data here.
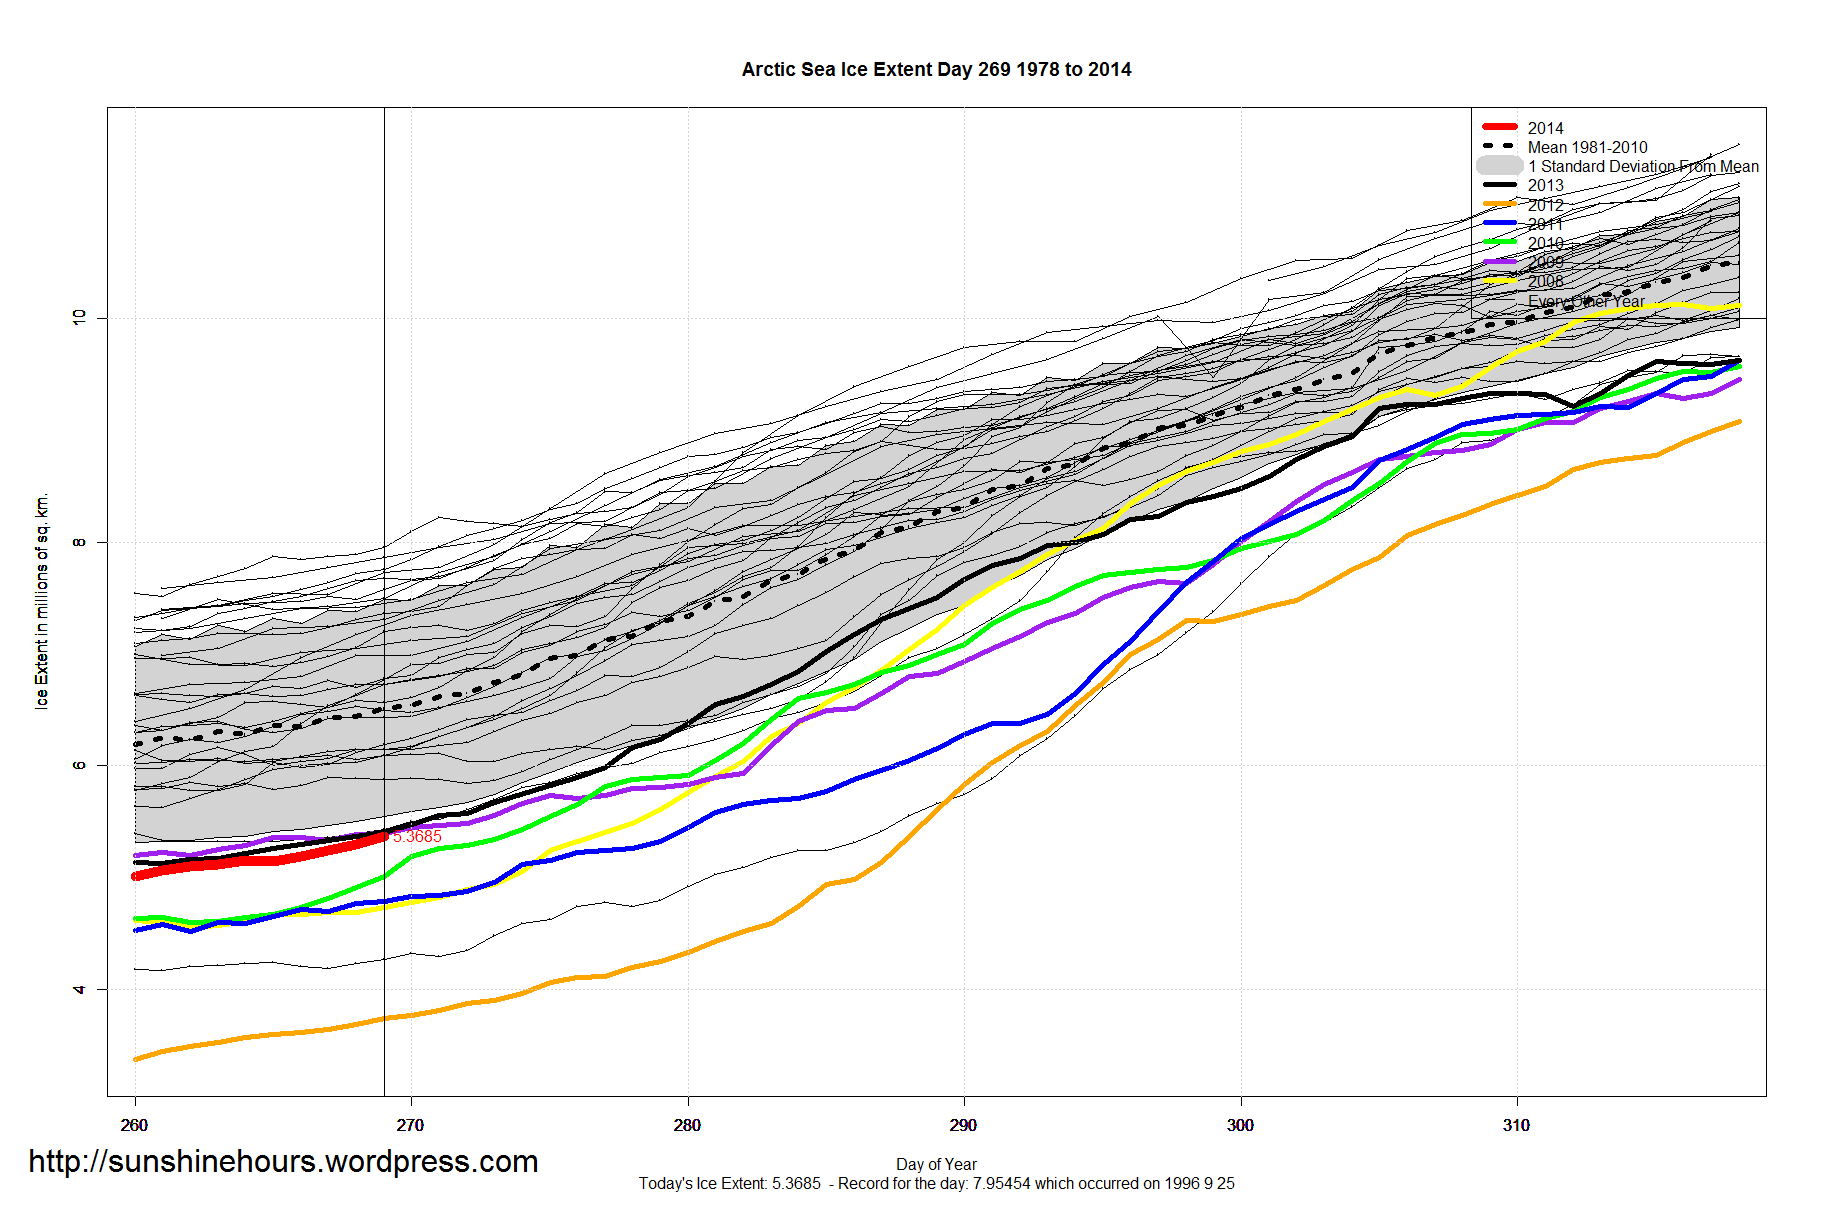

Arctic Sea Ice Extent Sep 27 2014 – -1,146,000 sq km below the 1981-2010 mean. Data for Day 269. Data here.
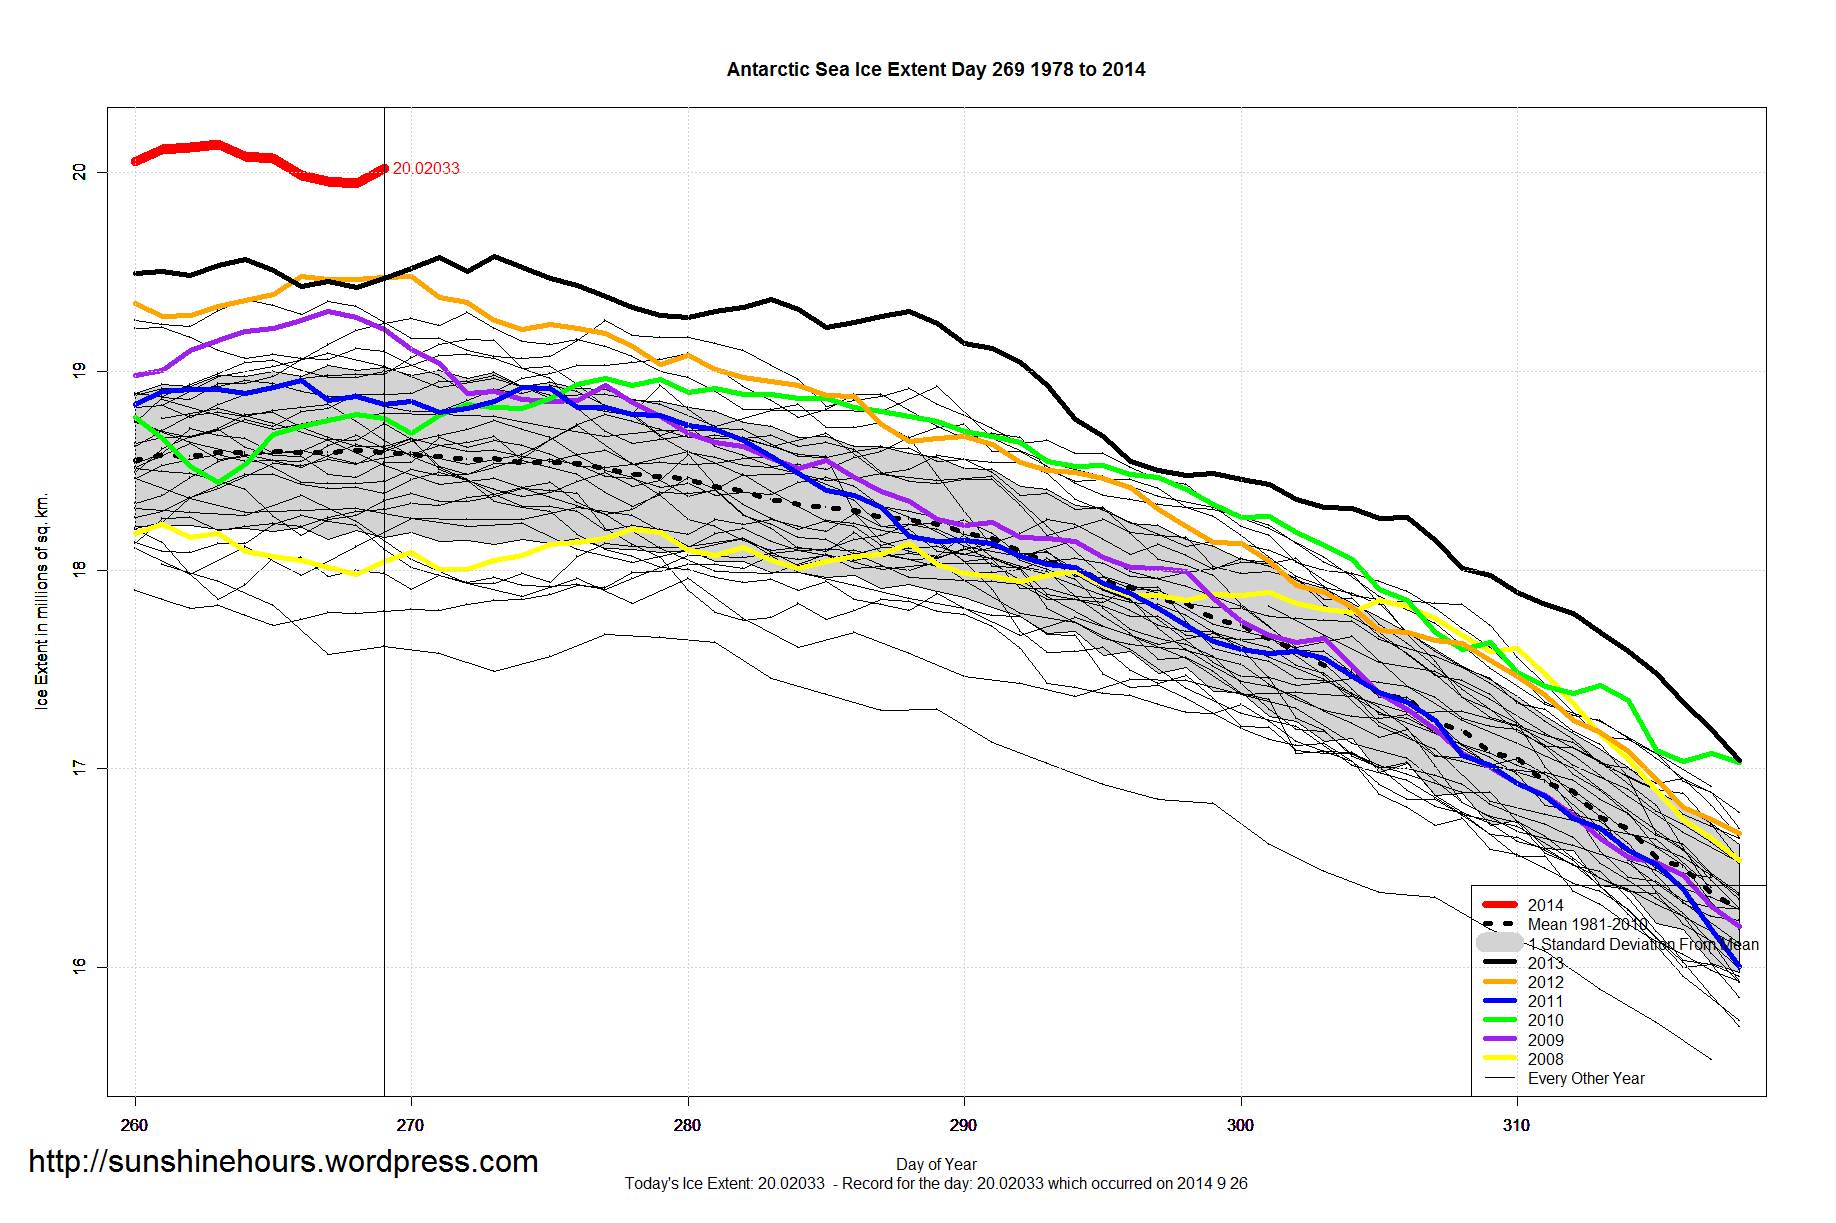
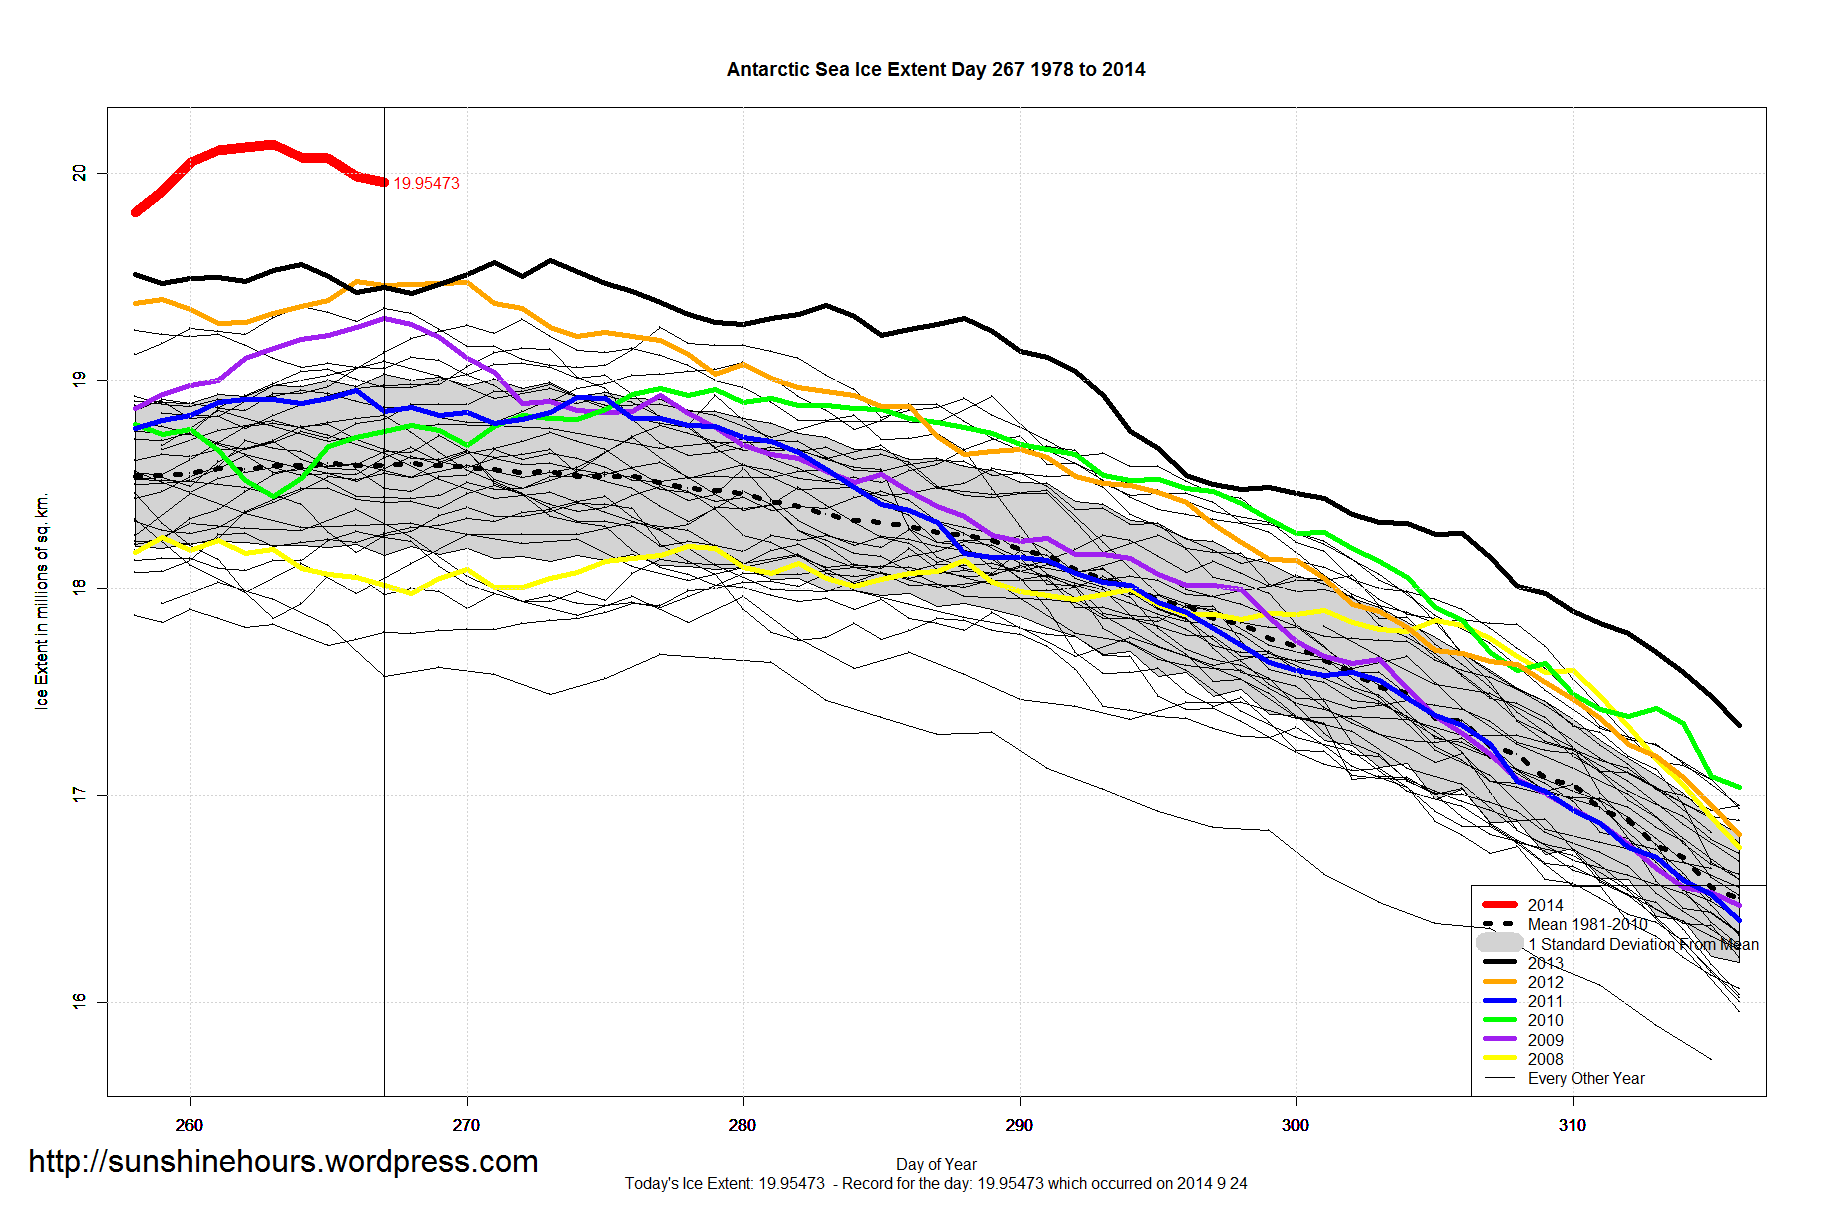
Antarctic Sea Ice Extent Sep 27 2014 – 1,429,000 sq km above the 1981-2010 mean. Data for Day 269. Data here.
7th highest of all-time. Up 80,000 and Above 20 million sq km Again

Update: Back up … but data is still from day 264.
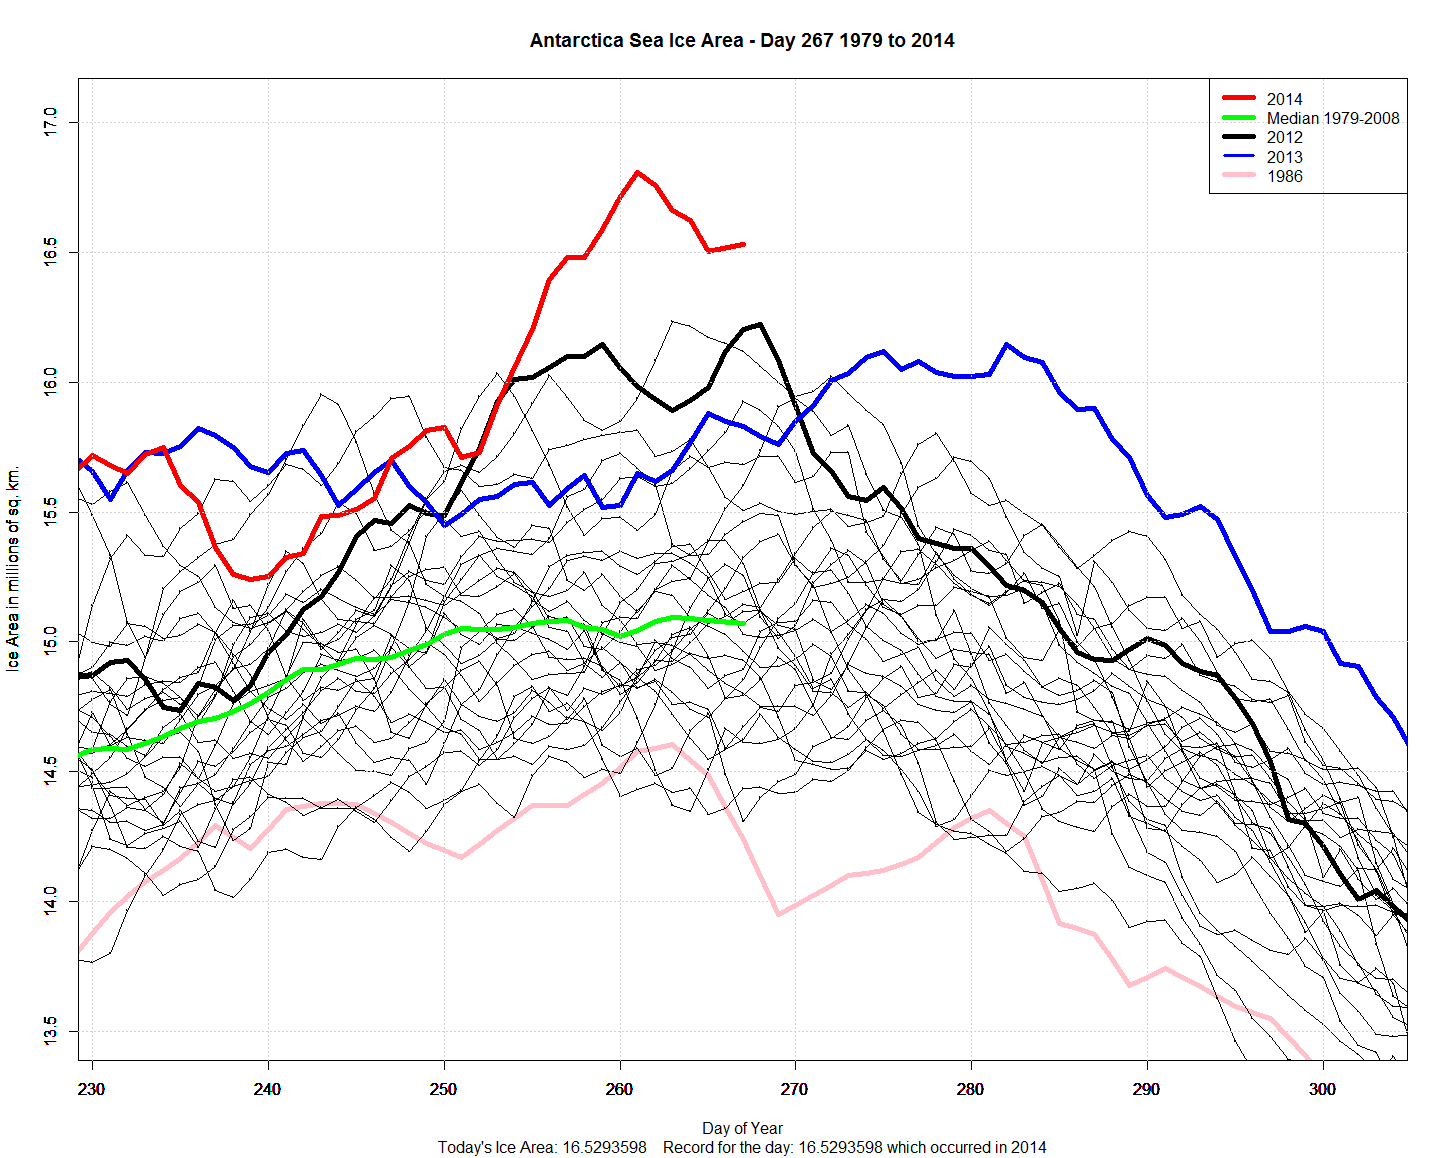
Antarctic Sea Ice Area Data is here normally.
But for the last two days the Cryosphere website has been unreachable.
Maybe someone didn’t like all those all-time records? (Just kidding)
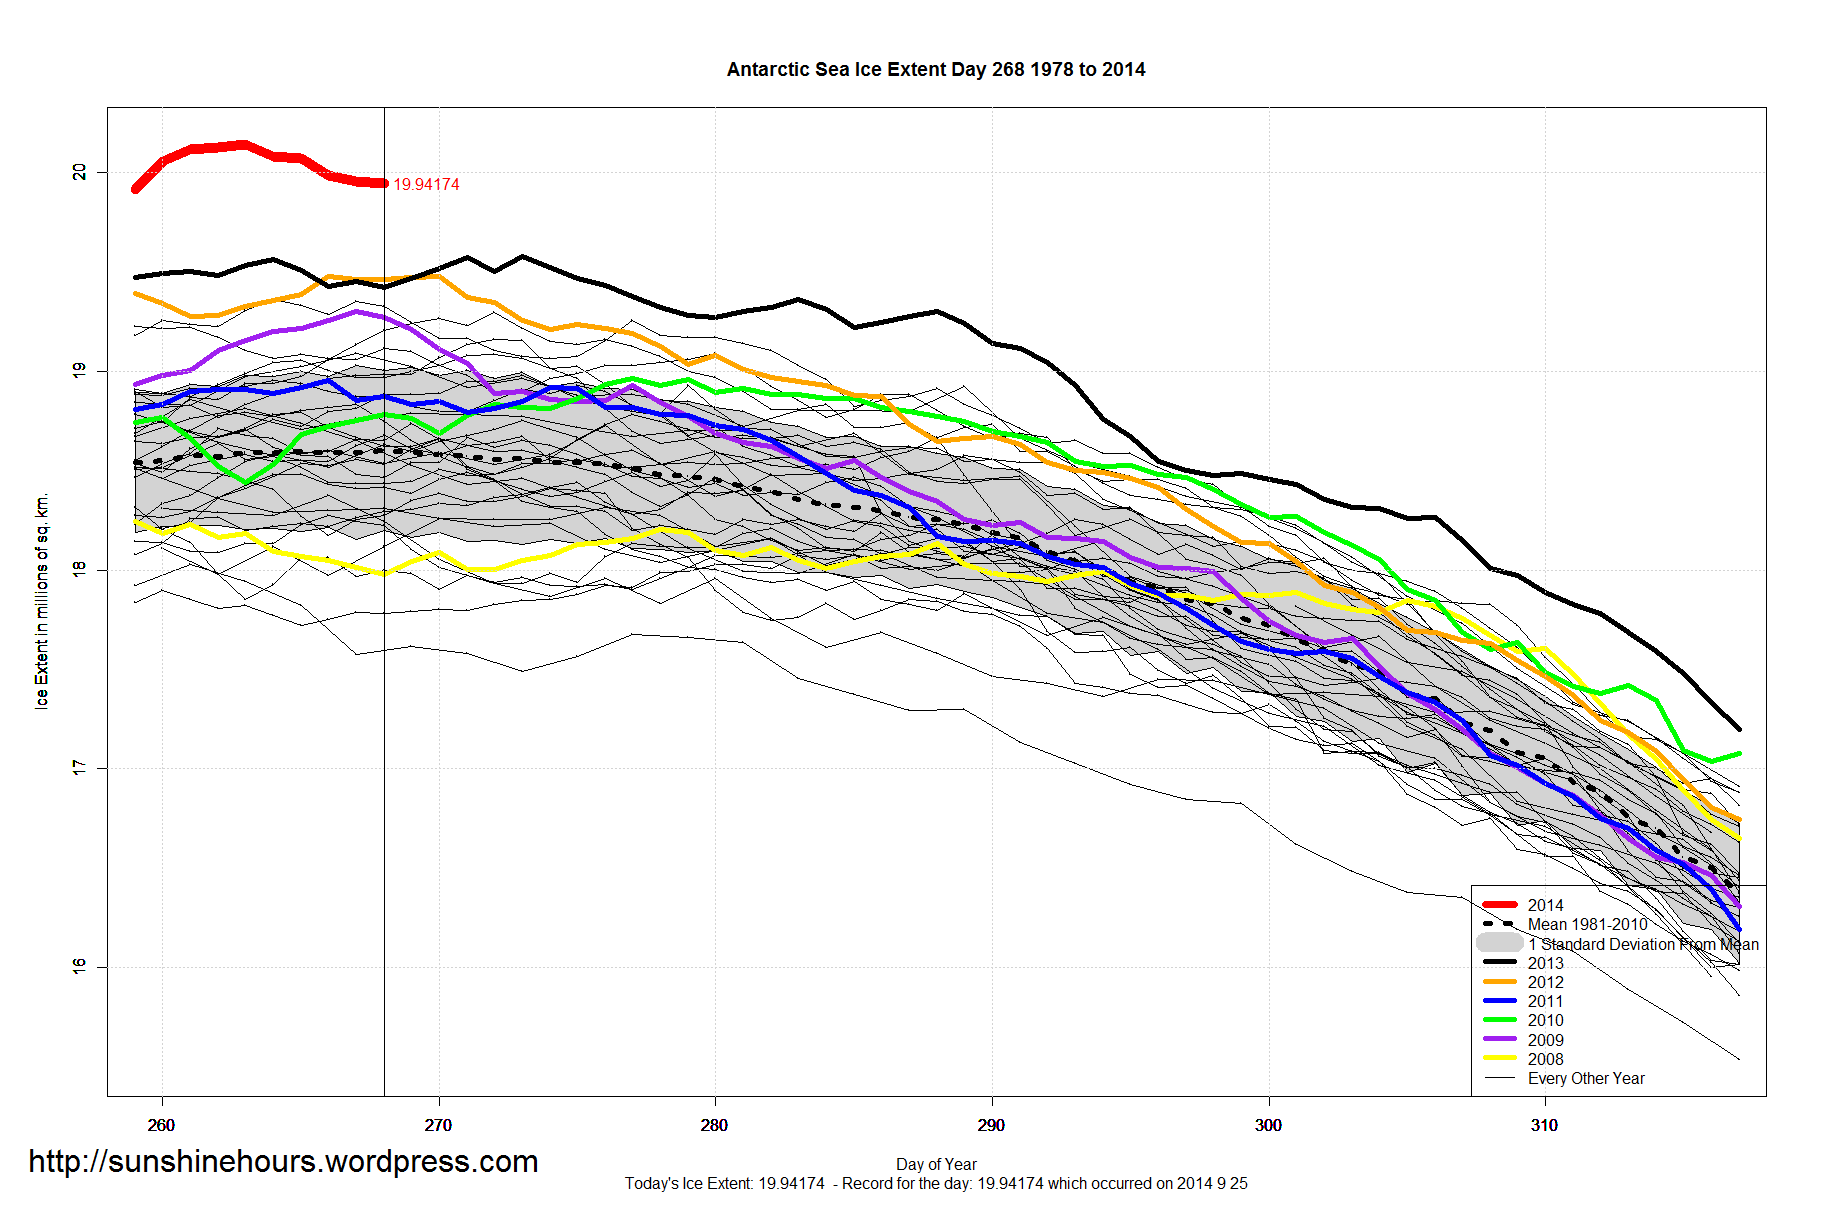
Antarctic Sea Ice Extent Sep 26 2014 – 1,340,000 sq km above the 1981-2010 mean. Data for Day 268. Data here.
520,000 sq km Above Old Daily Record.

Sept 25 2014 MASIE Update – Still Rising
Data here. Click for bigger.
| Region | 180 days ago | End | Last 179 | Last 28 | Last 14 | Last 7 | Last 3 | Last 1 |
| Canadian Archipelago | 853,214 | 391,419 | -461,795 | -114,132 | -95,718 | 59,759 | 7,324 | -3,653 |
| Greenland Sea | 603,416 | 257,228 | -346,188 | 13,929 | 60,723 | 43,314 | 15,346 | -3,582 |
| Beaufort Sea | 1,070,445 | 661,660 | -408,785 | -61,549 | -71,575 | -16,805 | 8,374 | -2,906 |
| Hudson Bay | 1,260,903 | 1,448 | -1,259,455 | -49,997 | -11,337 | -2,686 | 586 | 0 |
| Bering Sea | 697,324 | 0 | -697,324 | 0 | 0 | 0 | 0 | 0 |
| Baltic Sea | 15,337 | 0 | -15,337 | 0 | 0 | 0 | 0 | 0 |
| Sea of Okhotsk | 853,240 | 0 | -853,240 | 0 | 0 | 0 | 0 | 0 |
| Yellow Sea | 0 | 0 | 0 | 0 | 0 | 0 | 0 | 0 |
| Laptev Sea | 897,845 | 1,348 | -896,496 | -23,778 | -446 | 461 | 263 | 263 |
| Baffin Bay Gulf of St. Lawrence | 1,688,530 | 29,244 | -1,659,286 | 14,800 | 14,808 | 10,960 | 11,595 | 1,568 |
| East Siberian Sea | 1,087,137 | 473,550 | -613,588 | -62,165 | -61,660 | 11,558 | 14,767 | 4,612 |
| Chukchi Sea | 966,006 | 248,893 | -717,114 | -120,926 | -33,303 | 7,775 | 33,138 | 4,866 |
| Barents Sea | 645,917 | 121,894 | -524,024 | -29,671 | -16,269 | -9,884 | -11,143 | 5,549 |
| Kara Sea | 933,859 | 65,747 | -868,113 | -84,949 | -23,099 | 4,013 | 1,817 | 9,465 |
| Central Arctic | 3,221,921 | 2,986,587 | -235,335 | 4,853 | -7,065 | 4,792 | 52,757 | 16,274 |
| Northern Hemisphere (Total) | 14,805,115 | 5,240,159 | -9,564,955 | -513,586 | -244,668 | 113,257 | 134,823 | 32,458 |
| NH (Average Loss per Day) | -53,139 | -18,342 | -17,476 | 16,180 | 44,941 | 32,458 |
Arctic Sea Ice Extent Sep 25 2014 – -1,190,000 sq km below the 1981-2010 mean. Data for Day 267. Data here.
52,000 sq km more.


Antarctic Sea Ice Extent Sep 25 2014 – 1,362,000 sq km above the 1981-2010 mean. Data for Day 267. Data here.
13th Day Above the 2013 Record. 184th Daily Record.

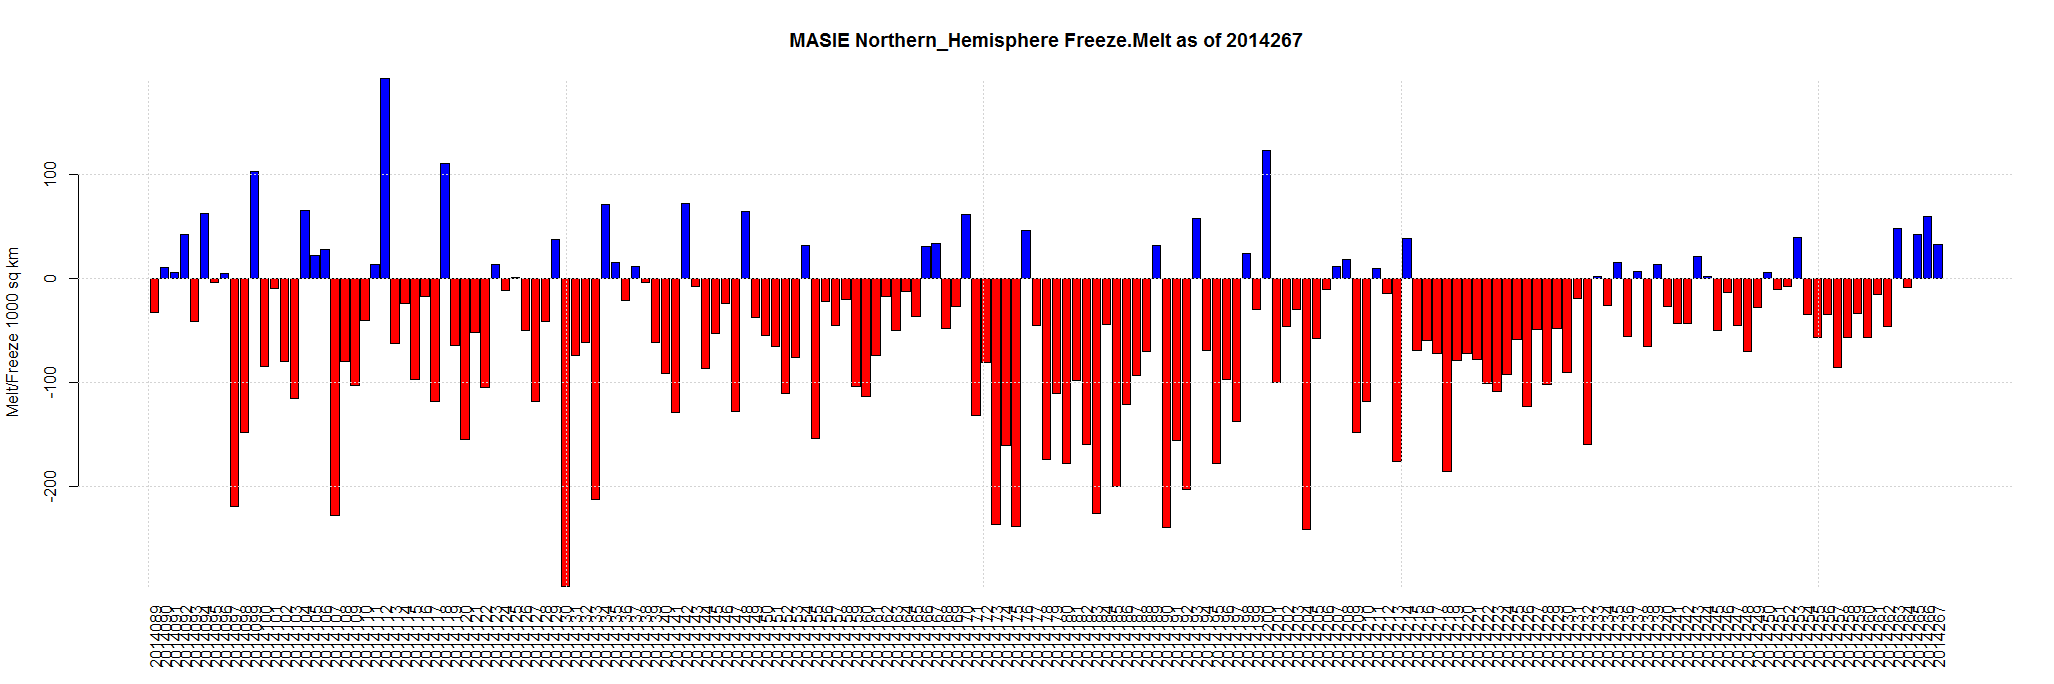
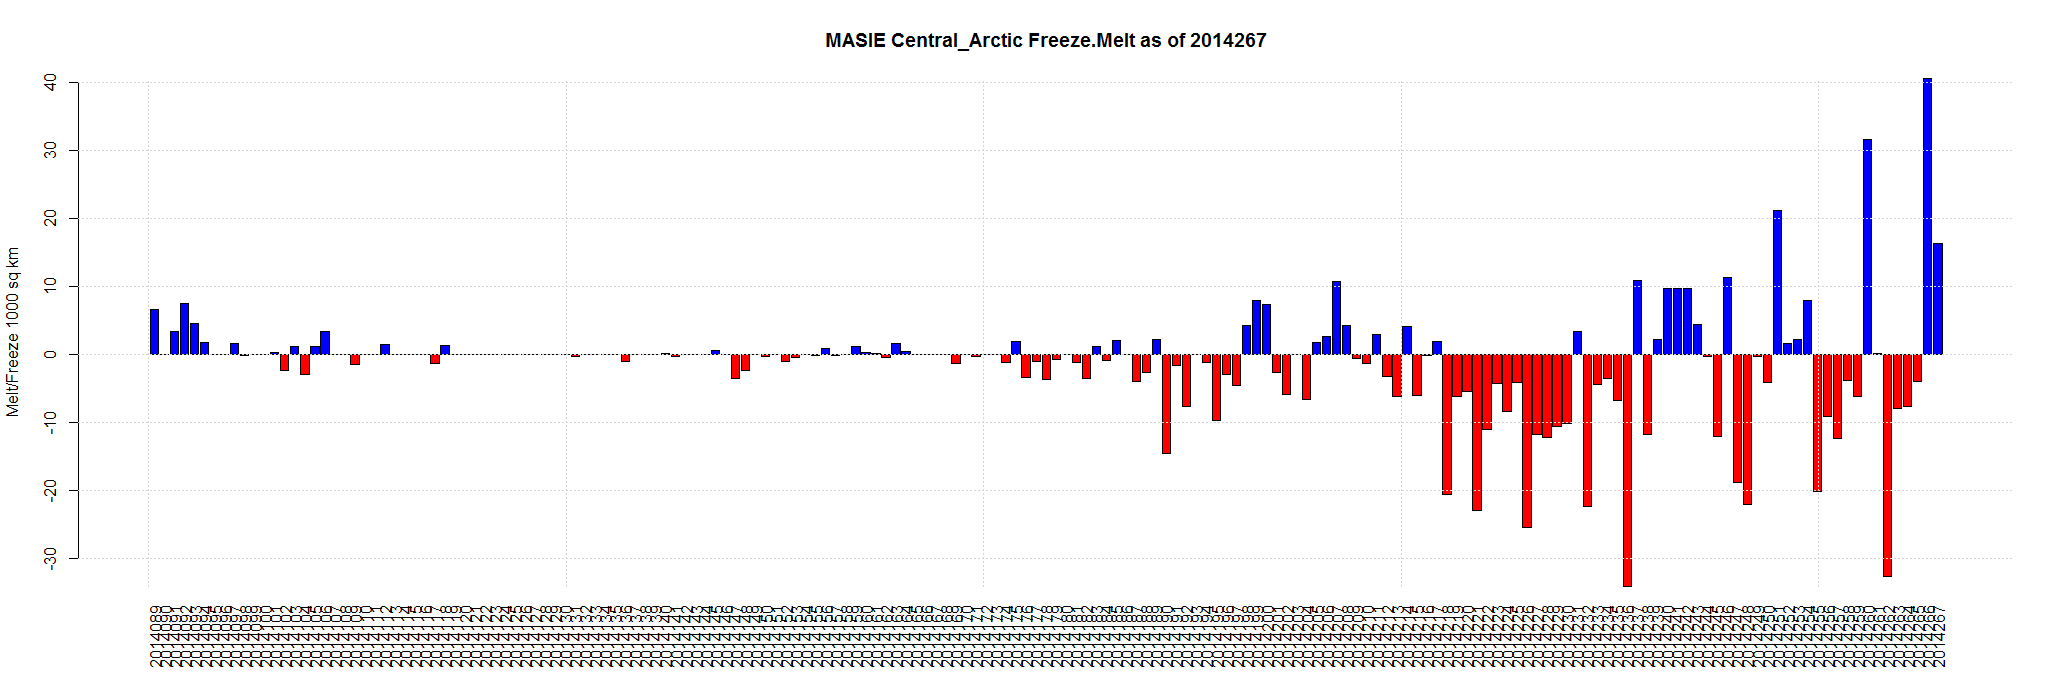
Sept 24 2014 MASIE Update – Big Central Arctic Jump – And 59,000 Increase for NH
Data here. Click for bigger.
| Region | 179 days ago | End | Last 178 | Last 28 | Last 14 | Last 7 | Last 3 | Last 1 |
| Barents Sea | 645,917 | 116,345 | -529,572 | -27,312 | -13,720 | -10,009 | -20,938 | -16,579 |
| Kara Sea | 933,859 | 56,281 | -877,578 | -102,195 | -42,011 | -19,502 | -7,249 | -8,117 |
| Canadian Archipelago | 853,214 | 395,072 | -458,142 | -109,081 | -100,019 | 21,831 | 27,369 | -986 |
| Laptev Sea | 897,845 | 1,086 | -896,759 | -14,076 | -1,326 | 163 | -127 | 0 |
| Bering Sea | 697,324 | 0 | -697,324 | 0 | 0 | 0 | 0 | 0 |
| Baltic Sea | 15,337 | 0 | -15,337 | 0 | 0 | 0 | 0 | 0 |
| Sea of Okhotsk | 853,240 | 0 | -853,240 | 0 | 0 | 0 | 0 | 0 |
| Yellow Sea | 0 | 0 | 0 | 0 | 0 | 0 | 0 | 0 |
| Beaufort Sea | 1,070,445 | 664,565 | -405,880 | -52,797 | -62,181 | -30,762 | 7,663 | 579 |
| Hudson Bay | 1,260,903 | 1,448 | -1,259,455 | -43,828 | -10,054 | -5,916 | 586 | 586 |
| Baffin Bay Gulf of St. Lawrence | 1,688,530 | 27,676 | -1,660,855 | 10,762 | 13,240 | 13,051 | 9,431 | 6,368 |
| Greenland Sea | 603,416 | 260,810 | -342,606 | 17,374 | 98,791 | 40,362 | 19,526 | 7,097 |
| Chukchi Sea | 966,006 | 244,027 | -721,980 | -129,680 | -35,594 | -8,603 | 19,551 | 13,748 |
| East Siberian Sea | 1,087,137 | 468,937 | -618,200 | -72,229 | -63,501 | 3,776 | 8,765 | 16,540 |
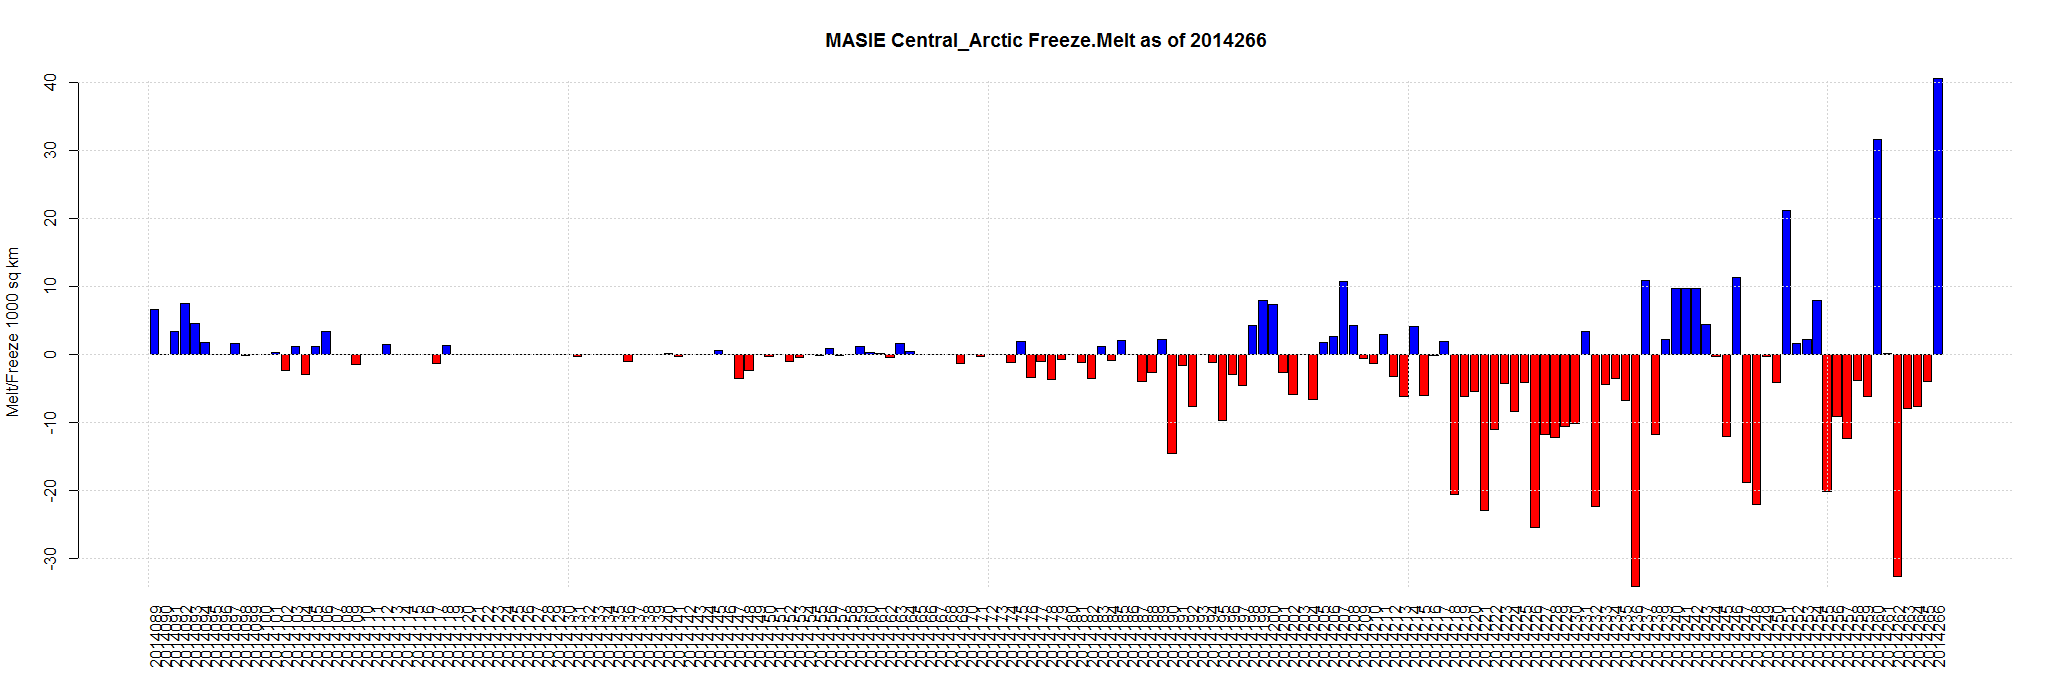
| Central Arctic | 3,221,921 | 2,970,312 | -251,609 | -9,276 | -21,203 | 20,144 | 28,926 | 40,503 |
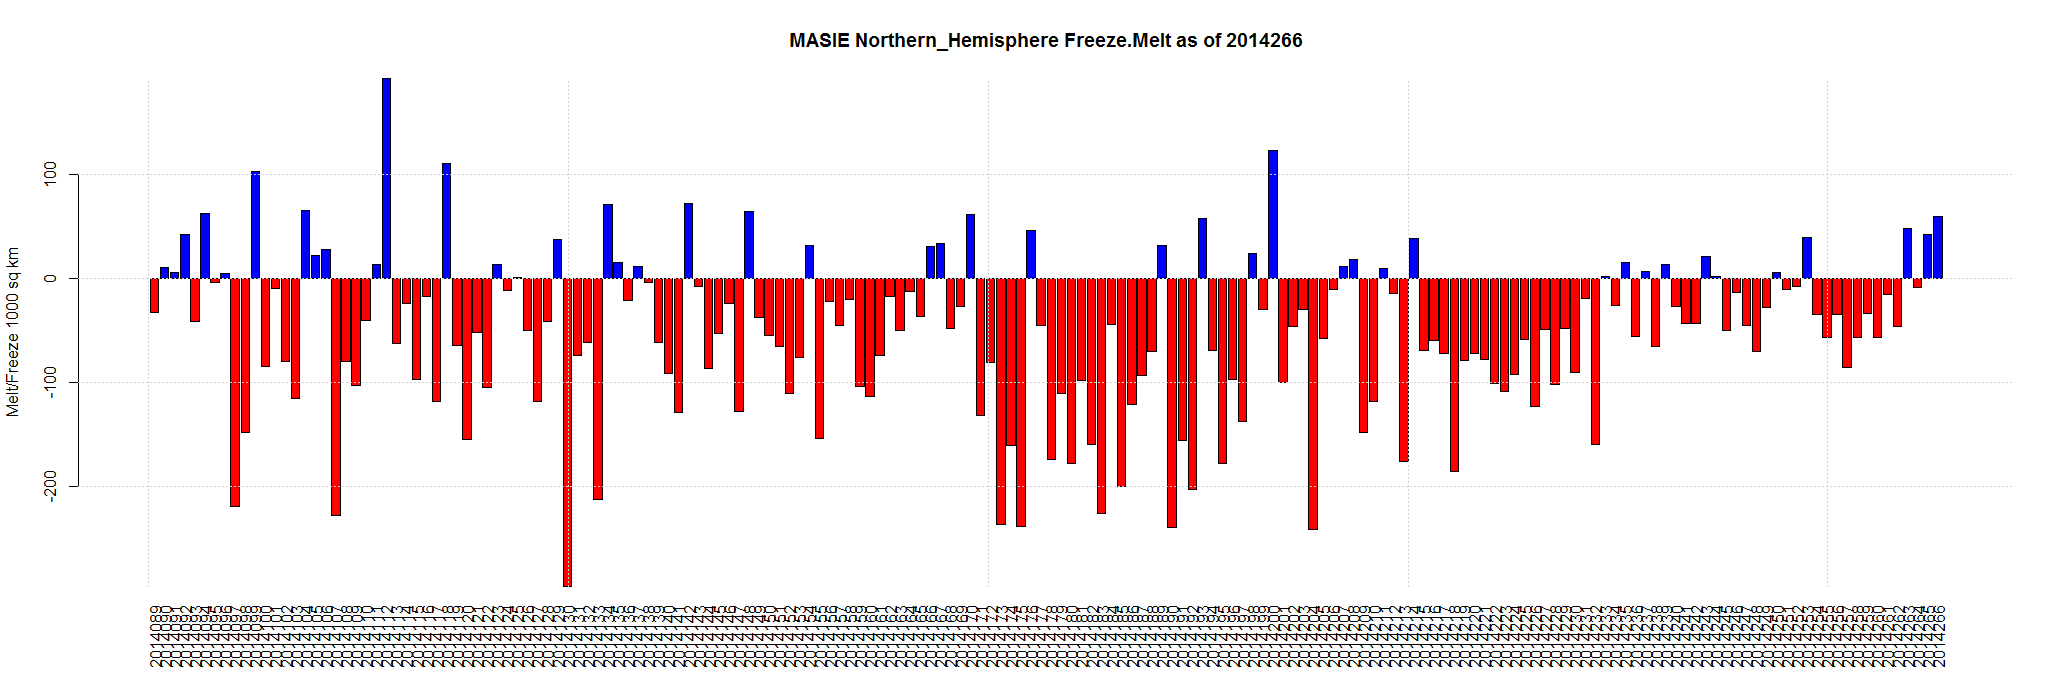
| Northern Hemisphere (Total) | 14,805,115 | 5,207,701 | -9,597,413 | -532,339 | -237,308 | 24,535 | 93,503 | 59,738 |
| NH (Average Loss per Day) | -53,617 | -19,012 | -16,951 | 3,505 | 31,168 | 59,738 |
Arctic Sea Ice Extent Sep 24 2014 – -1,167,000 sq km below the 1981-2010 mean. Data for Day 266. Data here.