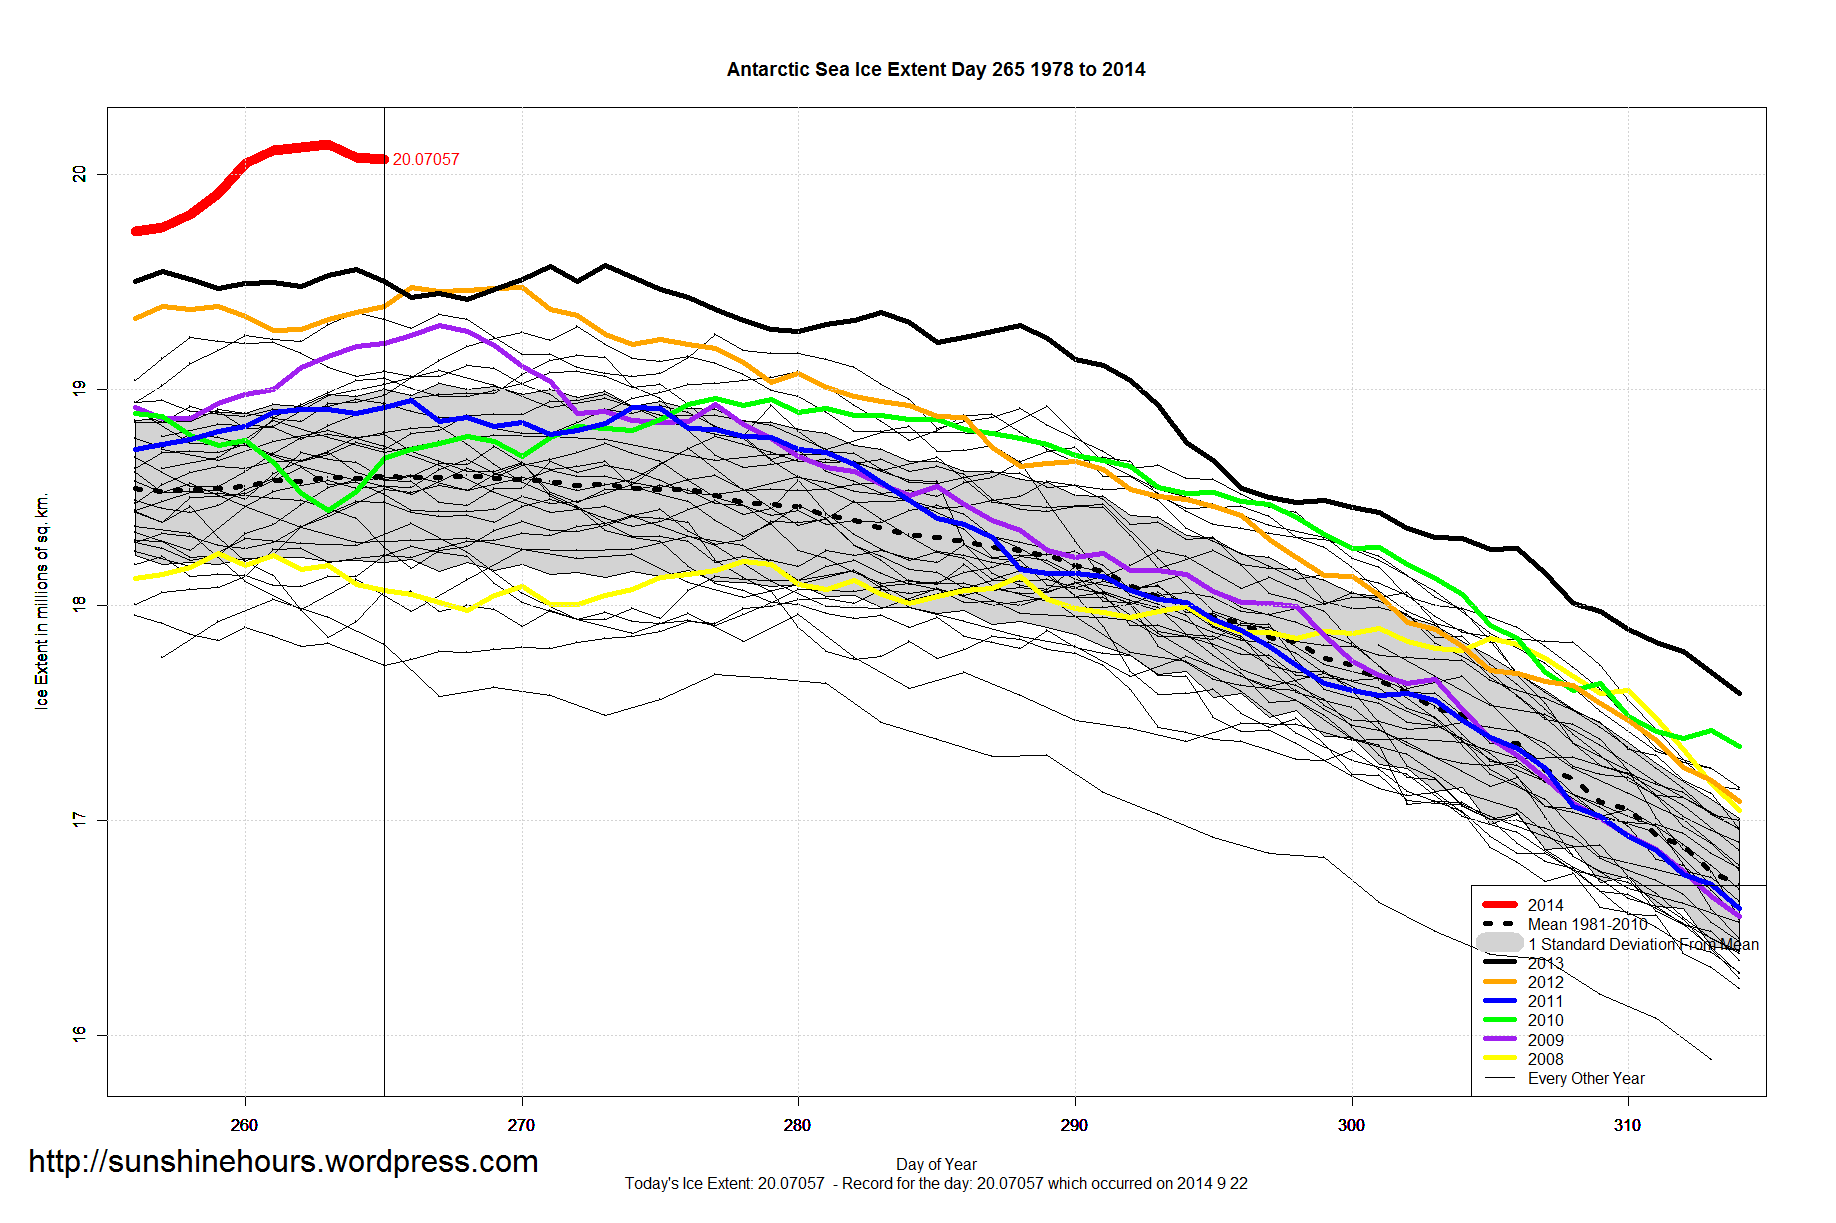
Antarctic Sea Ice Extent Sep 24 2014 – 1,392,000 sq km above the 1981-2010 mean. Data for Day 266. Data here.
Extent spent 6 days above 20,000,000 sq km. It is now the 12th day above the 2013 record.


Antarctic Sea Ice Extent Sep 24 2014 – 1,392,000 sq km above the 1981-2010 mean. Data for Day 266. Data here.
Extent spent 6 days above 20,000,000 sq km. It is now the 12th day above the 2013 record.
Arctic Sea Ice Extent Sep 23 2014 – -1,222,000 sq km below the 1981-2010 mean. Data for Day 265. Data here.


Global Sea Ice Extent Sep 23 2014 – 250,000 sq km above the 1981-2010 mean. Data for Day 265. Data here.


Antarctic Sea Ice Extent Sep 23 2014 – 1,471,000 sq km above the 1981-2010 mean. Data for Day 265. Data here.
Only a 7,500 sq km drop. Maybe one more surprise? In 2013 a new record was set on day 273 which is still a week away.

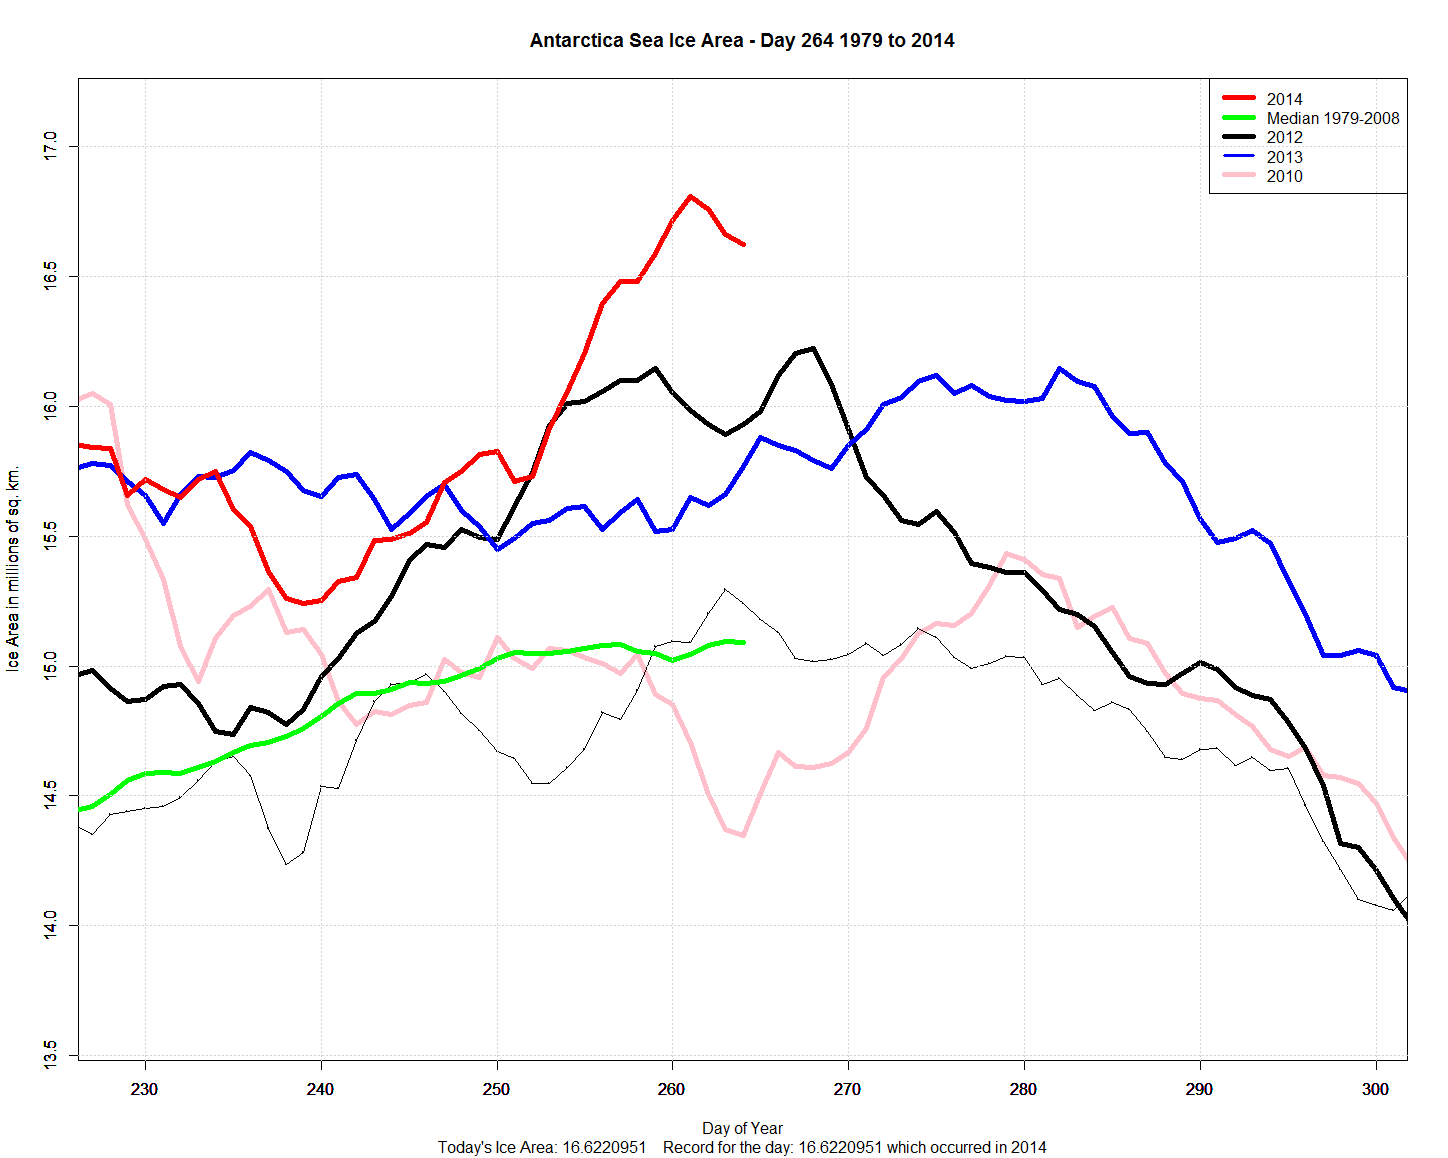
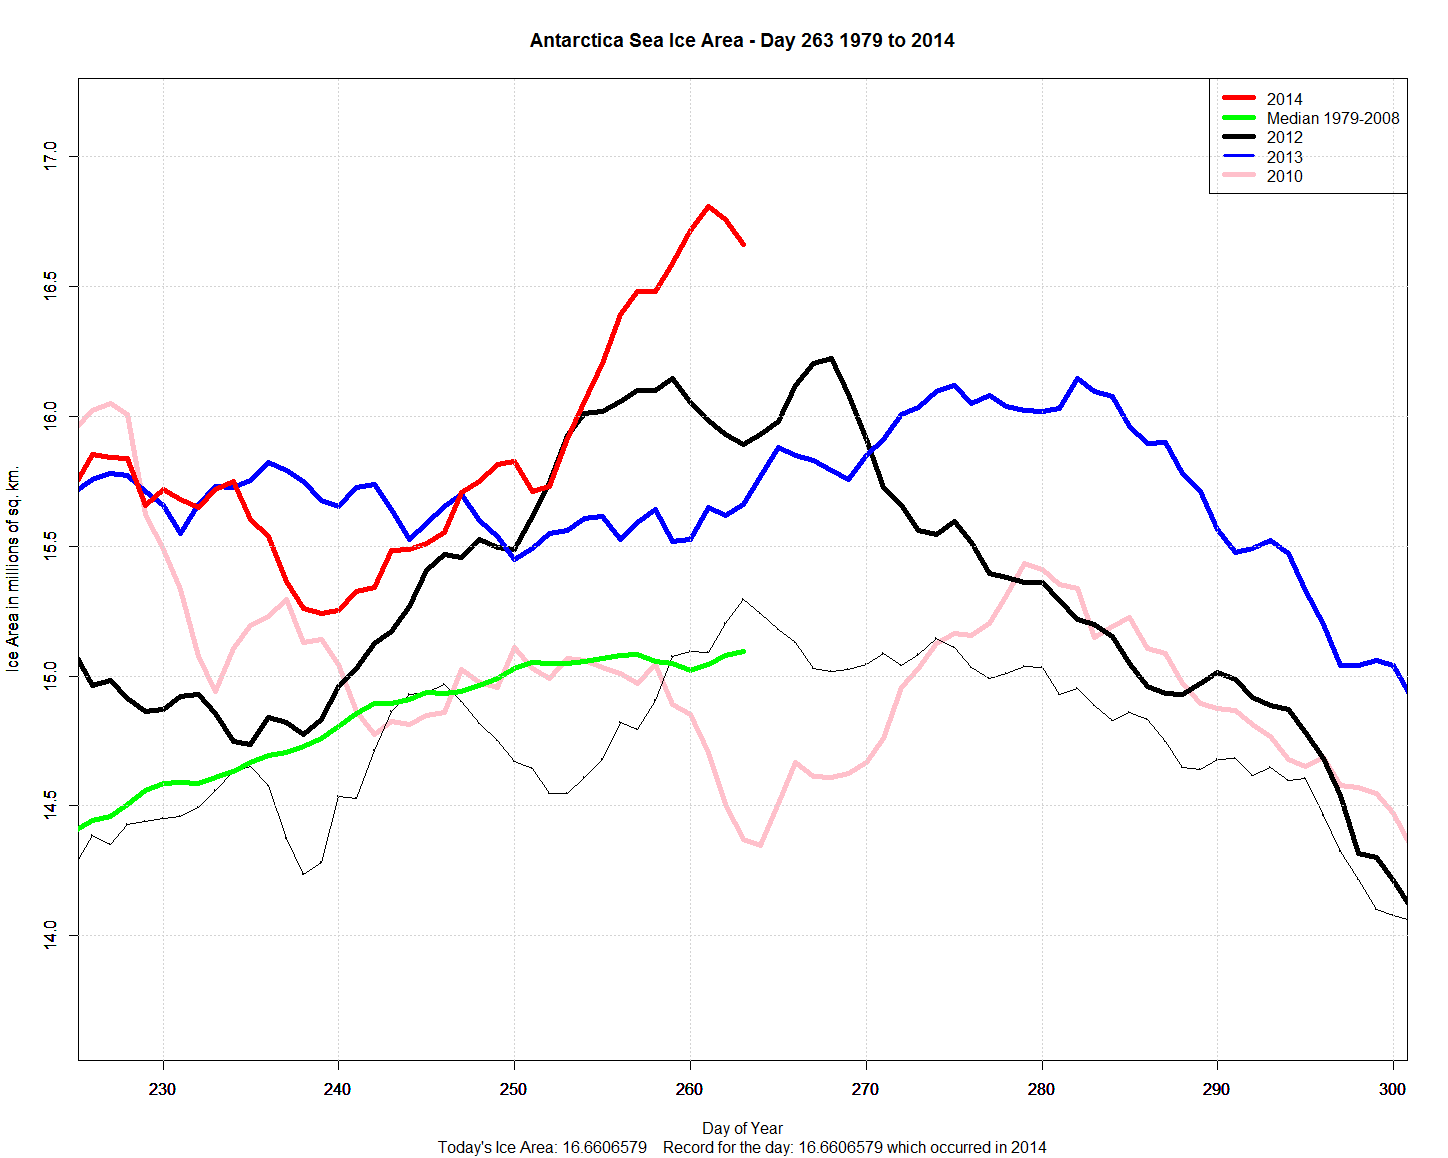
Antarctic Sea Ice Area maximum has probably occurred 2 days ago (difference between Area/Extent here)
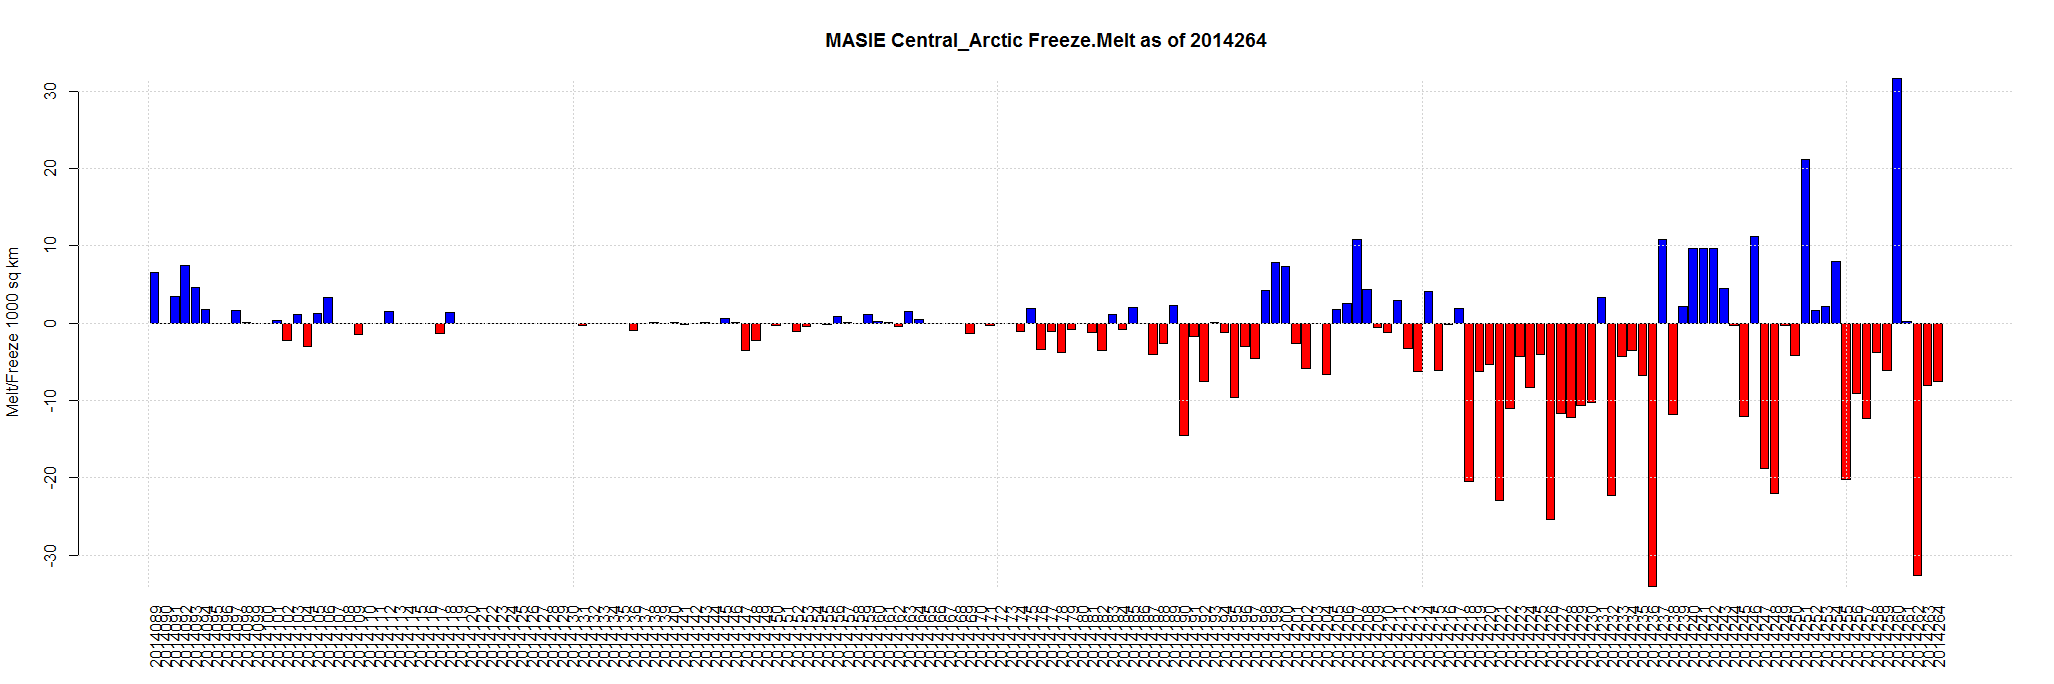
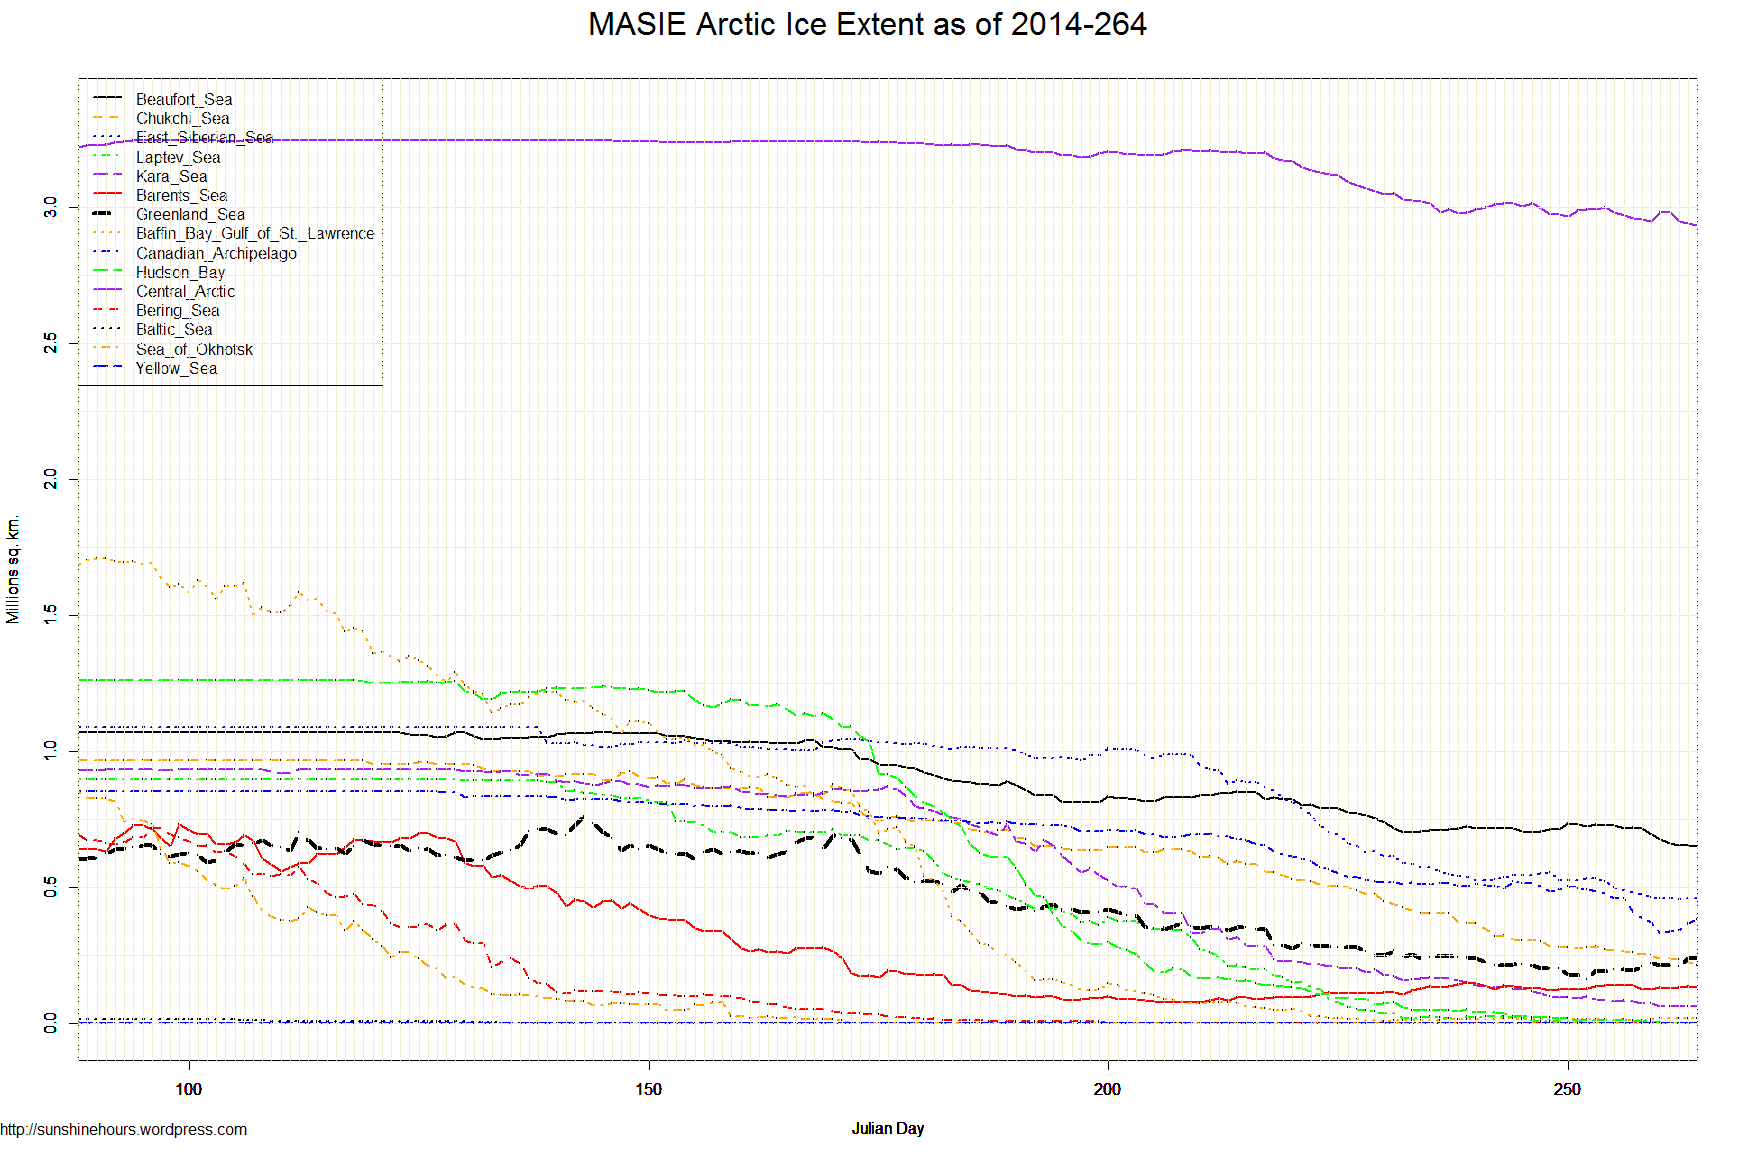
Sept 22 2014 MASIE Update – Still Melting
Data here. Click for bigger.
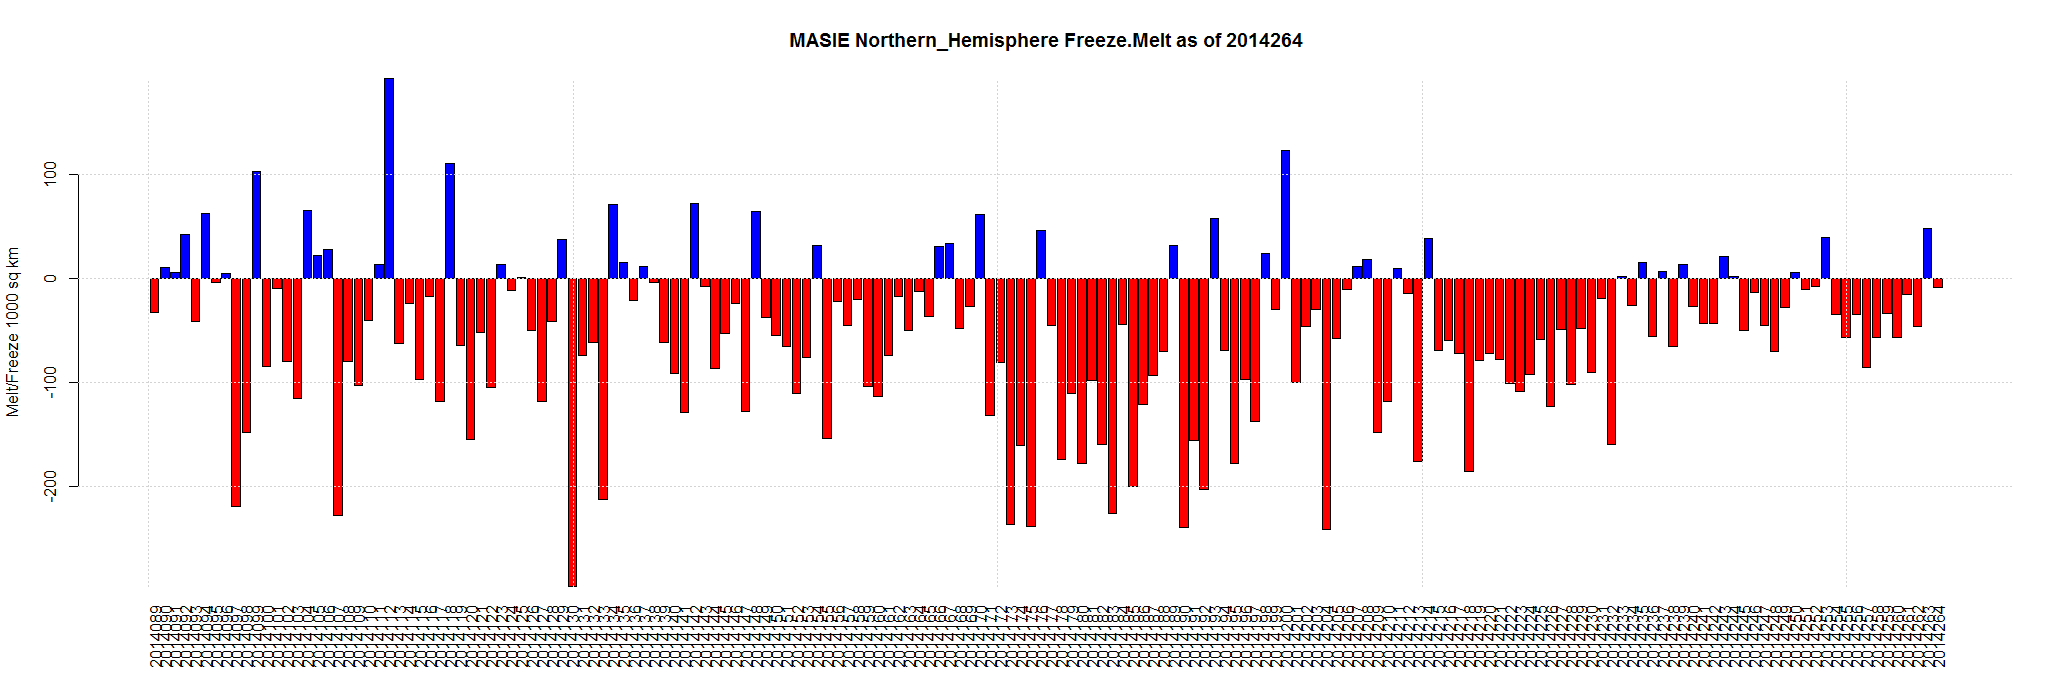
| Region | 177 days ago | End | Last 176 | Last 28 | Last 14 | Last 7 | Last 3 | Last 1 |
| Chukchi Sea | 966,006 | 215,755 | -750,251 | -189,098 | -65,776 | -45,164 | -24,438 | -8,721 |
| Central Arctic | 3,221,921 | 2,933,830 | -288,092 | -46,701 | -34,971 | -26,185 | -48,163 | -7,557 |
| Barents Sea | 645,917 | 133,036 | -512,881 | 1,457 | 8,337 | -6,531 | 5,064 | -4,247 |
| Beaufort Sea | 1,070,445 | 653,286 | -417,159 | -57,986 | -80,905 | -69,105 | -7,724 | -3,617 |
| East Siberian Sea | 1,087,137 | 458,783 | -628,355 | -101,278 | -68,758 | -25,010 | -3,003 | -1,390 |
| Baffin Bay Gulf of St. Lawrence | 1,688,530 | 17,649 | -1,670,881 | 7,407 | -361 | 6,496 | -612 | -596 |
| Laptev Sea | 897,845 | 1,086 | -896,759 | -20,338 | -4,999 | -946 | 91 | -127 |
| Hudson Bay | 1,260,903 | 862 | -1,260,041 | -48,876 | -19,487 | -6,174 | -860 | 0 |
| Bering Sea | 697,324 | 0 | -697,324 | 0 | 0 | 0 | 0 | 0 |
| Baltic Sea | 15,337 | 0 | -15,337 | 0 | 0 | 0 | 0 | 0 |
| Sea of Okhotsk | 853,240 | 0 | -853,240 | 0 | 0 | 0 | 0 | 0 |
| Yellow Sea | 0 | 0 | 0 | 0 | 0 | 0 | 0 | 0 |
| Kara Sea | 933,859 | 63,930 | -869,929 | -102,526 | -32,286 | -17,161 | 776 | 400 |
| Greenland Sea | 603,416 | 241,882 | -361,534 | -4,396 | 60,832 | 47,708 | 26,132 | 599 |
| Canadian Archipelago | 853,214 | 384,096 | -469,119 | -131,399 | -119,679 | -26,059 | 46,020 | 16,393 |
| Northern Hemisphere (Total) | 14,805,115 | 5,105,336 | -9,699,779 | -693,734 | -358,052 | -168,132 | -6,718 | -8,862 |
| NH (Average Loss per Day) | -54,801 | -24,776 | -25,575 | -24,019 | -2,239 | -8,862 |
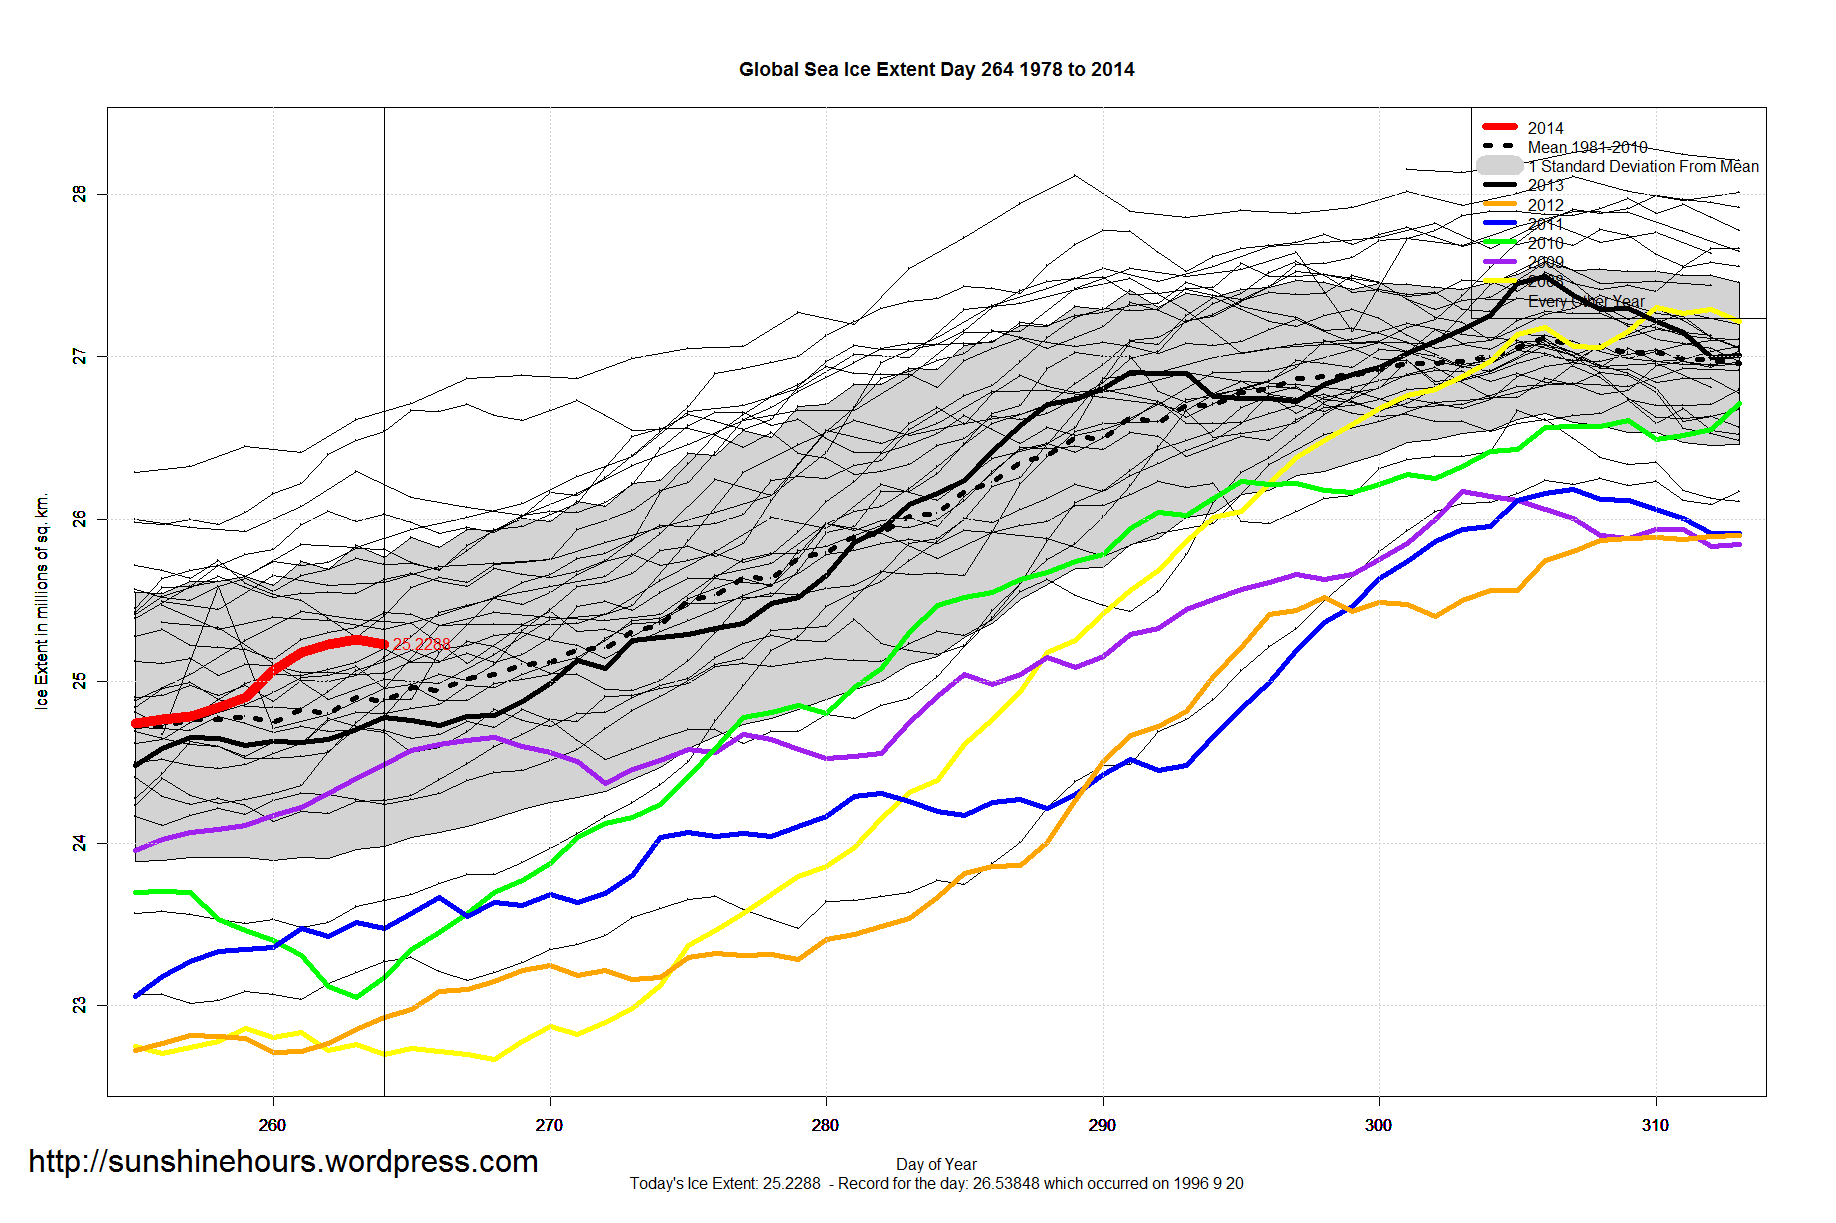
Global Sea Ice Extent Sep 22 2014 – 356,000 sq km above the 1981-2010 mean. Data for Day 264. Data here.
The last time there was more global sea ice extent on day 264 was 1998.
Years with less global sea ice on this day: 1979 1984 1989 1990 1991 1993 1995 1999 2000 2001 2002 2003 2004 2005 2006 2007 2008 2009 2010 2011 2012 2013

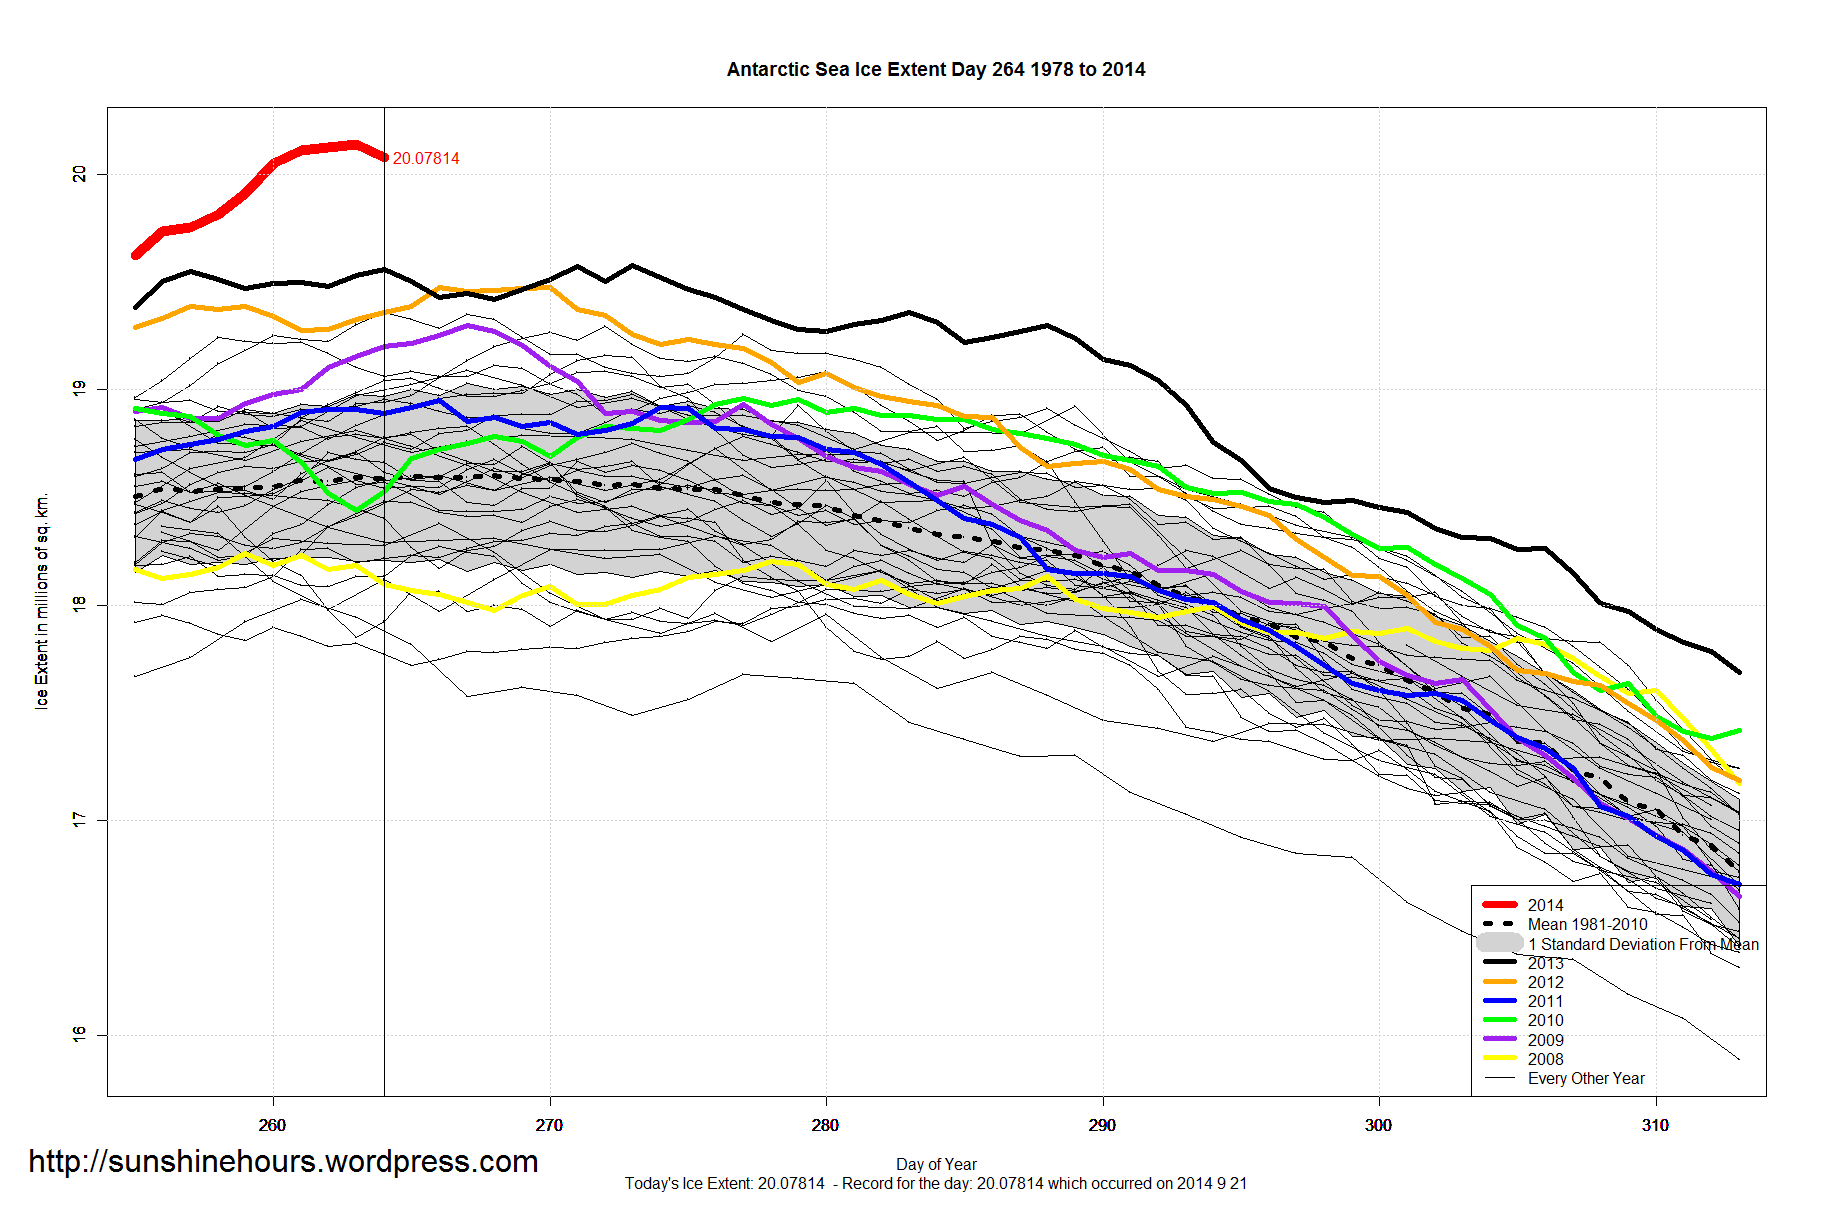
Antarctic Sea Ice Extent Sep 22 2014 – 1,488,000 sq km above the 1981-2010 mean. Data for Day 264. Data here.
Extent has also taken a downwards turn (as has Area). There will be no “10th all-time record in 10 days” this year (unless it gets really weird).
But 2014 will hold the record for most days over 20 million because 2014 is the only year it has ever happened.

Arctic Sea Ice Extent Sep 22 2014 – -1,132,000 sq km below the 1981-2010 mean. Data for Day 264. Data here.
I’ll go out on a limb and say summer is over in the Arctic. Minimum occurred on Sept 16 at 4.98 million sq km and is now 167,000 sq km above that minimum.
It didn’t disappear. Many are disappointed.
Day 259 was the minimum. The latest minimum was day 265 in 1989 and 2005 and the earliest minimum was day 245 in 1987.