Oct 06 2014 MASIE Update – Melting ?
Data here. Click for bigger.
| Region | 191 days ago | End | Last 190 | Last 28 | Last 14 | Last 7 | Last 3 | Last 1 |
| Greenland Sea | 603,416 | 276,254 | -327,162 | 95,204 | 34,372 | 14,936 | -24,807 | -20,089 |
| Beaufort Sea | 1,070,445 | 694,045 | -376,400 | -40,146 | 40,759 | -7,669 | 6,474 | -12,207 |
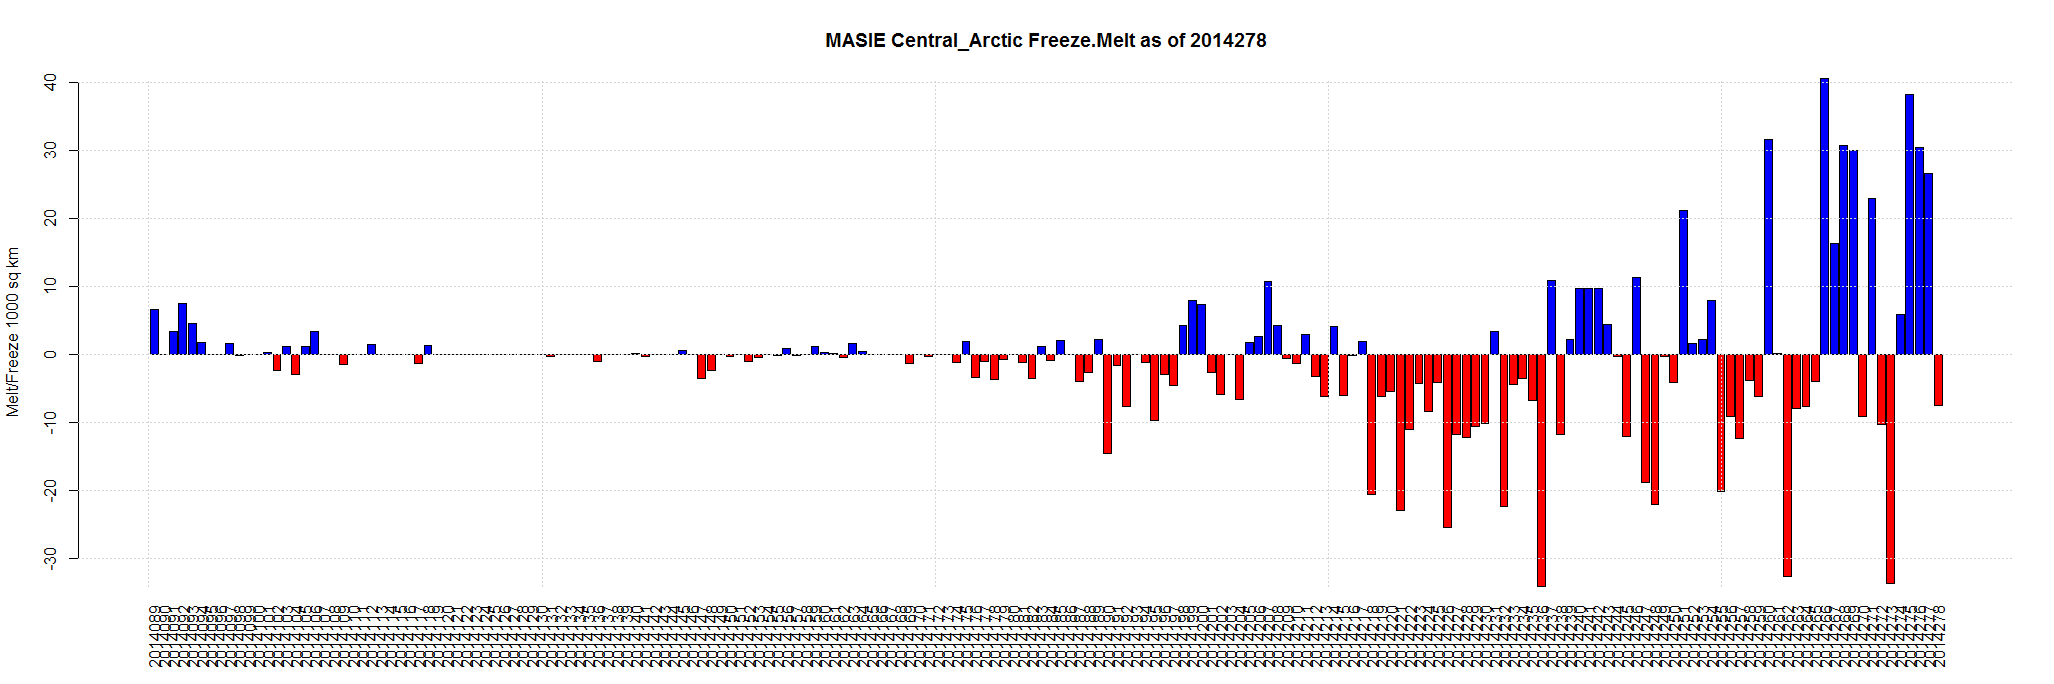
| Central Arctic | 3,221,921 | 3,110,698 | -111,223 | 141,898 | 176,868 | 49,648 | 49,401 | -7,506 |
| East Siberian Sea | 1,087,137 | 492,587 | -594,550 | -34,954 | 33,804 | 38,419 | 9,535 | -7,369 |
| Kara Sea | 933,859 | 117,348 | -816,512 | 21,132 | 53,418 | 45,452 | 36,854 | -3,257 |
| Laptev Sea | 897,845 | 37,106 | -860,739 | 31,021 | 36,020 | 25,057 | 15,250 | -2,012 |
| Canadian Archipelago | 853,214 | 621,274 | -231,941 | 117,499 | 237,178 | 89,042 | 29,440 | -88 |
| Baffin Bay Gulf of St. Lawrence | 1,688,530 | 49,269 | -1,639,262 | 31,259 | 31,620 | 18,467 | -191 | 0 |
| Hudson Bay | 1,260,903 | 10,375 | -1,250,528 | -9,974 | 9,513 | 8,927 | 0 | 0 |
| Bering Sea | 697,324 | 0 | -697,324 | 0 | 0 | 0 | 0 | 0 |
| Baltic Sea | 15,337 | 0 | -15,337 | 0 | 0 | 0 | 0 | 0 |
| Sea of Okhotsk | 853,240 | 0 | -853,240 | 0 | 0 | 0 | 0 | 0 |
| Yellow Sea | 0 | 0 | 0 | 0 | 0 | 0 | 0 | 0 |
| Barents Sea | 645,917 | 163,670 | -482,247 | 38,971 | 30,634 | 46,750 | 22,670 | 5,113 |
| Chukchi Sea | 966,006 | 292,878 | -673,128 | 11,347 | 77,123 | 11,356 | 27,743 | 7,105 |
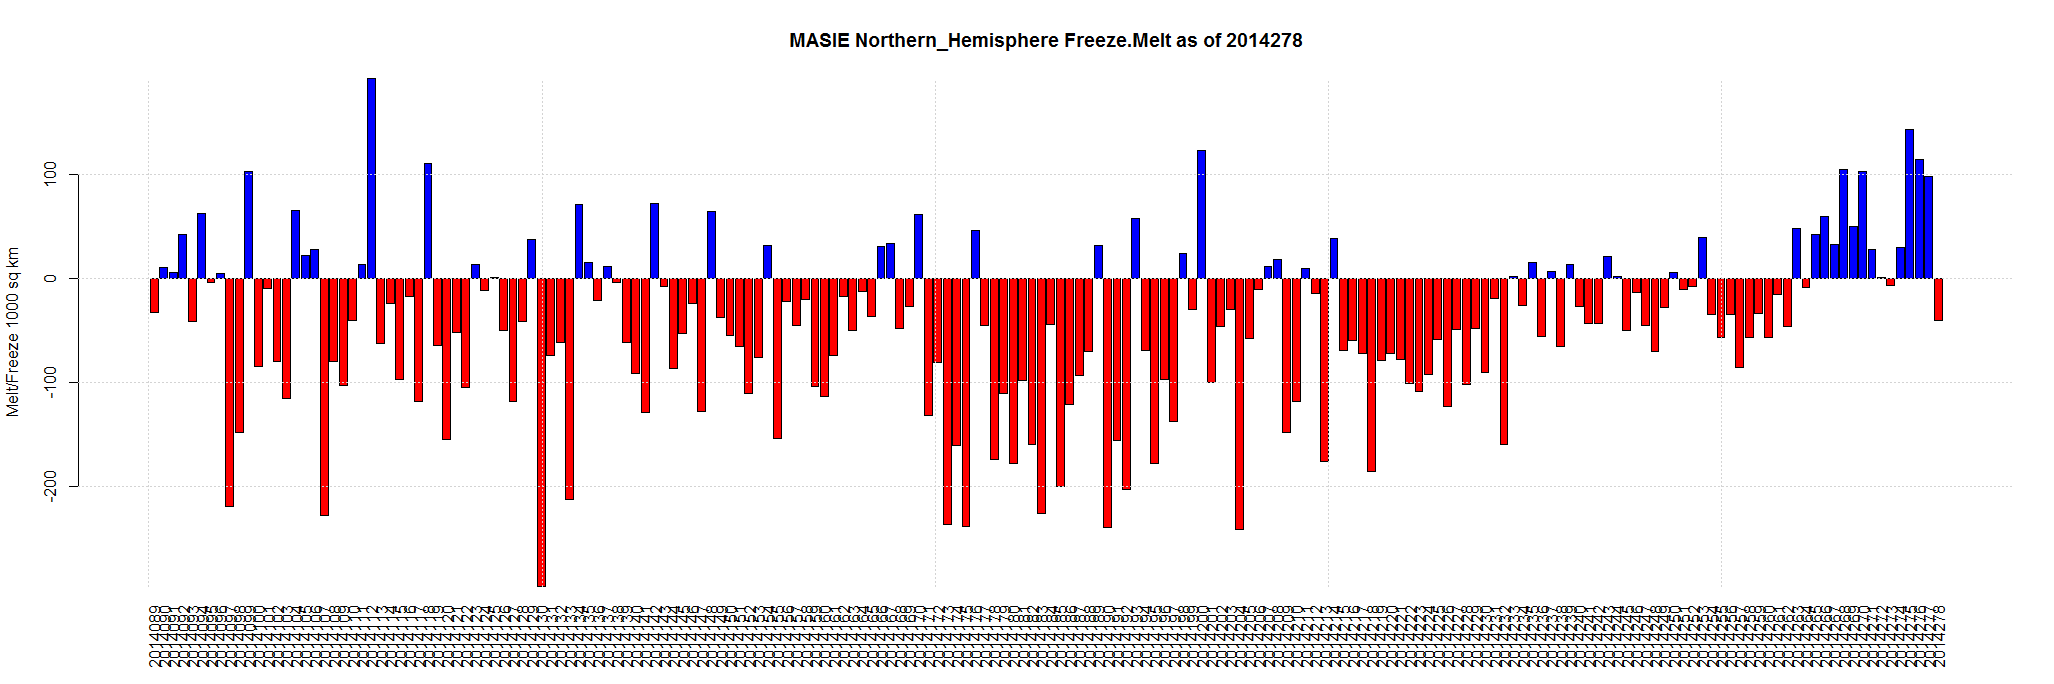
| Northern Hemisphere (Total) | 14,805,115 | 5,866,644 | -8,938,470 | 403,256 | 761,308 | 340,385 | 172,369 | -40,310 |
| NH (Average Loss per Day) | -46,798 | 14,402 | 54,379 | 48,626 | 57,456 | -40,310 |

How much faith do you have in the MASIE output, it doesn’t seem to bear much resemblance to the uptick of the Arctic Sea Ice graphs?
I think all sea ice is an educated guess. MAISE is supposedly more accurate at minimum.
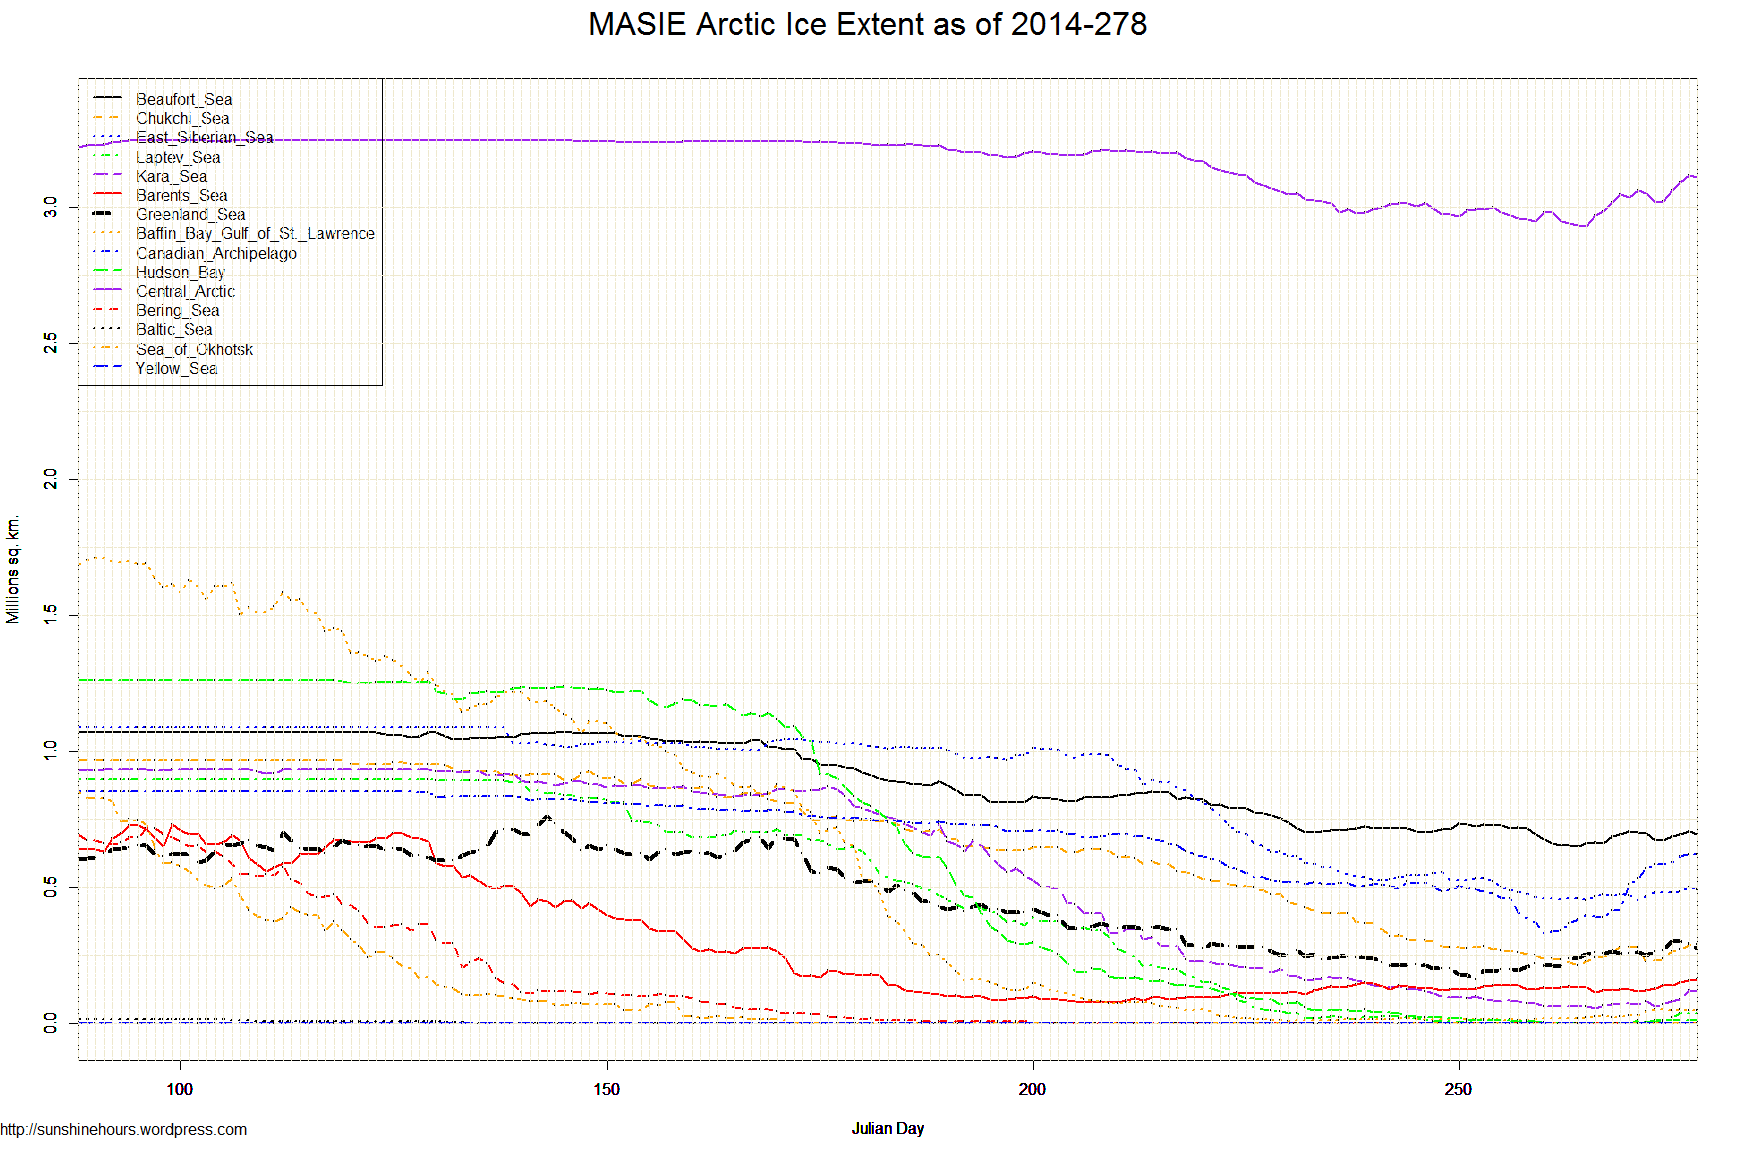
Day 278: MASIE extent grows to 5.87 M Km2 or 72% of March max.
Ice recovery is especially impressive in Canadian Archipelago, where UAH is showing the coldest temperature anomaly on earth.
That region has gone from a minimum of 0.33 M on day 260, to an extent of 0.62 M 18 days later (from 39% of max to 73% of max).
AC: What ice graphs are you referring to?
Sunshine’s own graph at https://sunshinehours.files.wordpress.com/2014/10/arctic_sea_ice_extent_zoomed_2014_day_274_1981-2010.png
There have been gains for the last 28 days according to their own data and yet all of a sudden we have melting in practically the whole arctic, with just 2 seas supposedly gaining where ther are no temps above zero.
OK, I see the issue. The graph linked by AC is from NOAA sea ice index, which is based solely on passive microwave satellite readings. MASIE uses those readings plus other data, especially satellite imagery. The discrepancies arise around the interpretation of melt water on top of ice: is it ice or open water?
It happened that day 278 involved some backing away from grid cells previously counted as icey.
MASIE day 279 shows a jump up to 6.14 M Km2. The trend is that of the ice recovering, with the usual wobbles in the record.
Correction in post #2 above: 5.87 M Km2 is 38% of March max.