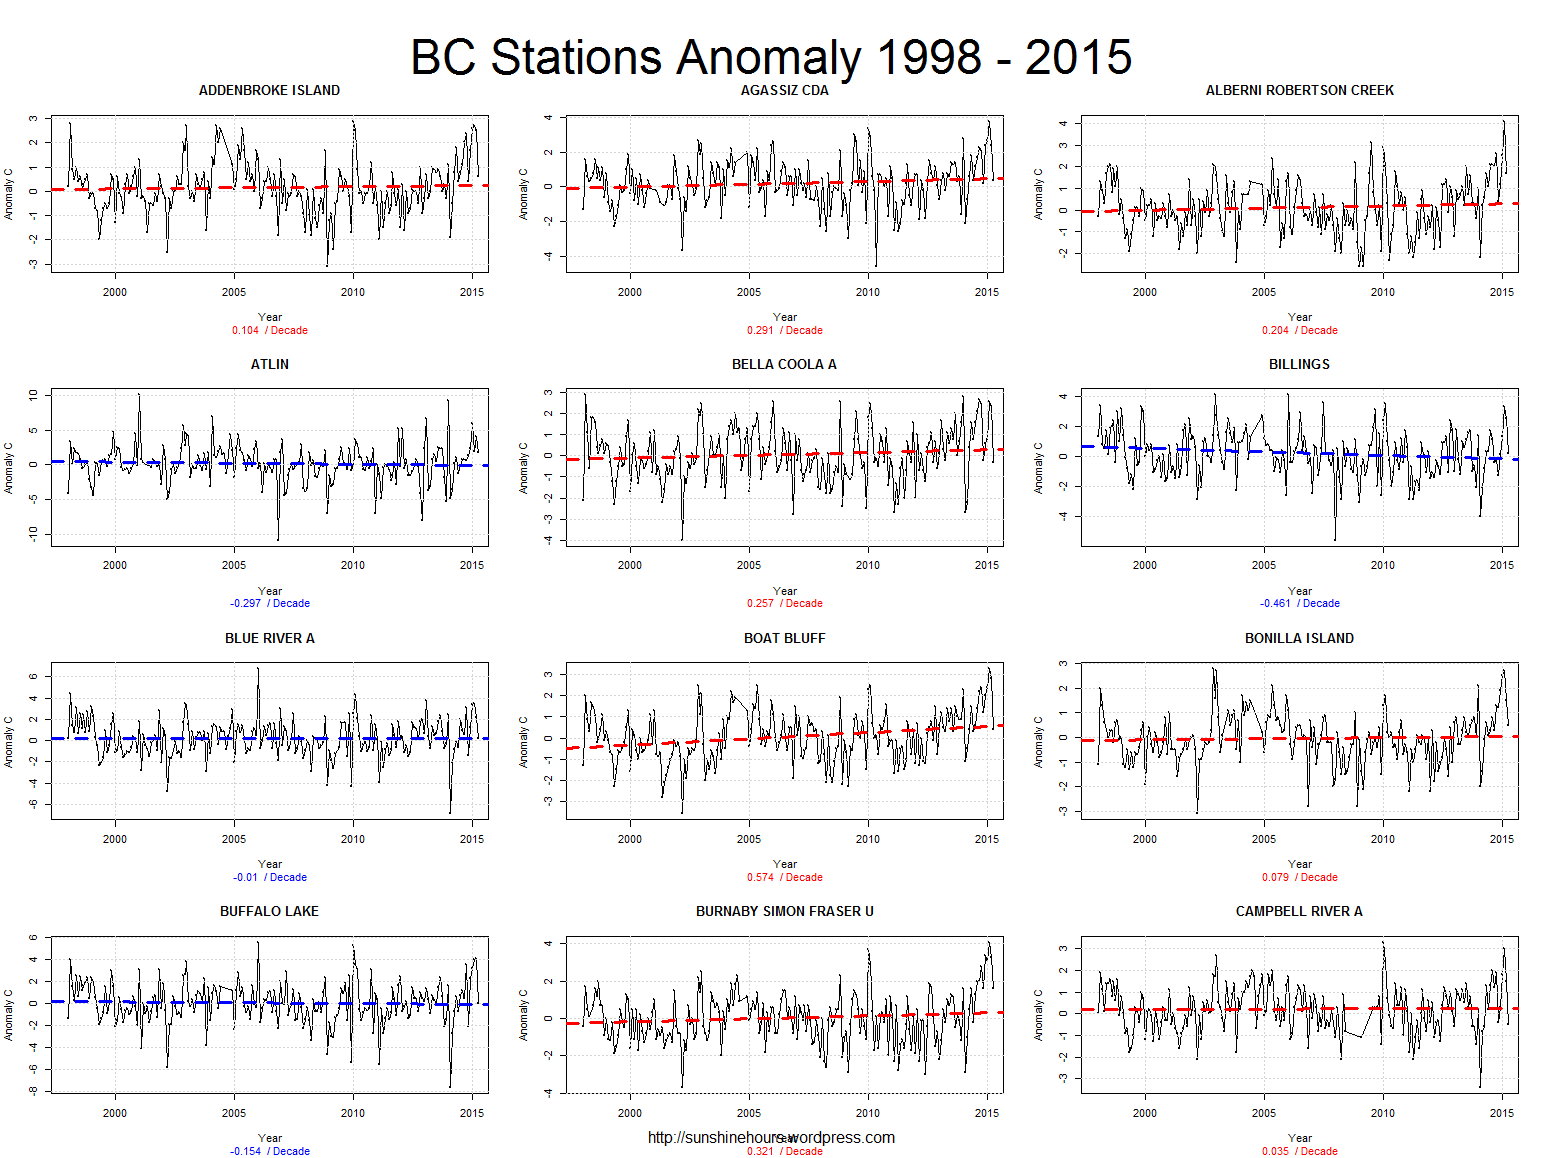
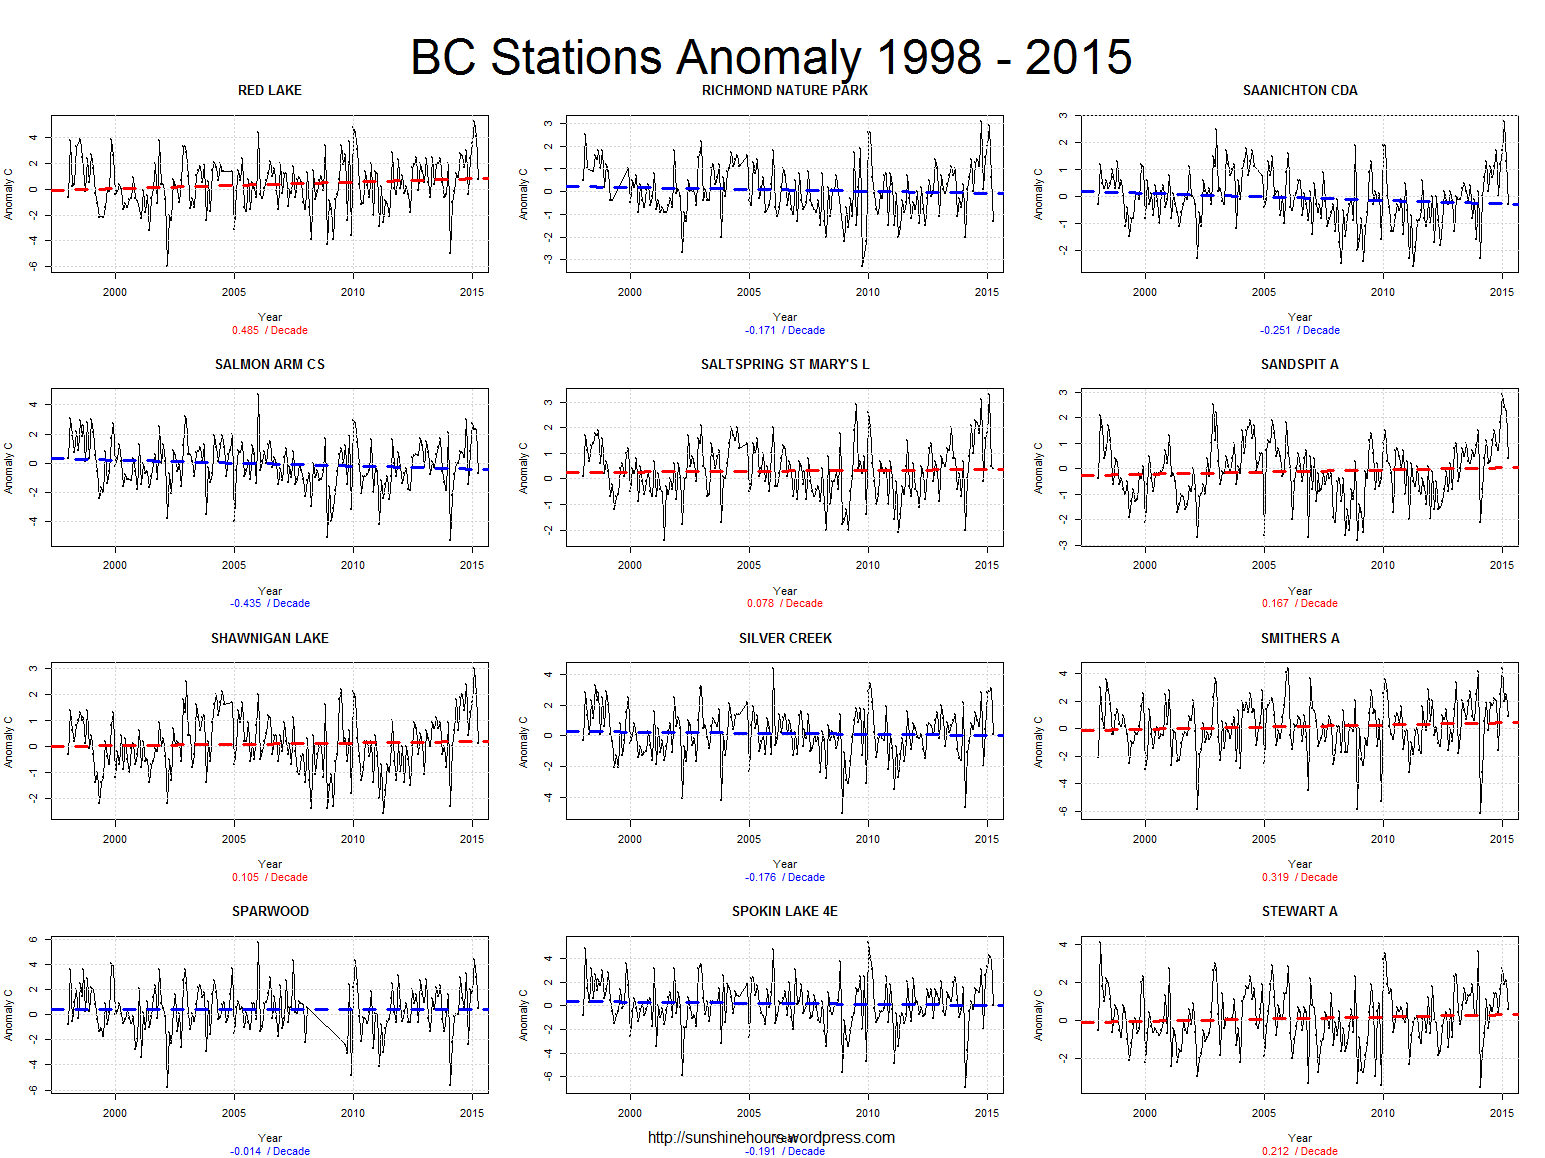
Using Environment Canada’s monthly summaries.
And selecting stations with ‘Normals’ (anomalies from 1981 – 2010) and 90% of the datapoints.


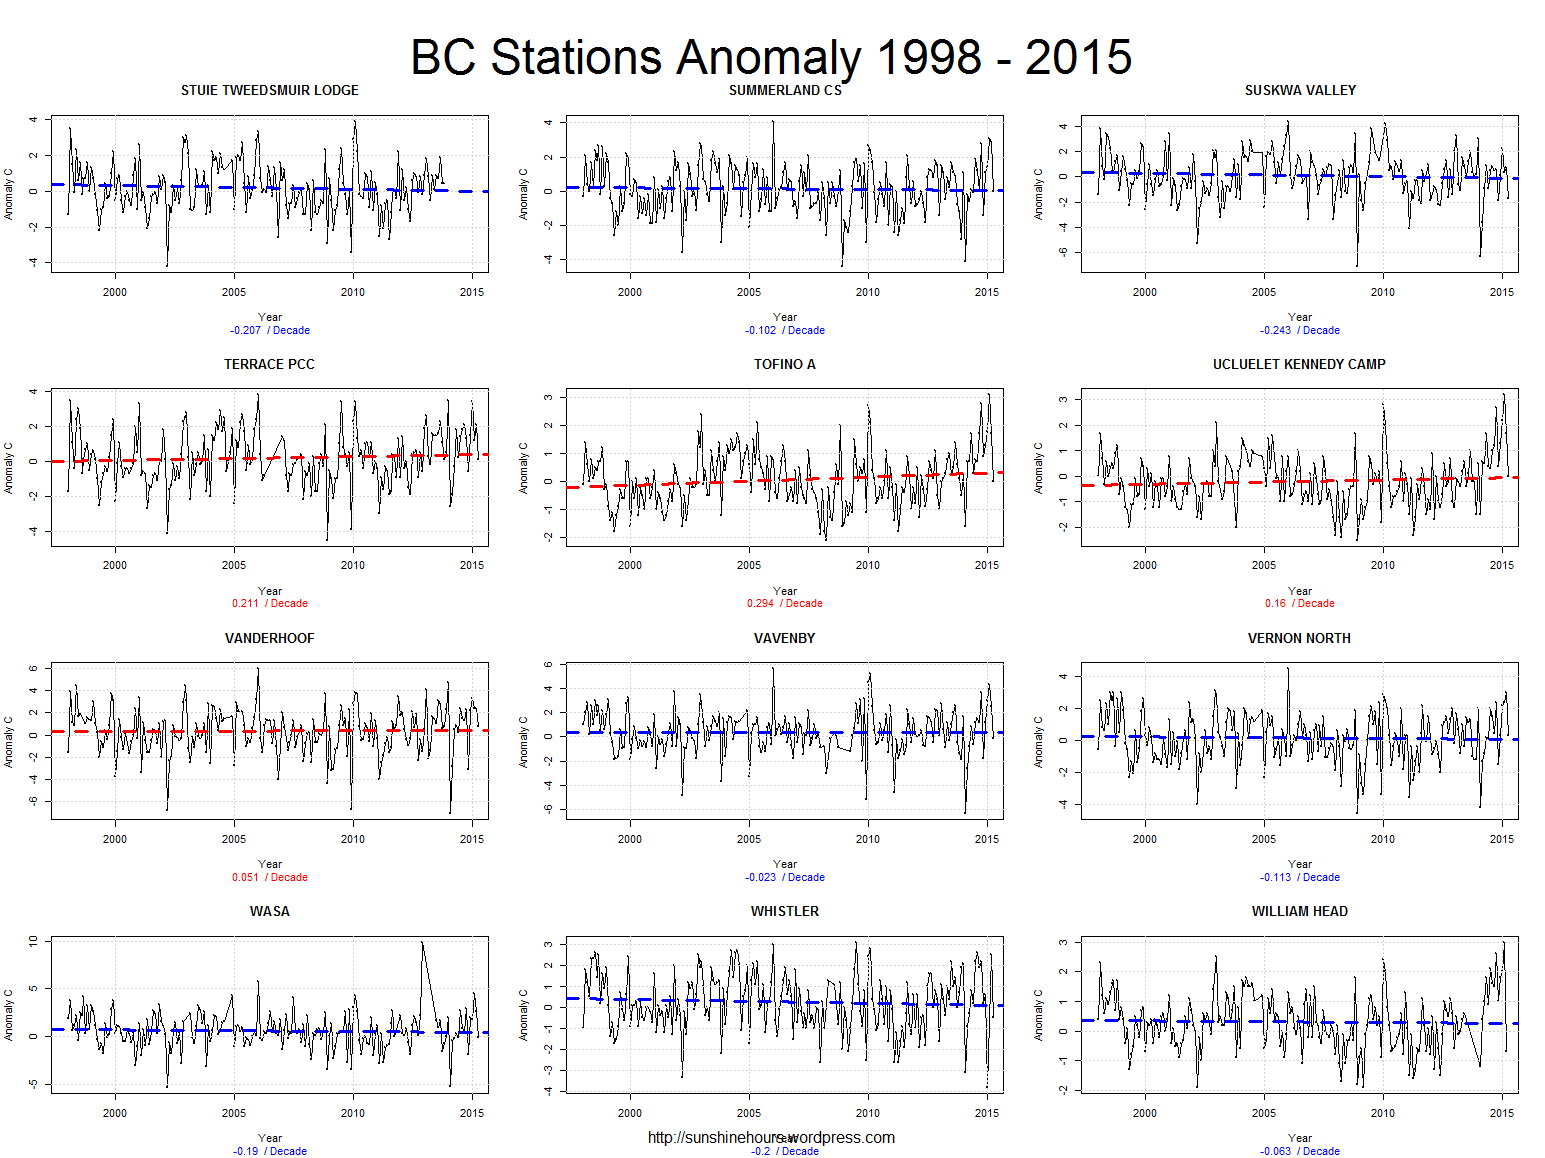
Using Environment Canada’s monthly summaries.
And selecting stations with ‘Normals’ (anomalies from 1981 – 2010) and 90% of the datapoints.

Nice. Can your provide a summary, such as the average station trend, # of stations, max trend, min trend and std deviation?
Sea ice charts today??
Thanks