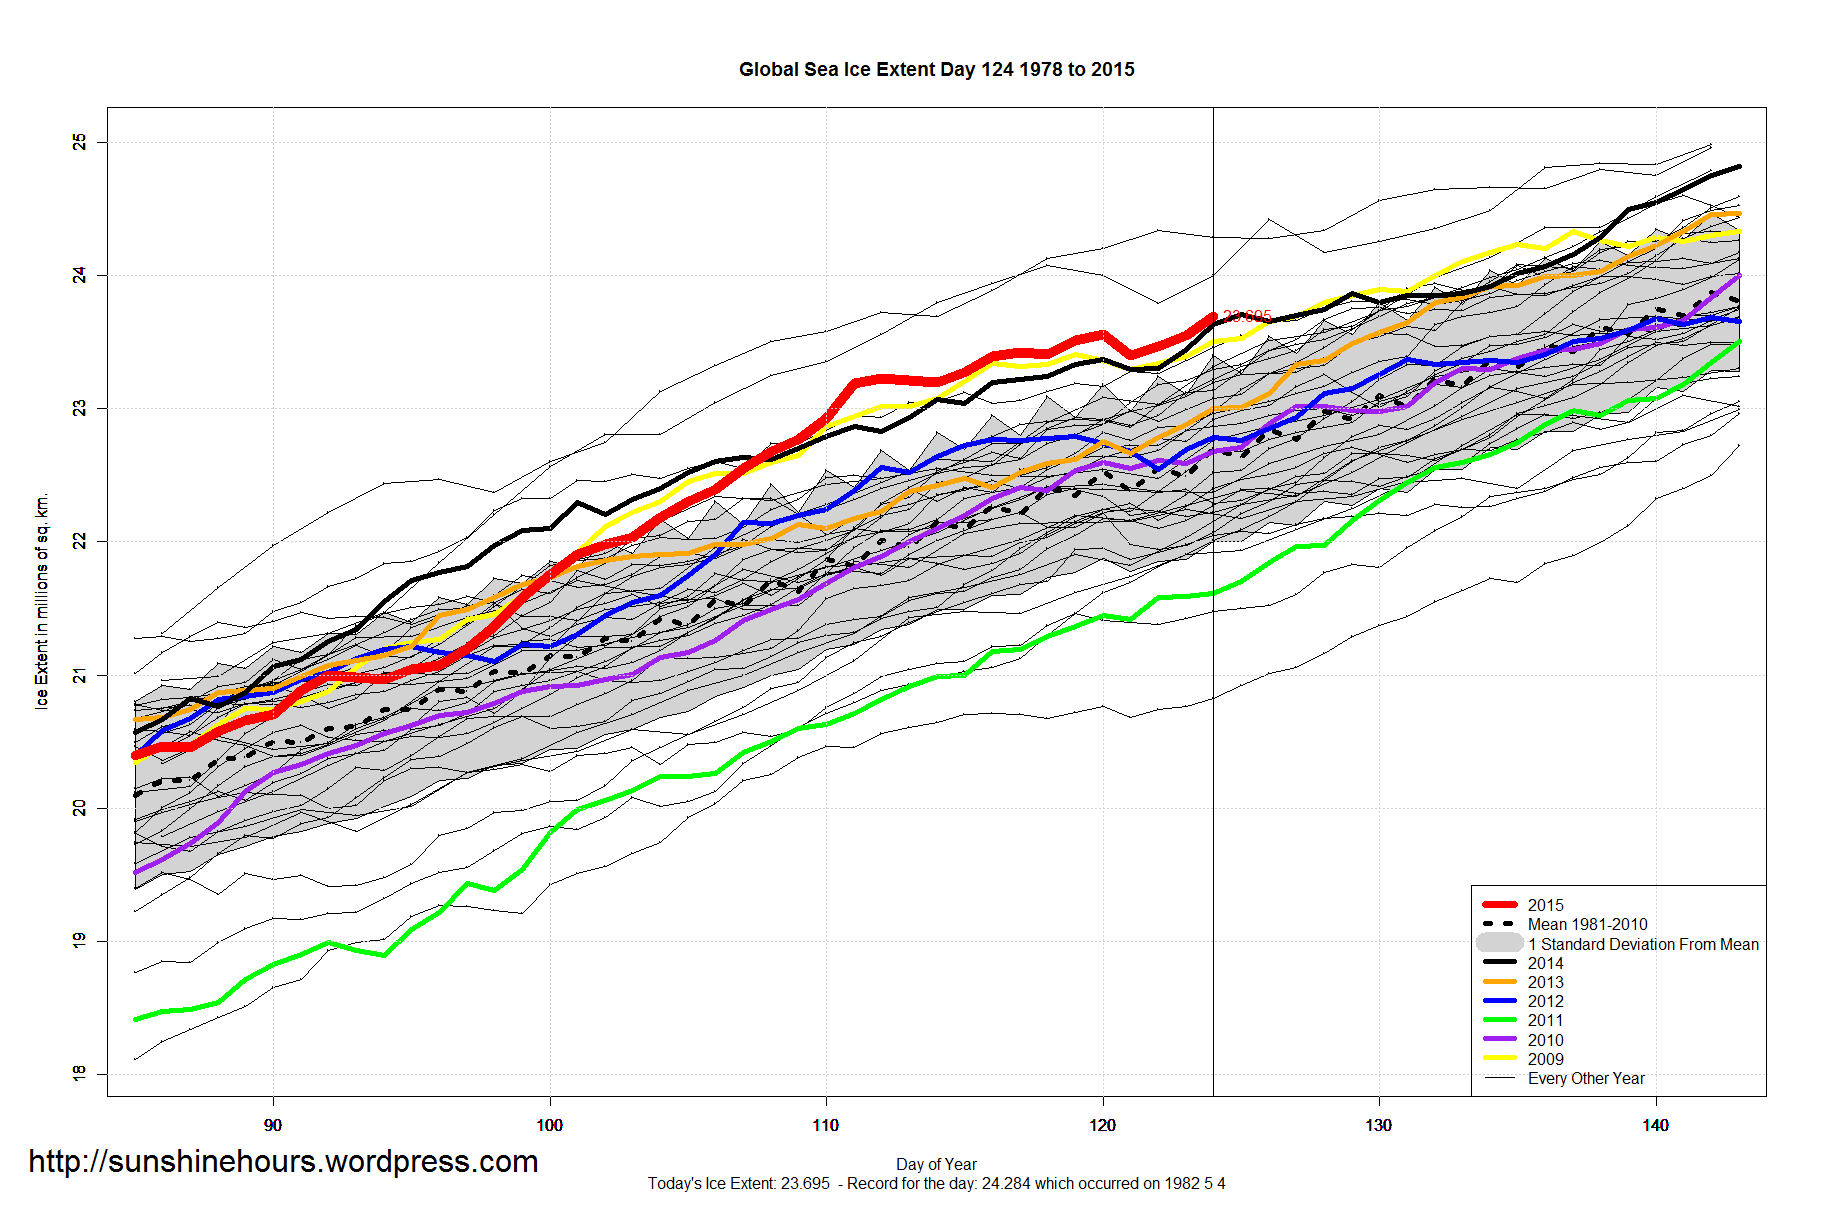
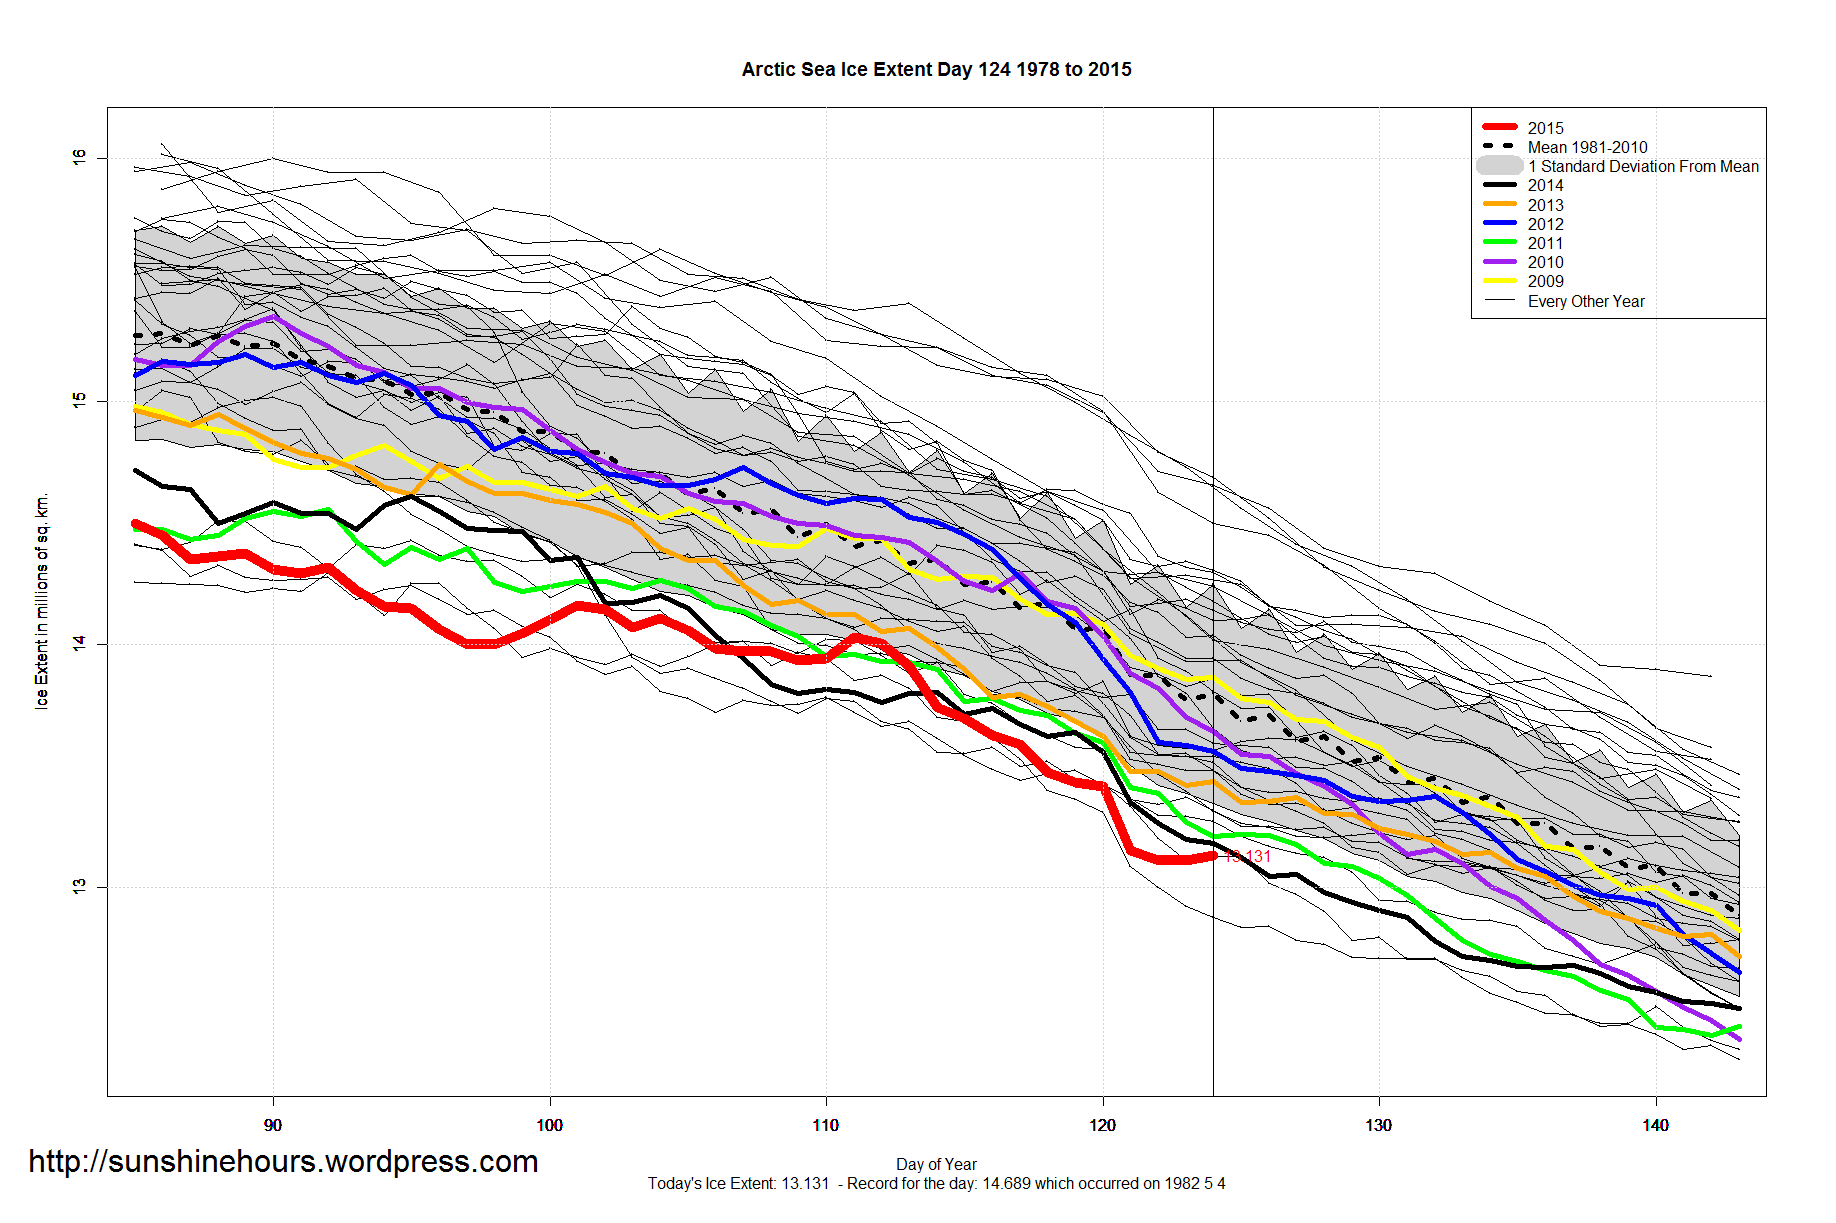
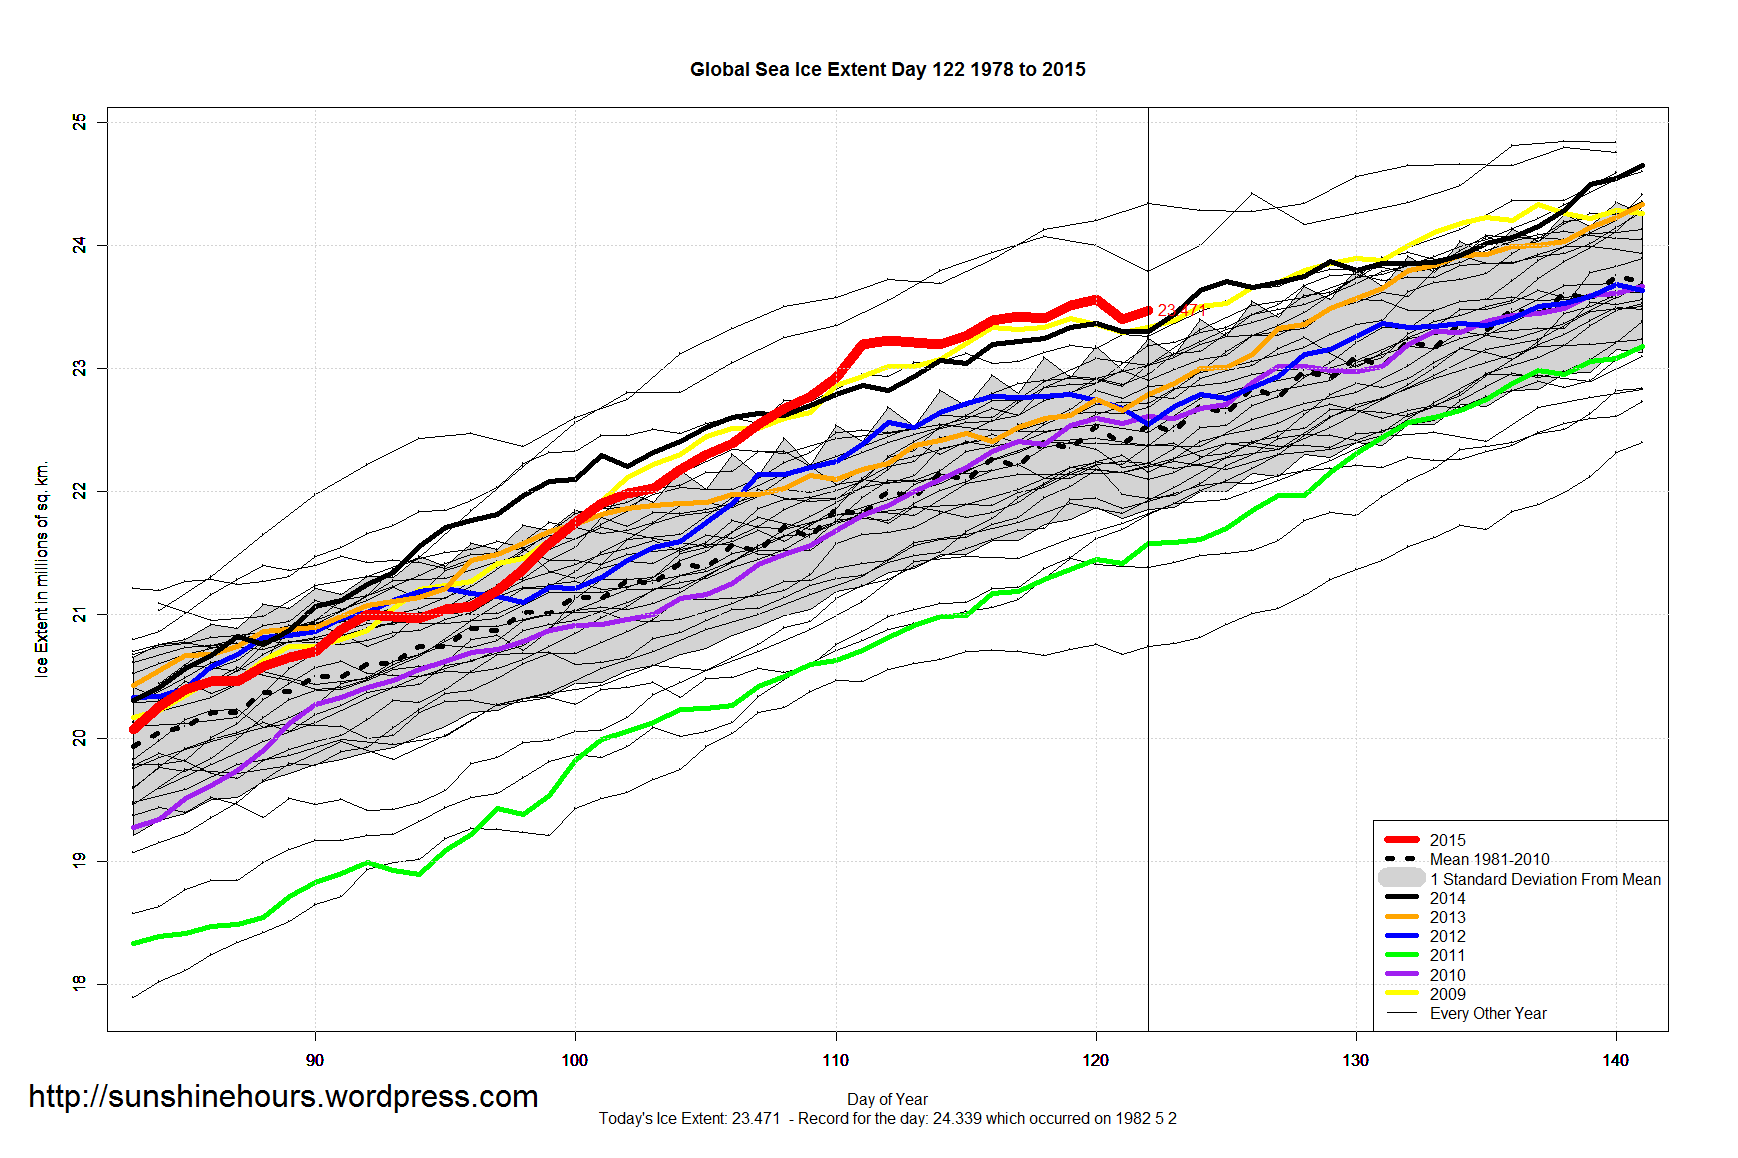
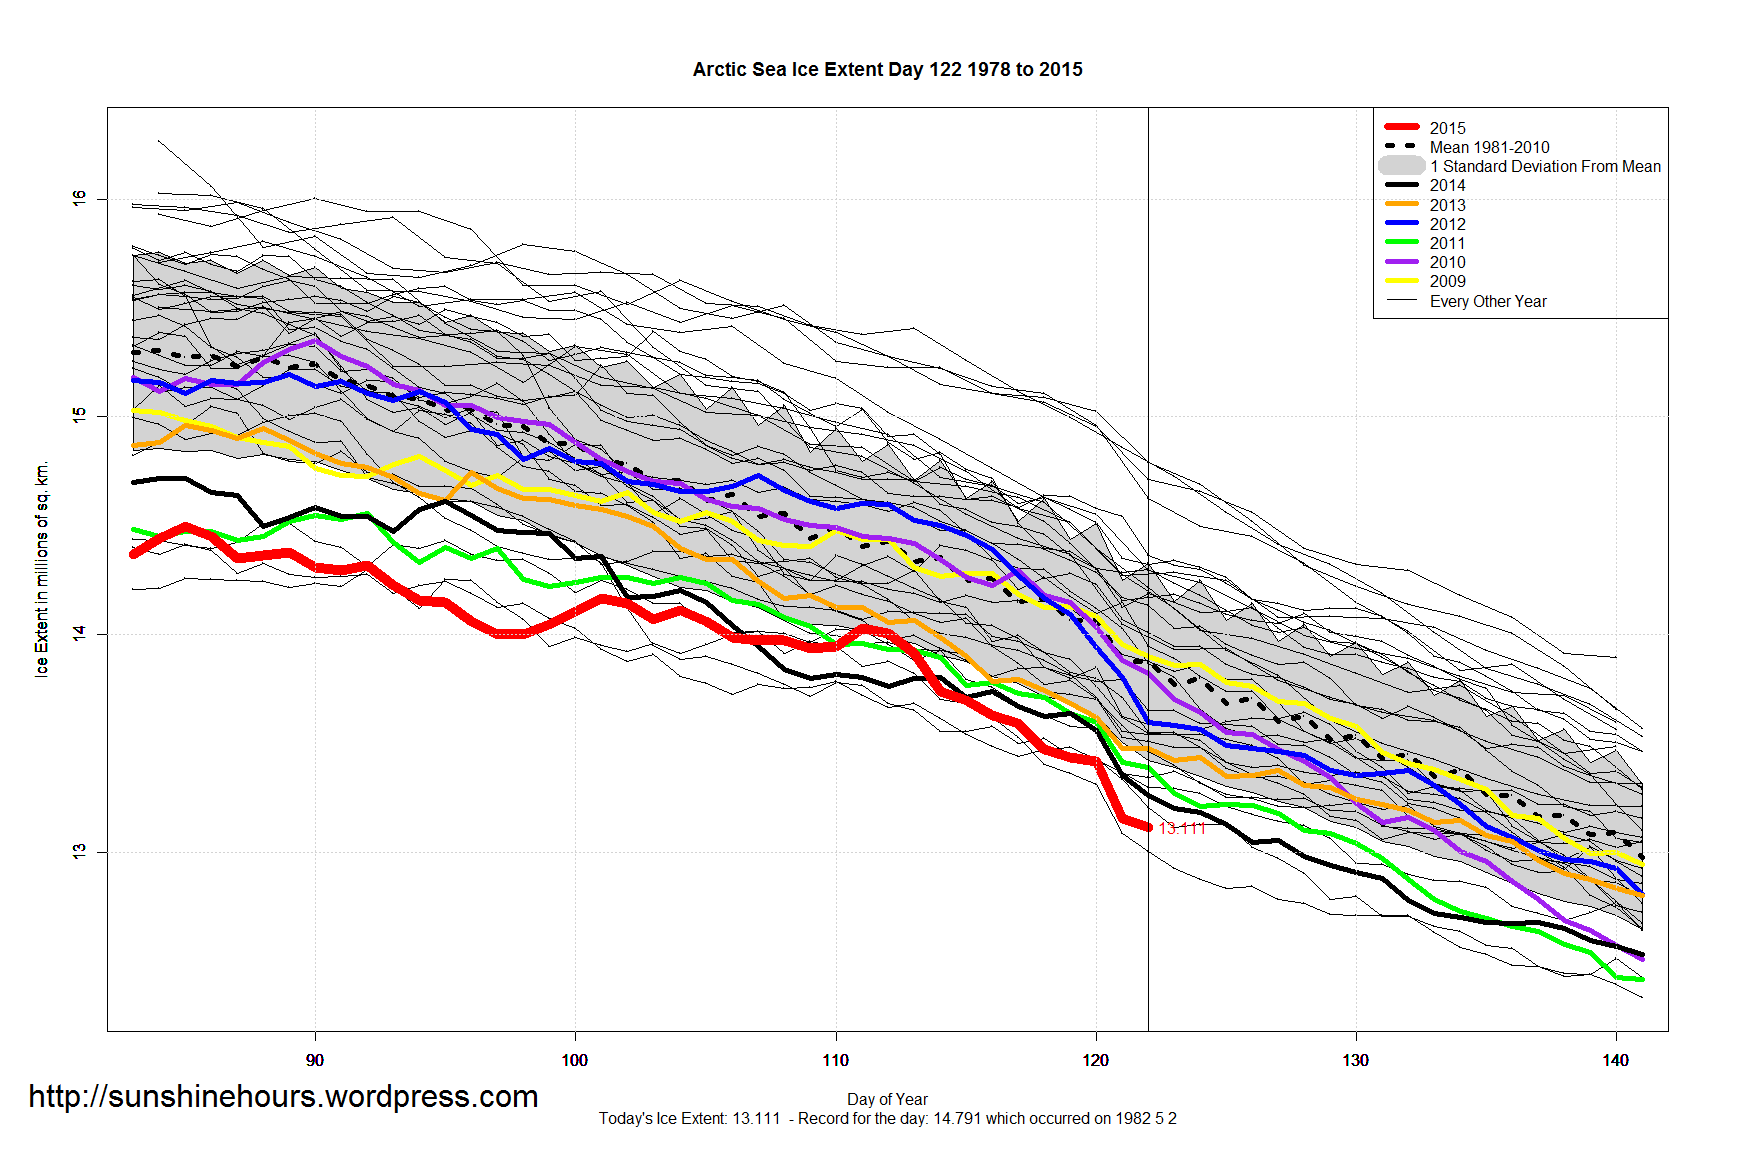
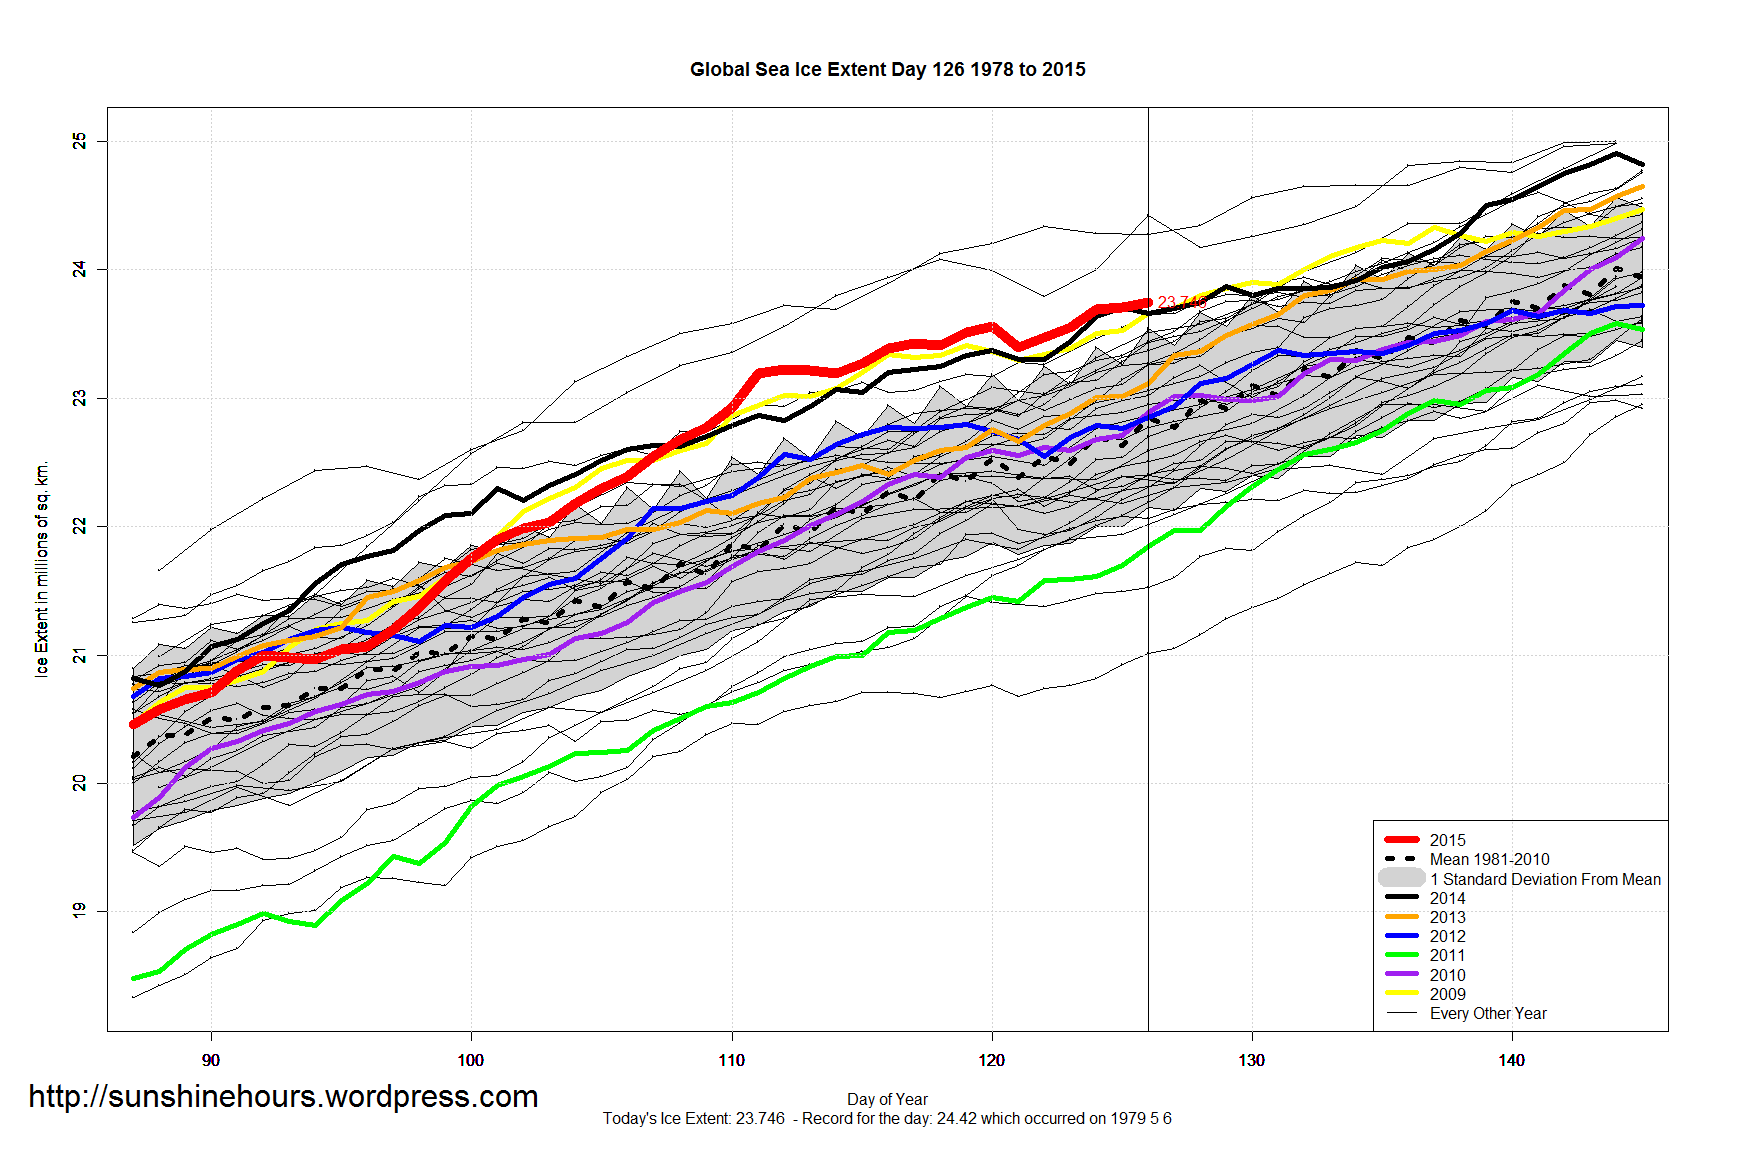
3rd Highest Global Sea Ice For This Day – Above one standard deviation.
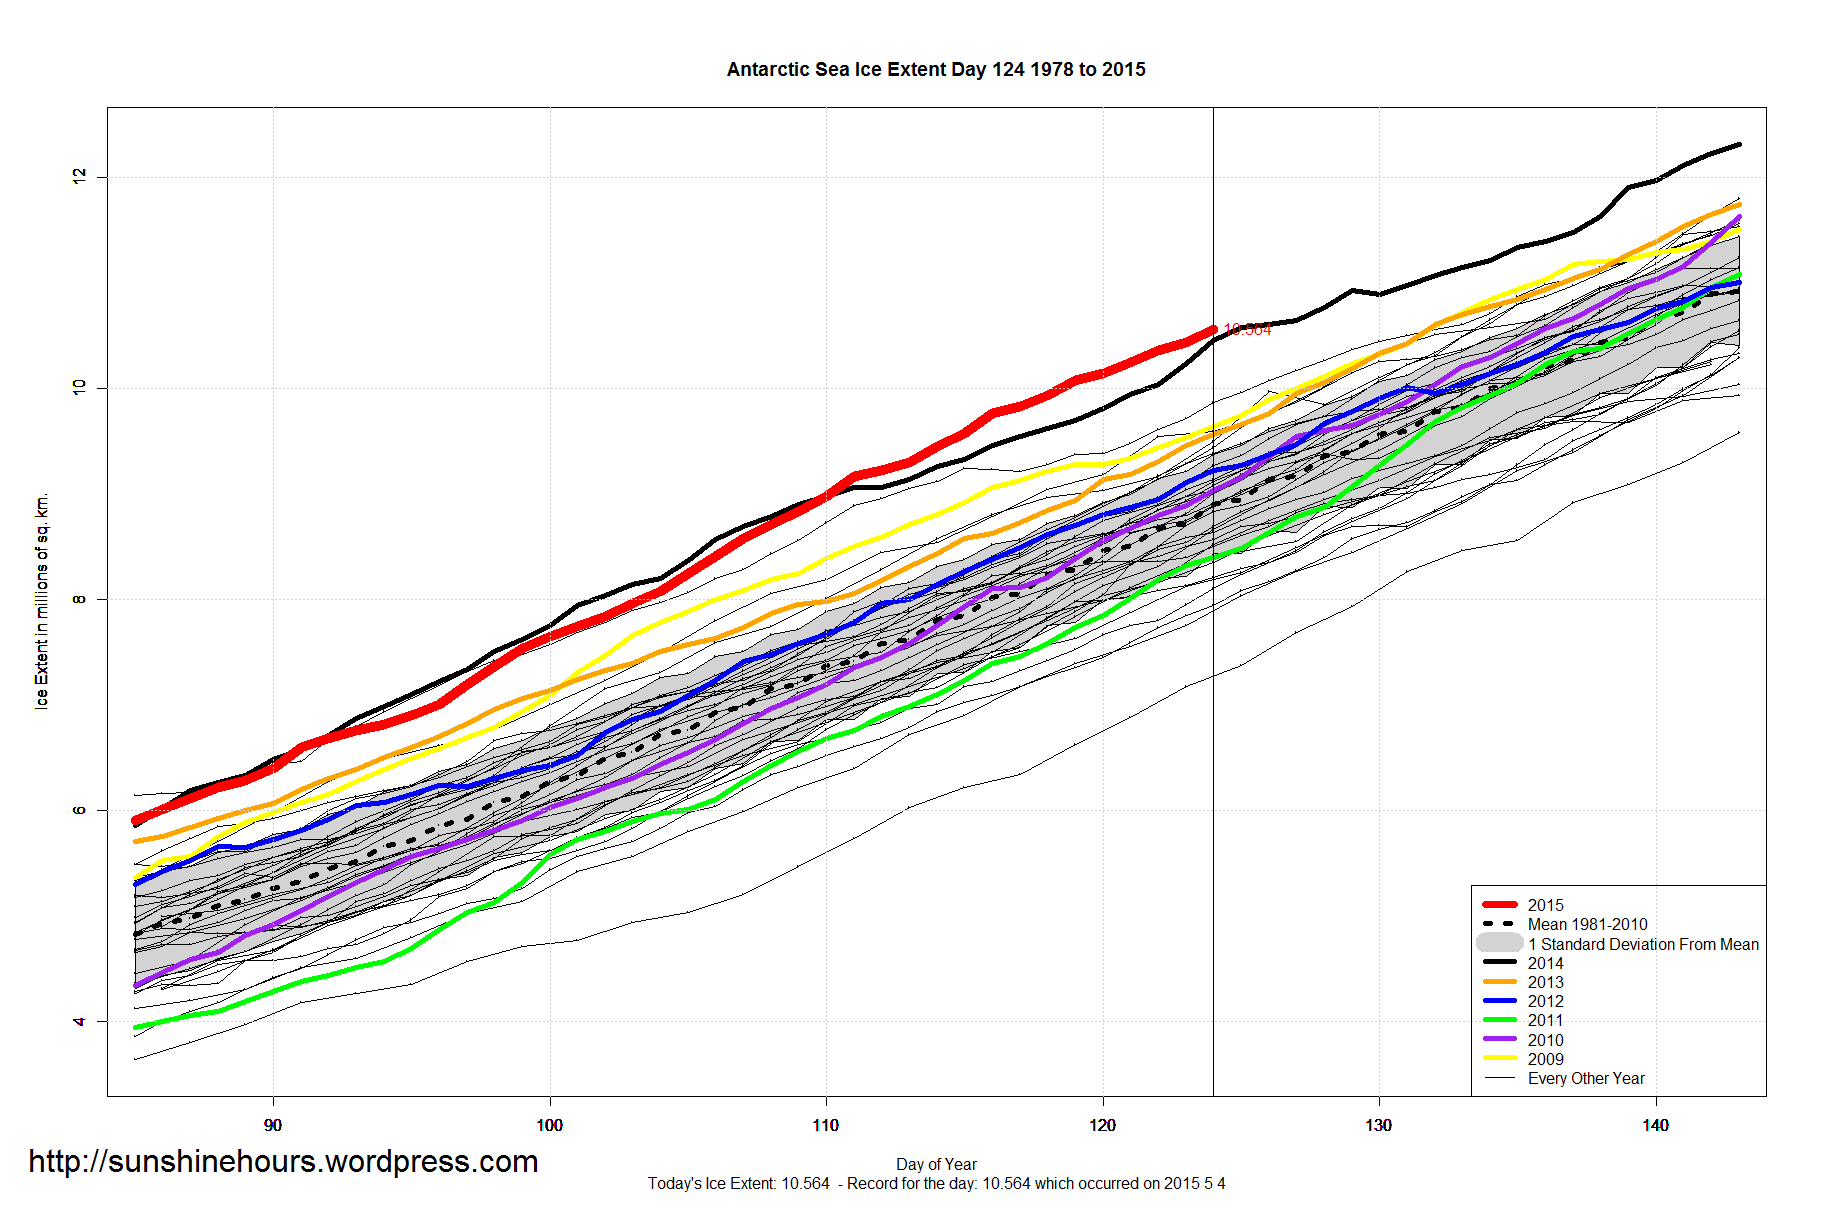
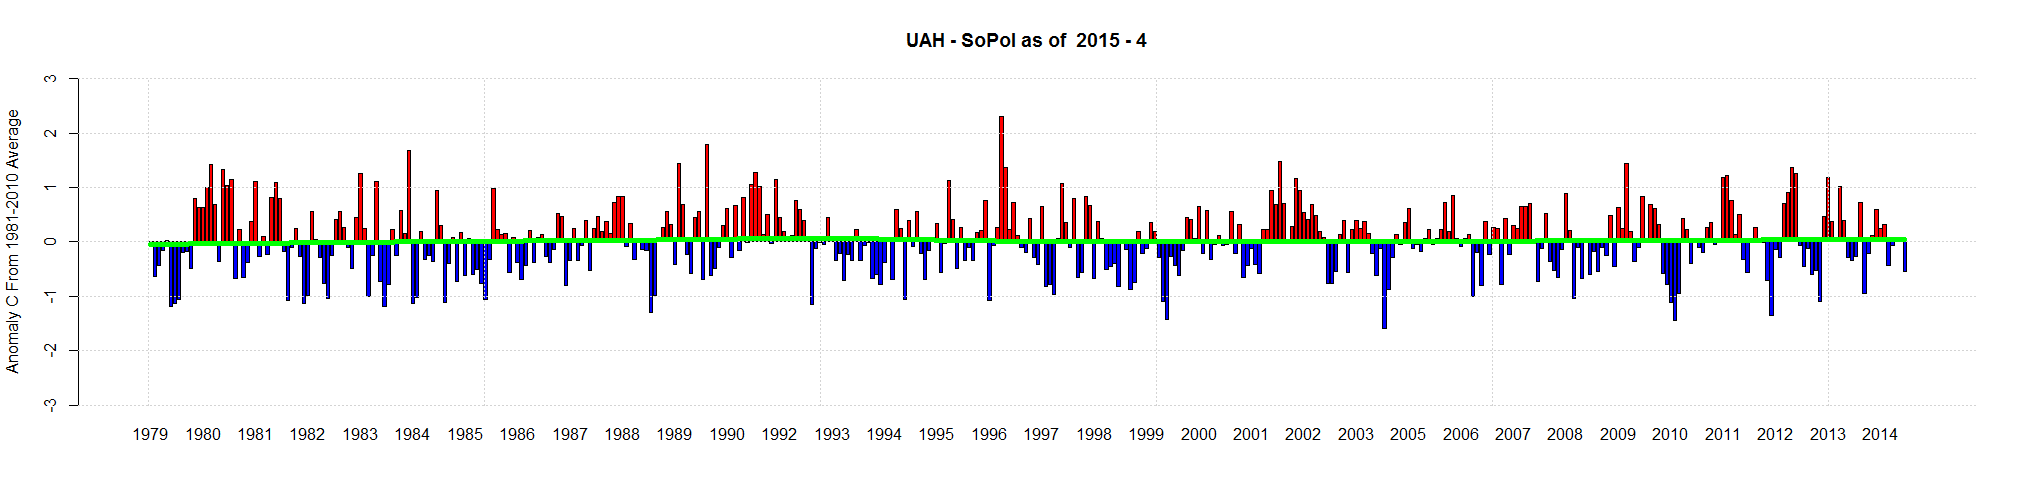
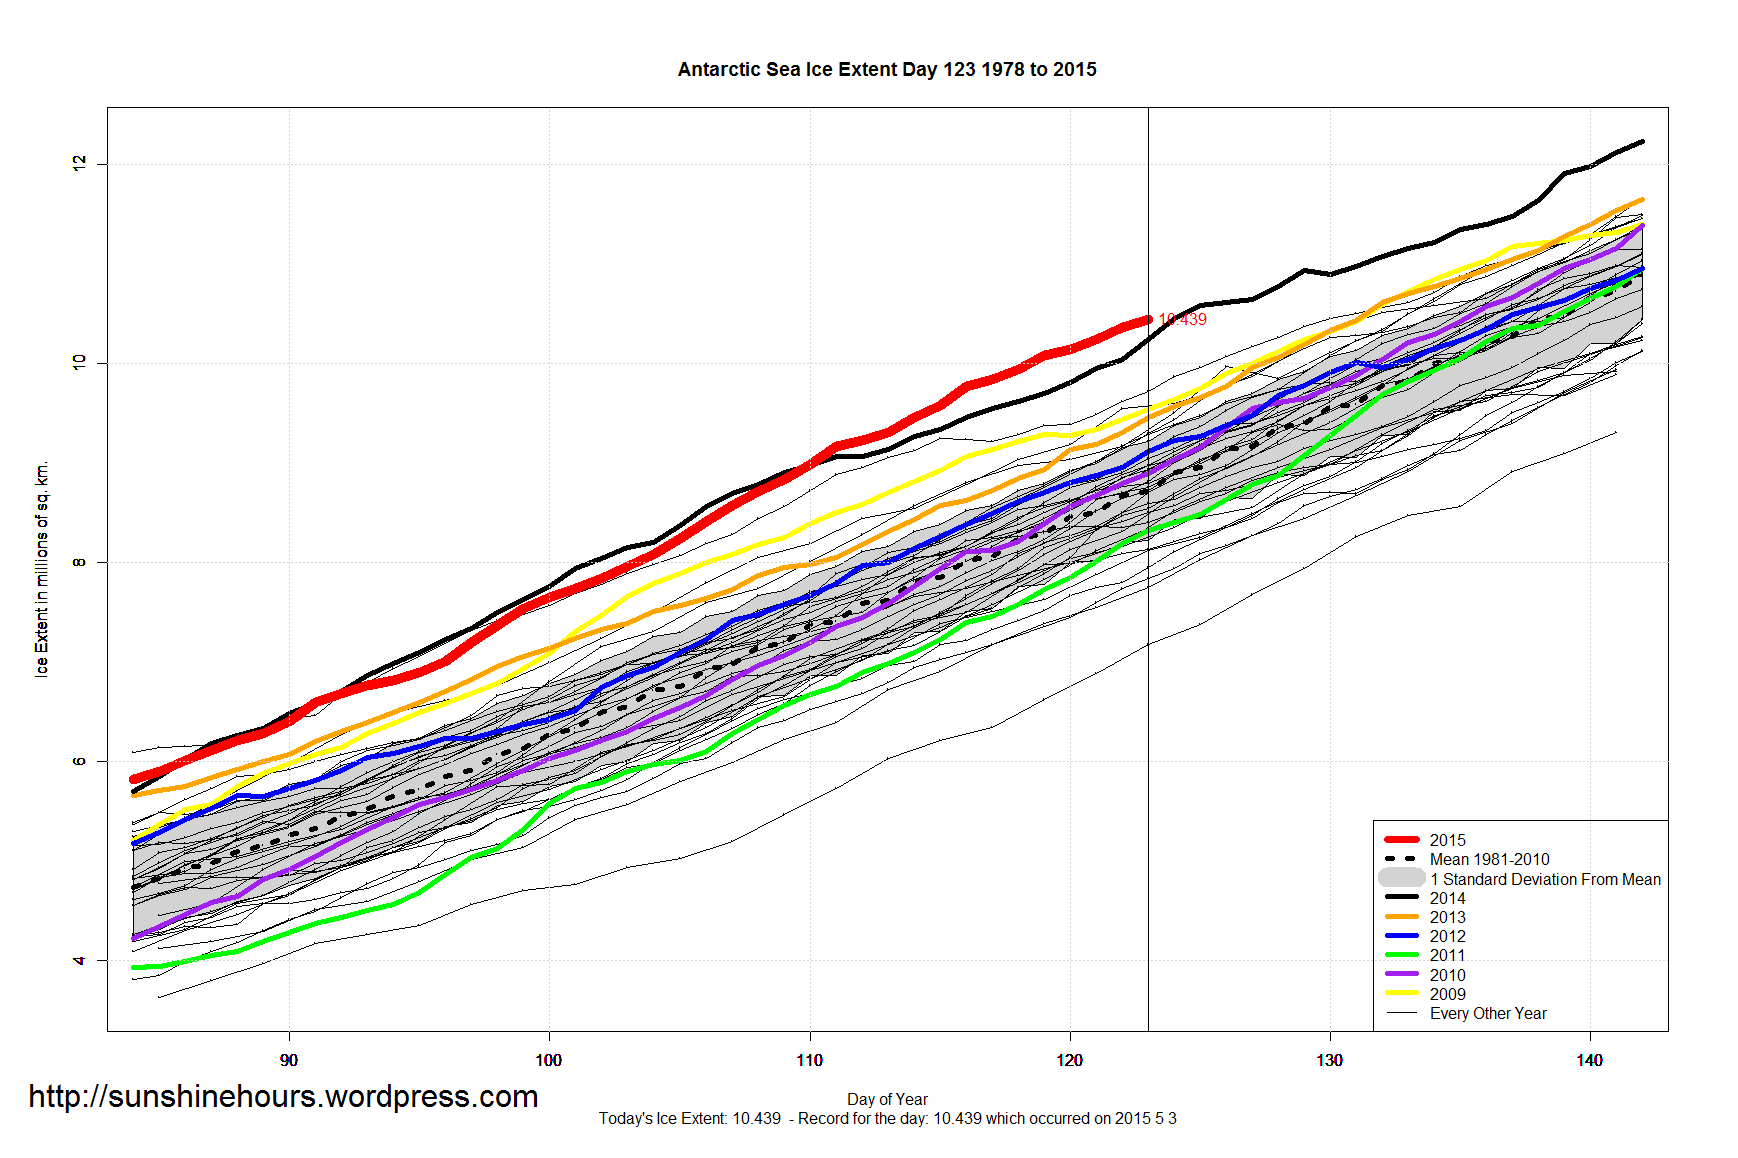
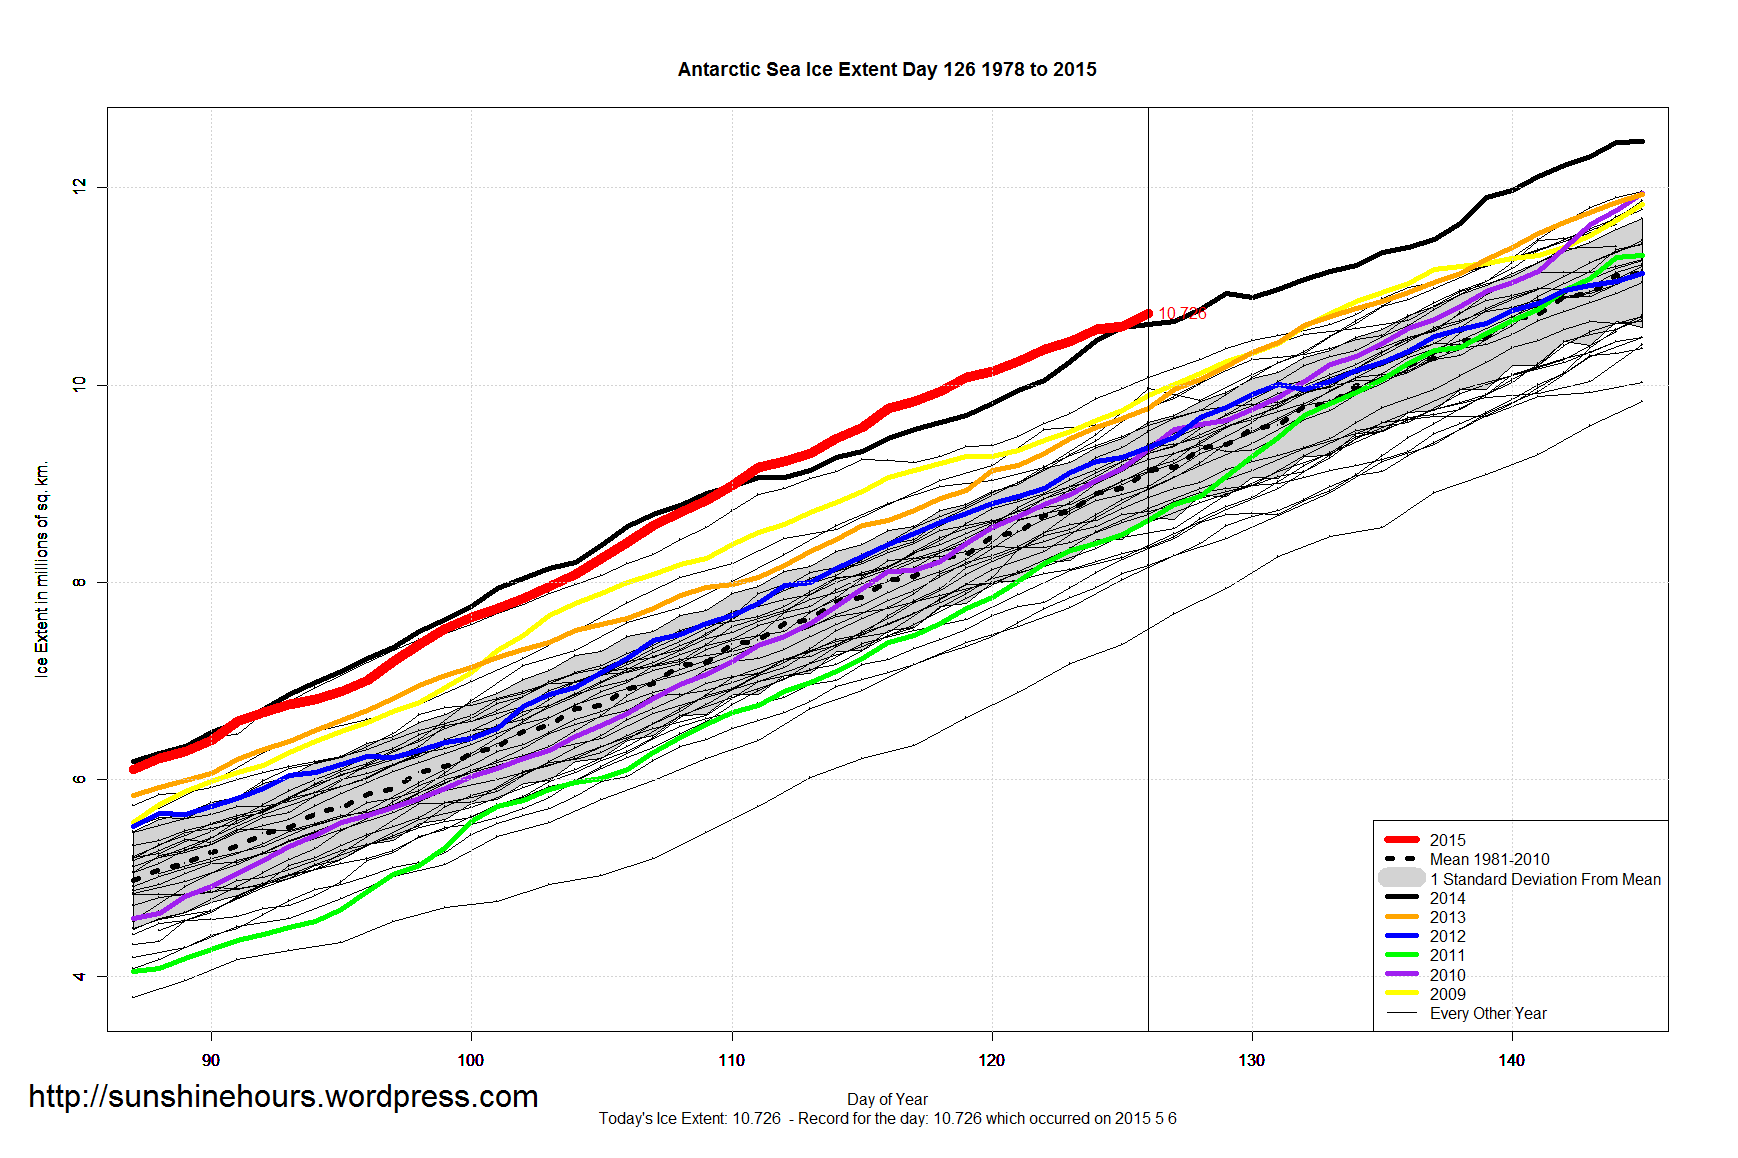
38th Daily Record for Antarctic – 1.66 million above the 1981-2010 mean. – Above 3 standard deviations.
Doom!!!! They predicted doom!!!!
San Jose Mercury News (CA) – June 30, 1989 – 3F General News
A senior environmental official at the United Nations, Noel Brown, says entire nations could be wiped off the face of the earth by rising sea levels if global warming is not reversed by the year 2000. Coastal flooding and crop failures would create an exodus of “eco-refugees,” threatening political chaos, said Brown, director of the New York office of the U.N. Environment Program. He said governments have a 10-year window of opportunity to solve the greenhouse effect before it goes beyond human…
“The province of Saskatchewan experienced extreme hardship during the Great Depression of the 1930s.
Grasshoppers, hail and drought destroyed millions of acres of wheat. The drought caused massive crop failures, and Saskatchewan became known as a dust bowl.
The term “Dirty Thirties” described the prairies, creating pessimistic perceptions and negative stereotypes about life in Saskatchewan.
In 1928, the net FARMING income was $363 million; by 1933, it dropped to $11 million; and by 1937, two-thirds of the farm population of Saskatchewan was destitute.
Relief costs for the Saskatchewan government escalated to $62 million, which was higher than its total revenues. At least 250,000 people left the prairie provinces between 1931 and 1941.”
http://esask.uregina.ca/entry/great_depression.html
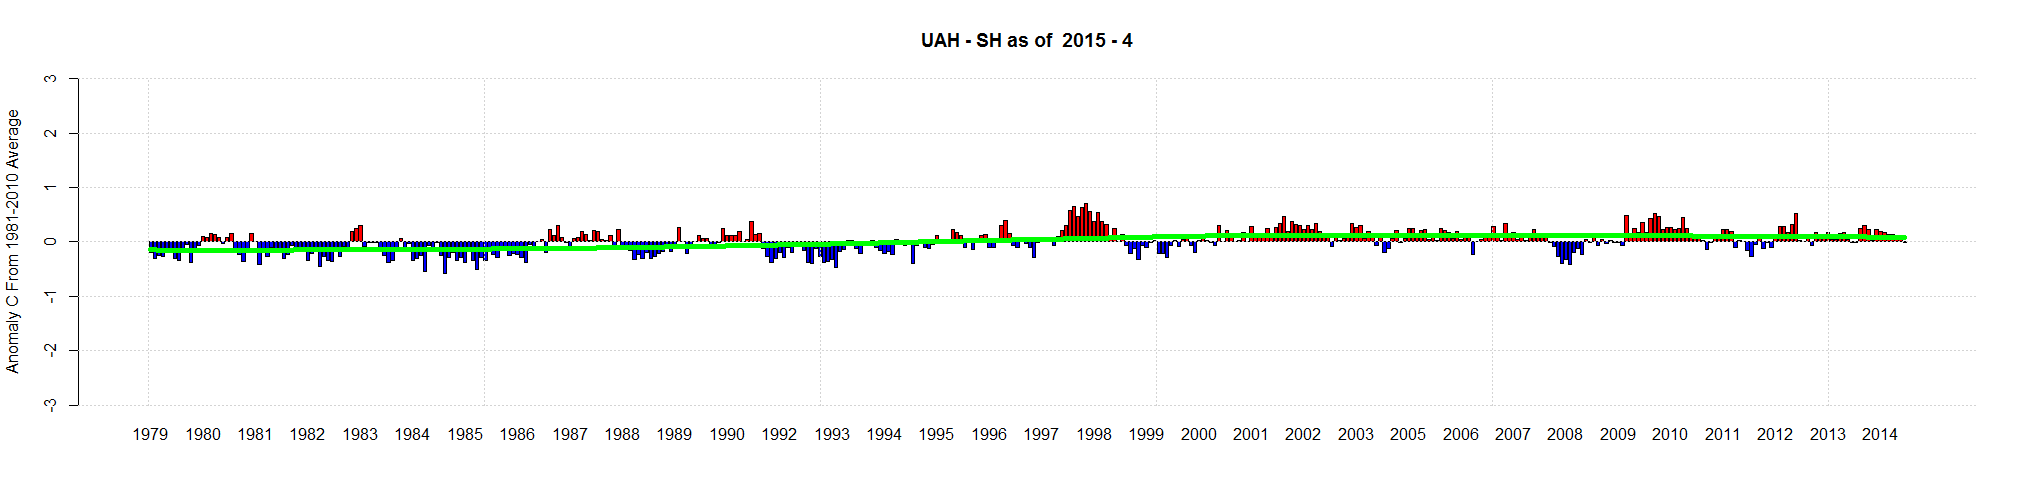
Paul Homewood discusses BBC claims that Heatwaves are more likely due to climate change. And because 2014 was the “hottest” year.
So I decided to look at the HADCET MAXTEMP data.
Not the average. The maximum.
I then arbitrarily set the heatwave boundary at 25C.
And then calculated the number of days over 25 and the longest stretch (ie Heatwave).
Guess what? 2014 barely ranks. Only 8 days above 25. 1911 had 29! (See large table at bottom for 25C heatwaves)
What if I set the Heatwave definition at 30C? There are only 8 years that have days over 30C.
1976 is the winner. And 1976 was 39 years ago! (Corrected from 30)
The 30C days and temps.
“1976-07-01” “1976-07-02” “1976-07-03” “1976-07-04” “1976-07-05” “1976-07-06” “1976-07-07”
“30.6” “31.8” “33.2” “31.4” “31.4” “31.6” “30.4”
30C Heatwaves
| Year | Days | Longest Heatwave |
| 1976 | 9 | 7 |
| 1995 | 5 | 4 |
| 1975 | 4 | 2 |
| 1906 | 3 | 3 |
| 1948 | 3 | 3 |
| 2006 | 3 | 2 |
| 1923 | 2 | 2 |
| 1990 | 2 | 2 |
25C Heatwave.
| Year | Days | Longest Heatwave |
| 1976 | 33 | 16 |
| 1995 | 33 | 10 |
| 1911 | 29 | 4 |
| 2006 | 26 | 7 |
| 1947 | 25 | 10 |
| 2003 | 23 | 10 |
| 1949 | 22 | 6 |
| 1933 | 21 | 6 |
| 1893 | 19 | 6 |
| 1921 | 19 | 6 |
| 1955 | 19 | 5 |
| 1975 | 19 | 8 |
| 1983 | 18 | 7 |
| 1989 | 18 | 7 |
| 1899 | 17 | 4 |
| 1887 | 16 | 3 |
| 1959 | 16 | 3 |
| 1990 | 16 | 4 |
| 1997 | 16 | 7 |
| 2013 | 16 | 8 |
| 2005 | 15 | 5 |
| 1884 | 14 | 5 |
| 1900 | 14 | 3 |
| 1935 | 14 | 4 |
| 1999 | 14 | 5 |
| 2001 | 13 | 5 |
| 1941 | 12 | 3 |
| 1878 | 11 | 6 |
| 1897 | 11 | 4 |
| 1898 | 11 | 5 |
| 1934 | 11 | 8 |
| 1970 | 11 | 5 |
| 1984 | 10 | 5 |
| 1901 | 9 | 5 |
| 1925 | 9 | 3 |
| 1942 | 9 | 4 |
| 1982 | 9 | 2 |
| 1991 | 9 | 3 |
| 1994 | 9 | 3 |
| 1996 | 9 | 5 |
| 2004 | 9 | 2 |
| 1906 | 8 | 5 |
| 1929 | 8 | 3 |
| 1957 | 8 | 4 |
| 1960 | 8 | 3 |
| 1969 | 8 | 3 |
| 1986 | 8 | 4 |
| 2014 | 8 | 5 |
| 1896 | 7 | 2 |
| 1919 | 7 | 2 |
| 1923 | 7 | 3 |
| 1944 | 7 | 3 |
| 1952 | 7 | 2 |
| 1973 | 7 | 4 |
| 1886 | 6 | 3 |
| 1895 | 6 | 2 |
| 1908 | 6 | 3 |
| 1914 | 6 | 2 |
| 1926 | 6 | 4 |
| 1937 | 6 | 2 |
| 1940 | 6 | 4 |
| 1945 | 6 | 3 |
| 1946 | 6 | 5 |
| 1961 | 6 | 2 |
| 2010 | 6 | 2 |
| 2011 | 6 | 3 |
| 1881 | 5 | 2 |
| 1885 | 5 | 4 |
| 1918 | 5 | 3 |
| 1930 | 5 | 4 |
| 1948 | 5 | 5 |
| 1953 | 5 | 2 |
| 1977 | 5 | 5 |
| 1987 | 5 | 2 |
| 1992 | 5 | 2 |
| 1998 | 5 | 4 |
| 2000 | 5 | 3 |
| 2009 | 5 | 4 |
| 1891 | 4 | 4 |
| 1902 | 4 | 2 |
| 1904 | 4 | 2 |
| 1912 | 4 | 3 |
| 1922 | 4 | 2 |
| 1928 | 4 | 2 |
| 1932 | 4 | 2 |
| 1936 | 4 | 3 |
| 1939 | 4 | 4 |
| 1943 | 4 | 2 |
| 1950 | 4 | 4 |
| 1963 | 4 | 2 |
| 1968 | 4 | 2 |
| 2008 | 4 | 2 |
| 1894 | 3 | 2 |
| 1905 | 3 | 2 |
| 1917 | 3 | 2 |
| 1978 | 3 | 2 |
| 1980 | 3 | 2 |
| 1988 | 3 | 2 |
| 2002 | 3 | 2 |
| 1880 | 2 | 2 |
| 1924 | 2 | 2 |
| 1972 | 2 | 2 |
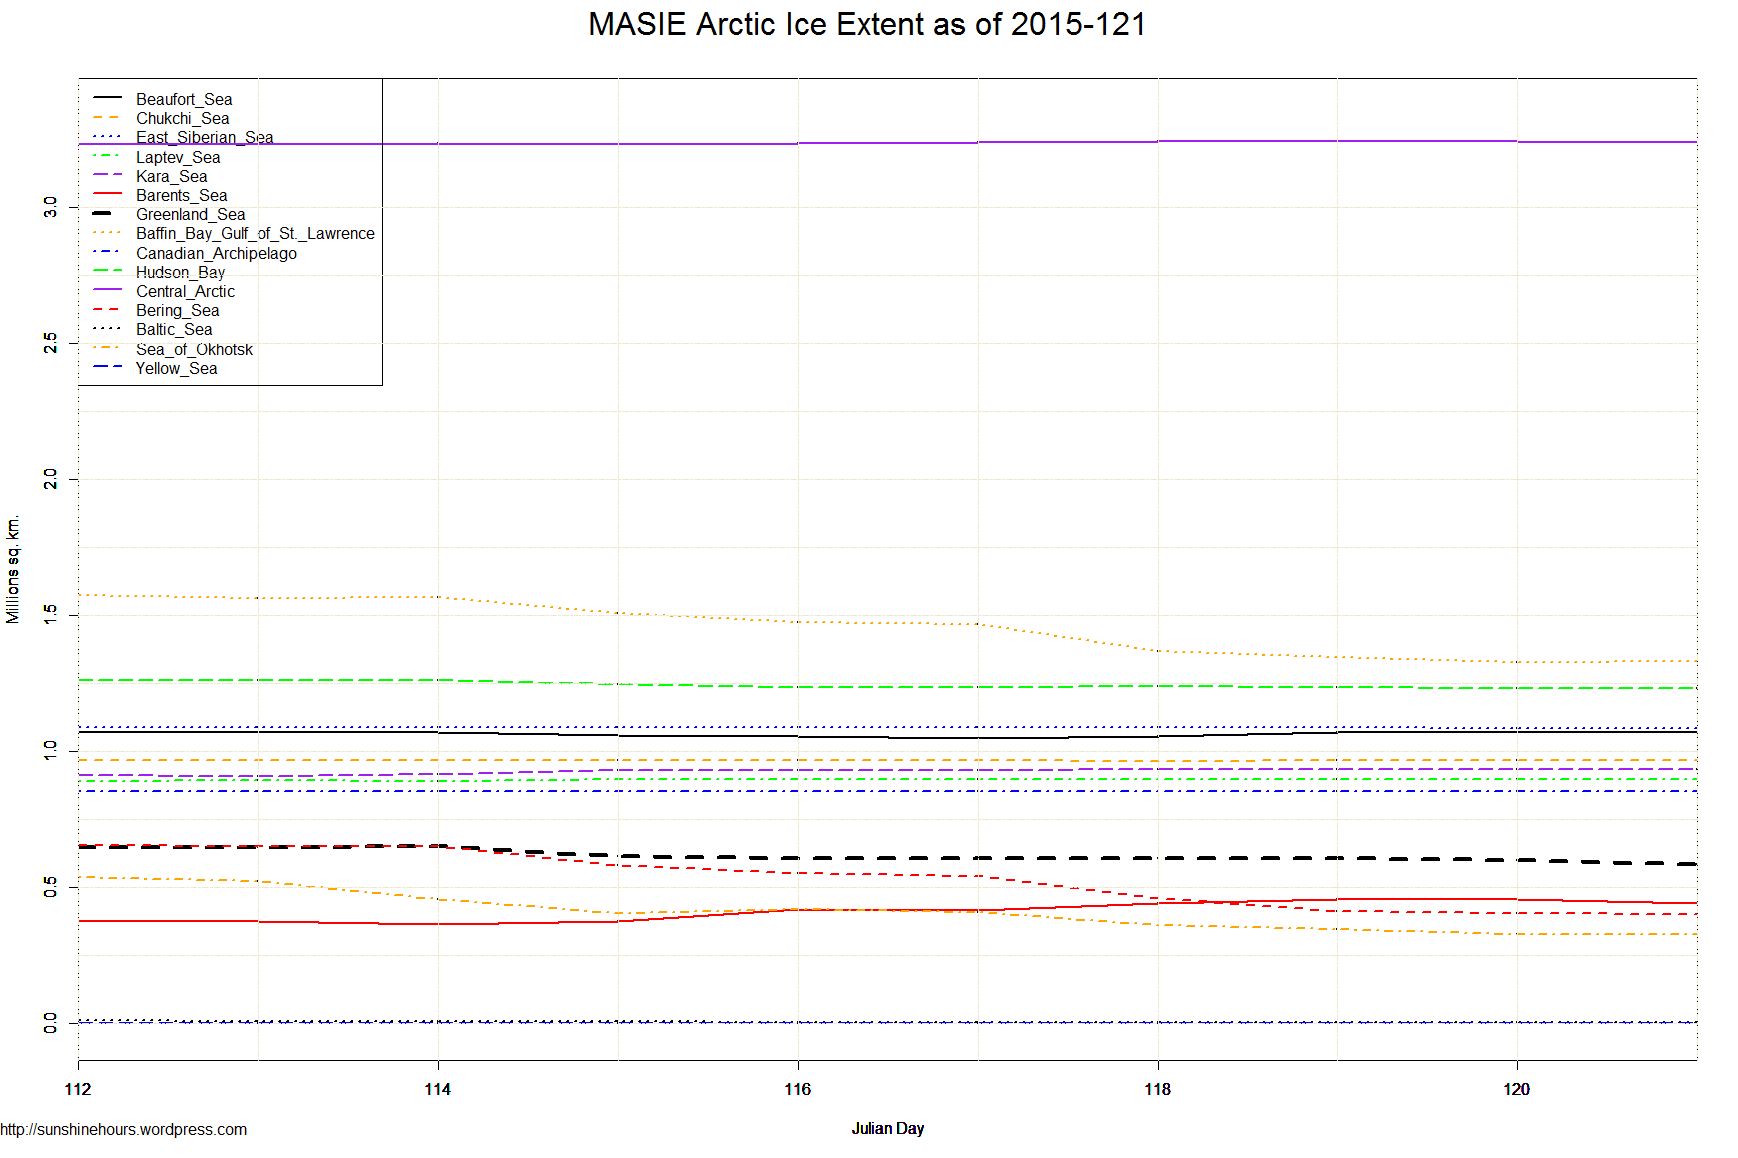
MASIE is now back online. (Thanks to Ron for a comment heads up – I had been checking intermittently)
No old data yet. Just data from day 112 to day 121.
From 02 December 2014 to 17 March 2015, no data are available because the input data files for that time period are corrupt. When our data provider has reprocessed those data, we will back fill the MASIE data, however NSIDC has no estimated date for when we will receive them.