British Columbia Canada Tmax – Missing Data April 2015

This a followup to this post: British Columbia Canada Tmax , Tmin and Tmean from 1873 (On 1×1 Grid)

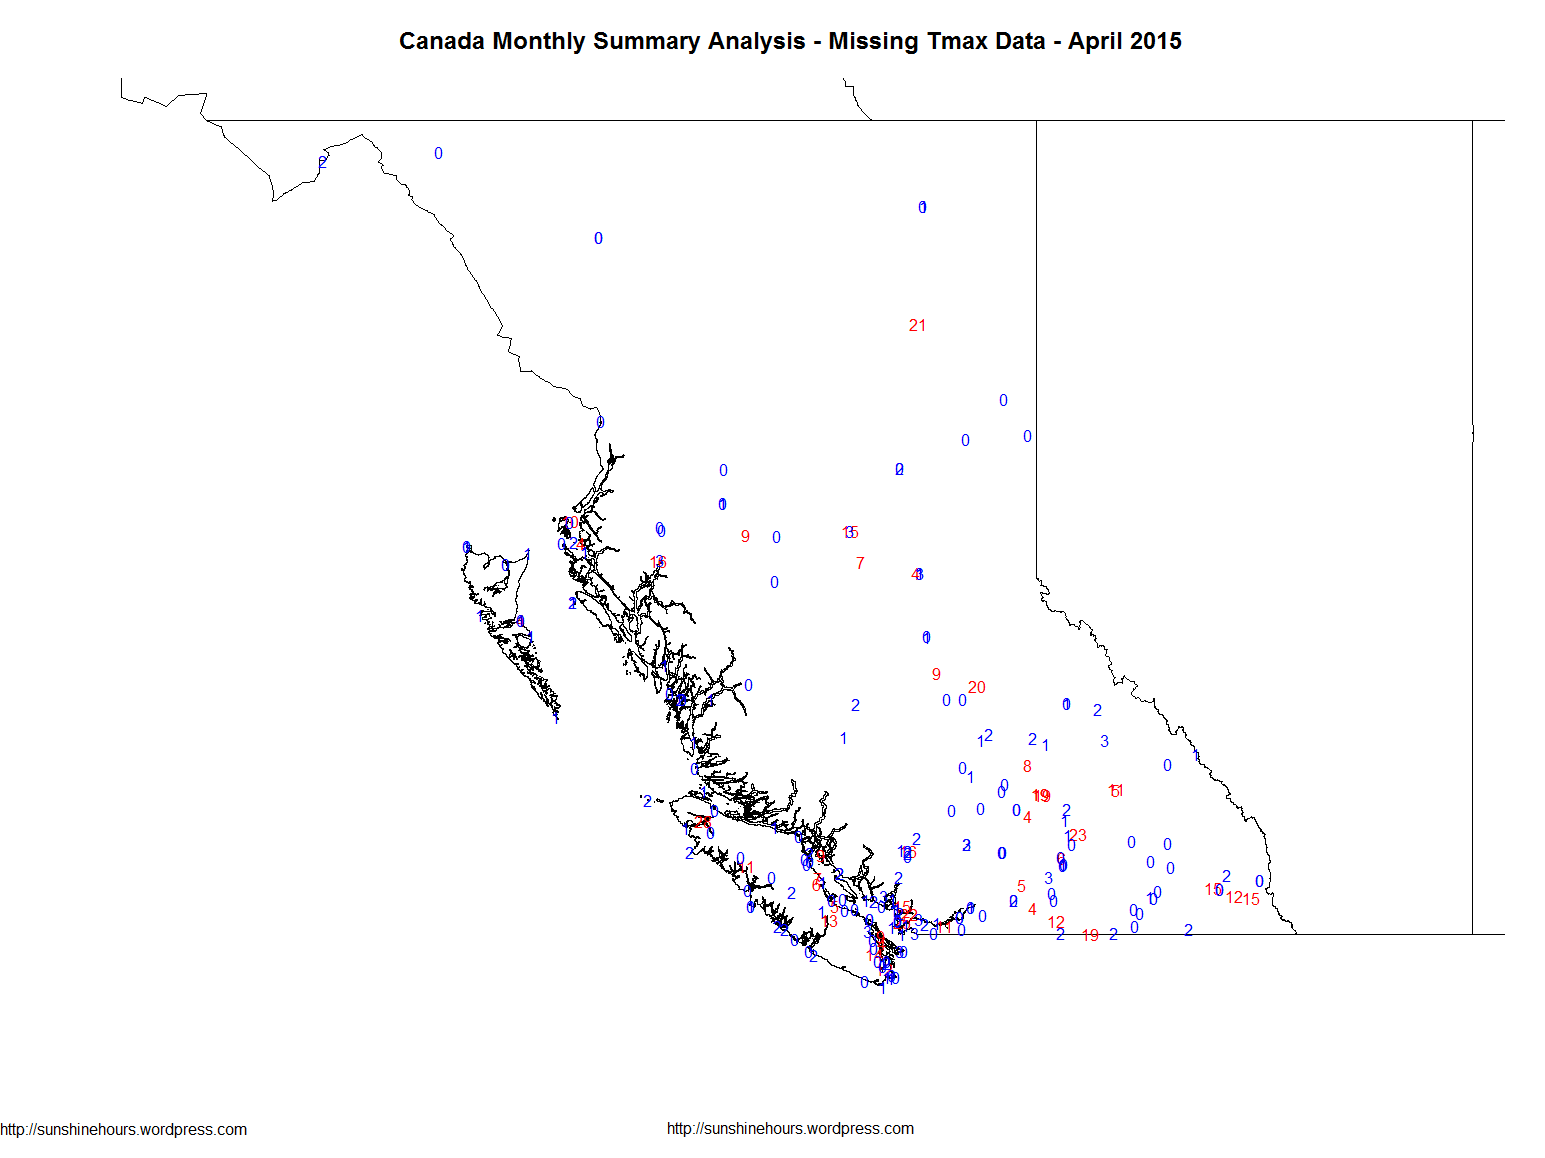
The following map shows which stations were missing (or not missing) daily Tmax data in the monthly summary for April 2015.

Blue had 0-3 days missing. Red more than 3. What saddens me is that 19 out of the 43 “red” stations were also “Normals” – which means they were reference stations.

Canada Monthly Summary Analysis - Missing Tmax Data - April 2015


Leave a Reply

Fill in your details below or click an icon to log in:

WordPress.com Logo

You are commenting using your WordPress.com account. Log Out /  Change )

Facebook photo

You are commenting using your Facebook account. Log Out /  Change )

Connecting to %s