Update: Data here
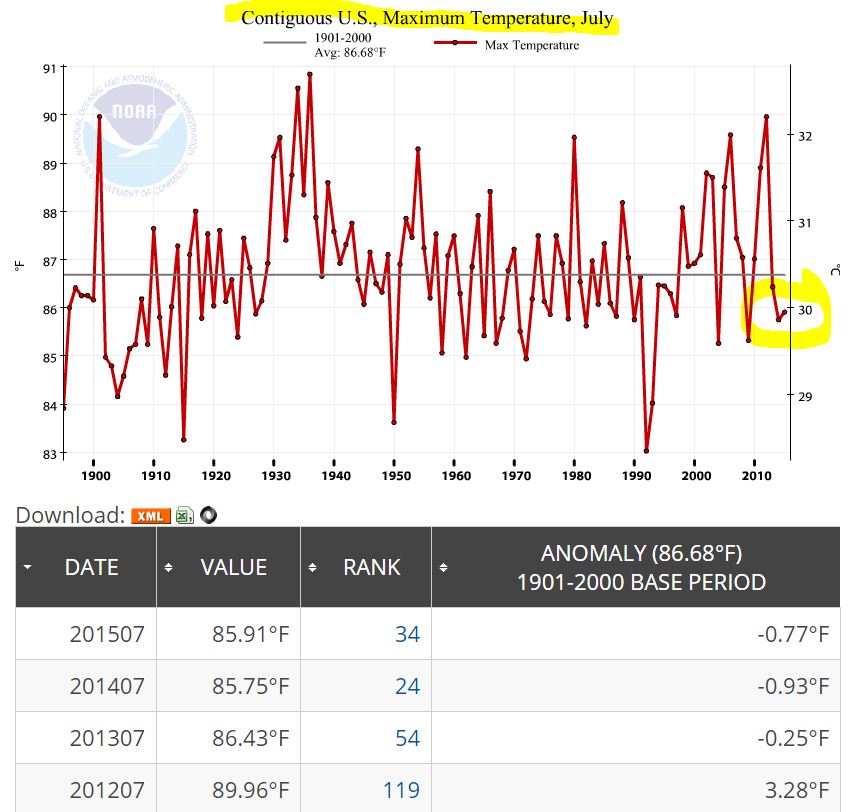
According to the NOAA , Maximum temperatures in the USA were -0.77F colder than the 1901-2000 average.
1936 was ranked 121 (121 is hottest) and was 4.93F hotter than 2015.
2015 was only ranked 34.
Update: Data here
According to the NOAA , Maximum temperatures in the USA were -0.77F colder than the 1901-2000 average.
1936 was ranked 121 (121 is hottest) and was 4.93F hotter than 2015.
2015 was only ranked 34.

zNot …zTrue
June 2015 was 2nd warmest for the contiguous US
https://www.ncdc.noaa.gov/sotc/summary-info/national/201506
I was discussing July. Not June.
that gy @sippindic wants to know where the primary data for this is. I trust you, always have. Why don’t you tweet his av punt with info he is requesting? Thank you. Donna
http://www.ncdc.noaa.gov/cag/
Reblogged this on Canadian Climate Guy and commented:
Truth in the unaltered data speaks clearly to a cooling trend.
that has to do with airflow patterns, most of the world was warmer. but i’m glad for everyone that after we reached almost last highest (LOL) you found a new handle to live the scepticism. i give you a guarantee that this last resorts will crumble to oblivion soon. still i like your site because the images are very good, better than in many other places. just dont’ get stuck with believes but sooner or later switch to obvious facts. even the pope looses followers because less and less people believe in pregnant virgins and flat planets.
If you plot average temp, minimum temp, whatevs. it shows warming. So nice job of finding the ONE dataset in the bunch.
Best,
D
Thanks. But you must understand that higher minimum temperature is caused by UHI. And that the AGW people predicted more heatwaves.
No heatwave in July. 3 years in a row.
It looks like NOAA is still trying to play July 2015 up as the hottest July on record, despite these factual conditions in the USA as well as the occurrence of an all-year-round snowcover in the Scottish Highlands. There may be a superficial global warming, but this is mainly caused by combustion apparatus in use for heating, transport and the generation of electricity.