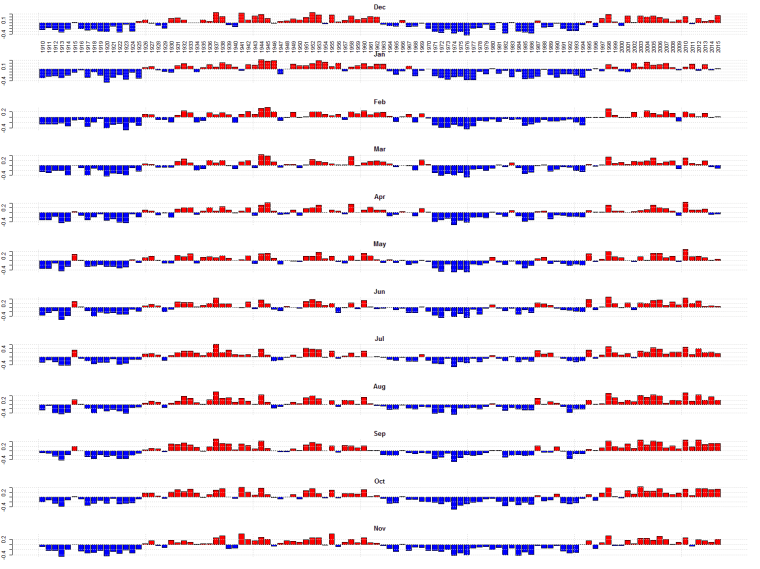
AMO as of Dec 2015 Published on January 31, 2016January 31, 2016 by sunshinehours1 The AMO for each month as of Dec 2015. Some months the AMO is still high. Some it is low. Share this: Share on X (Opens in new window) X Share on Facebook (Opens in new window) Facebook Like Loading... Related
The AMO has another 15 years at least before it turns negative, does it not? Isn’t the graph above fairly representative of a 30-year sine wave pattern? Reply
A bit like this? http://www.woodfortrees.org/plot/hadcrut4gl/from:1850/trend/plot/hadcrut4gl/from:1910/to:1940/trend/plot/hadcrut4gl/from:2001/trend/offset:-0.1/plot/hadcrut4gl/from:1860/to:1880/trend/plot/hadcrut4gl/from:1970/to:2000/trend/plot/hadcrut4gl/from:1880/to:1910/trend/plot/hadcrut3vgl/from:1940/to:1970/trend/plot/hadcrut4gl/from:1850/to:1860/trend/plot/hadcrut4gl/mean:120 Reply

Reblogged this on CraigM350.
The AMO has another 15 years at least before it turns negative, does it not? Isn’t the graph above fairly representative of a 30-year sine wave pattern?
A bit like this?
http://www.woodfortrees.org/plot/hadcrut4gl/from:1850/trend/plot/hadcrut4gl/from:1910/to:1940/trend/plot/hadcrut4gl/from:2001/trend/offset:-0.1/plot/hadcrut4gl/from:1860/to:1880/trend/plot/hadcrut4gl/from:1970/to:2000/trend/plot/hadcrut4gl/from:1880/to:1910/trend/plot/hadcrut3vgl/from:1940/to:1970/trend/plot/hadcrut4gl/from:1850/to:1860/trend/plot/hadcrut4gl/mean:120