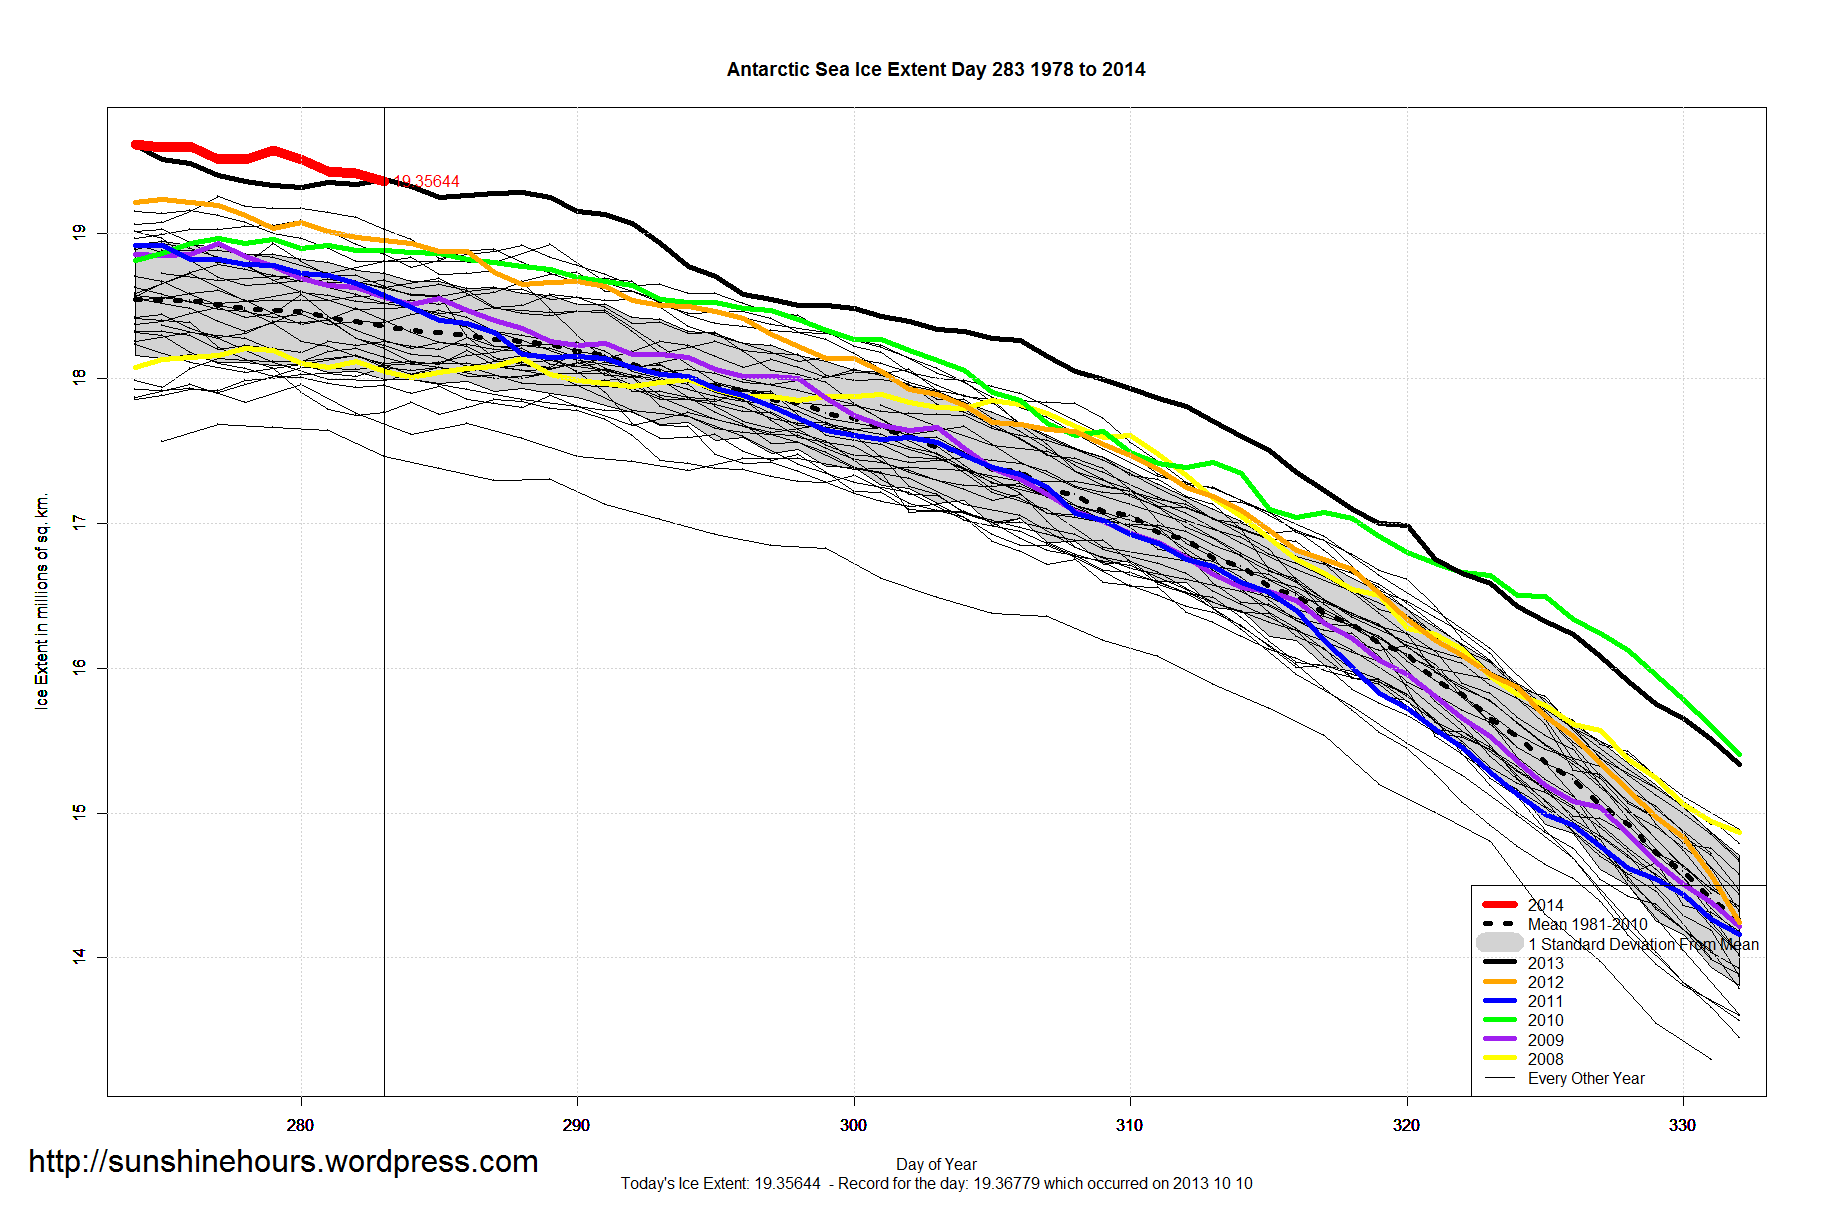


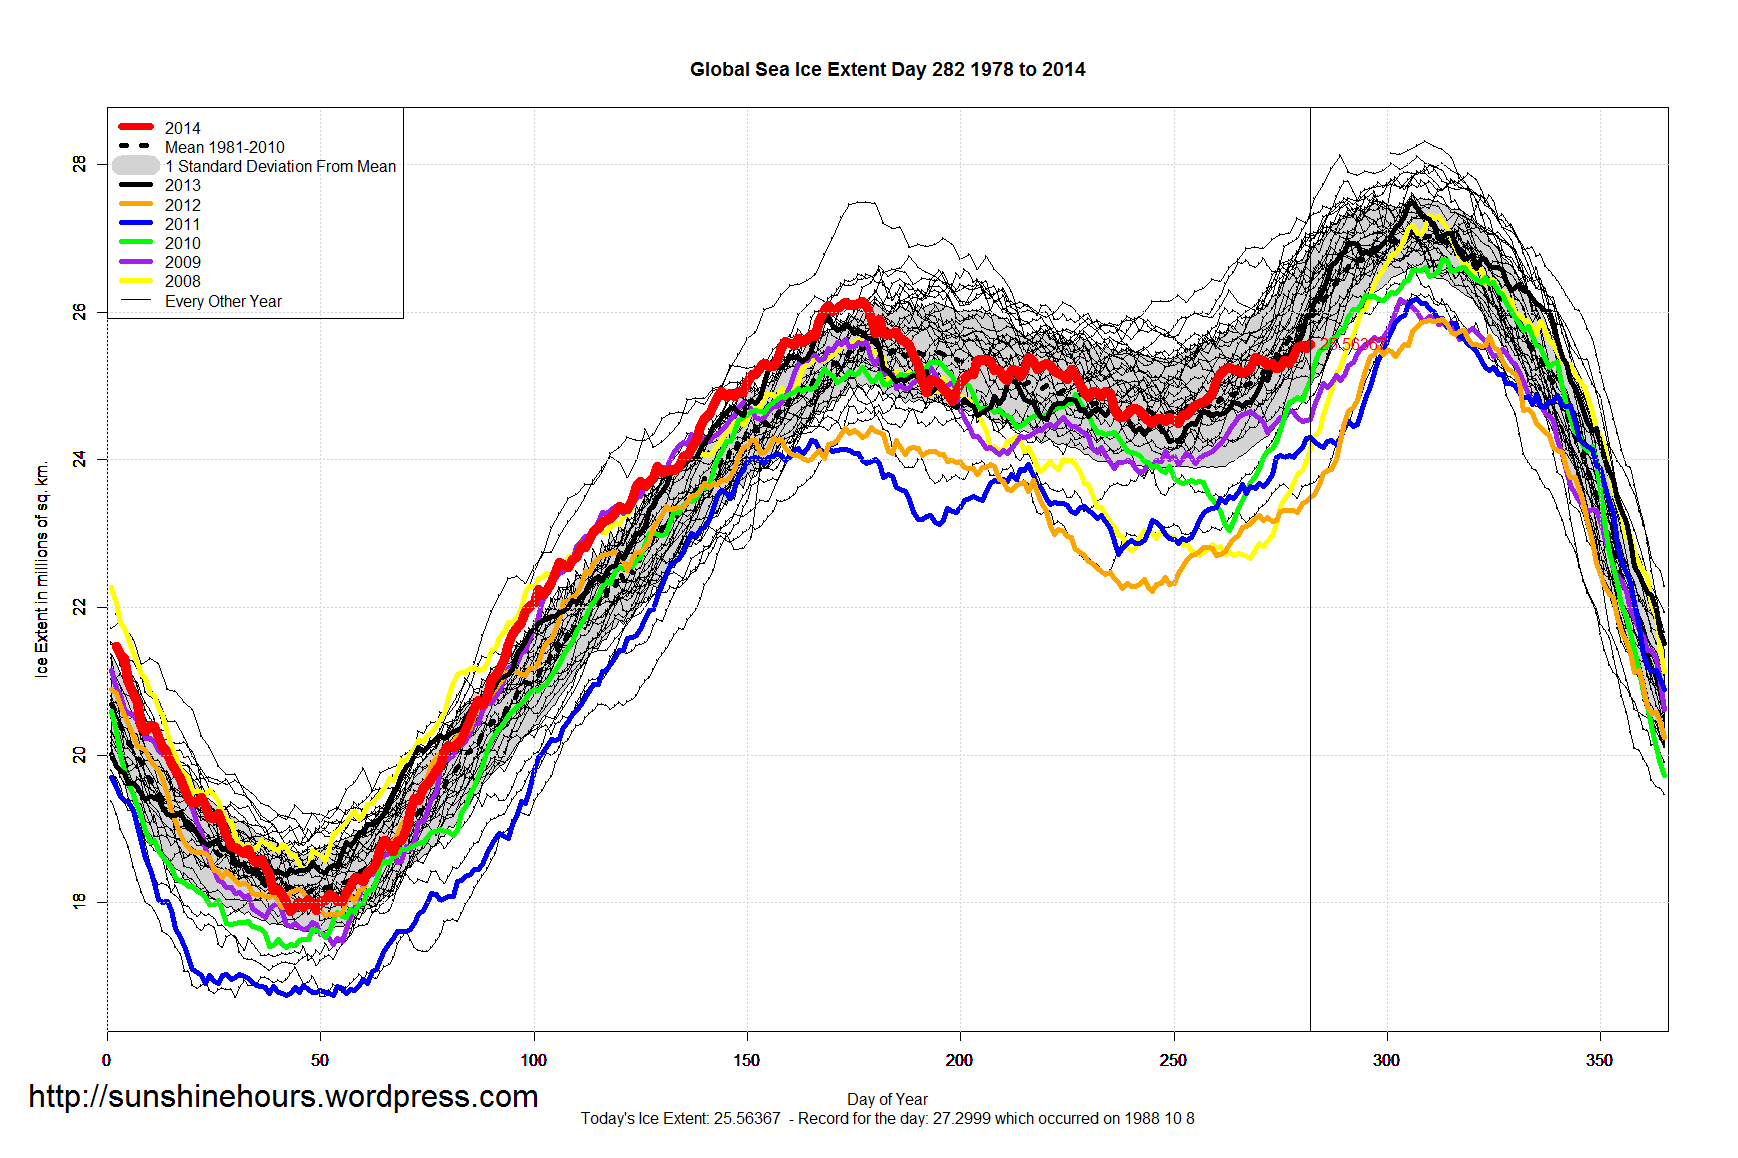
Category: Arctic Sea Ice
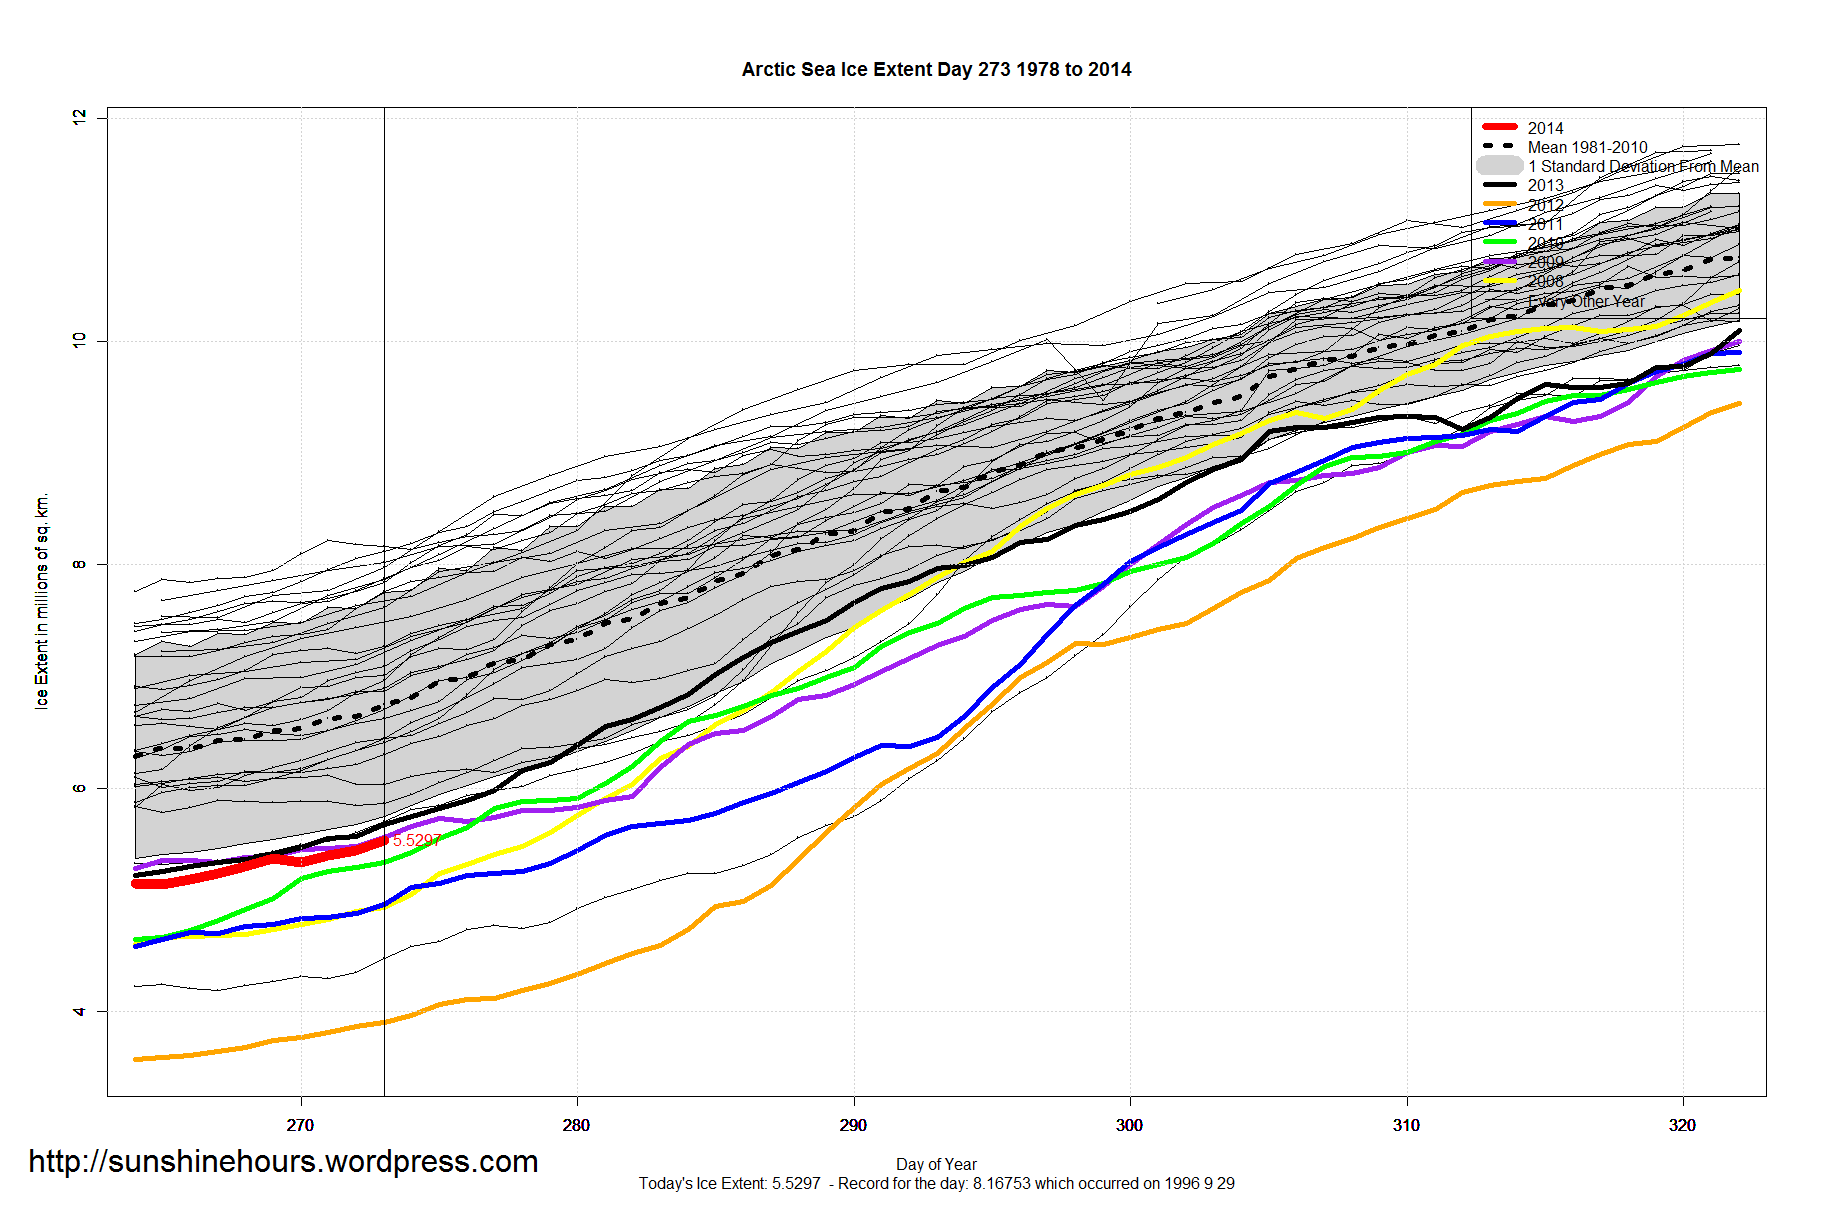
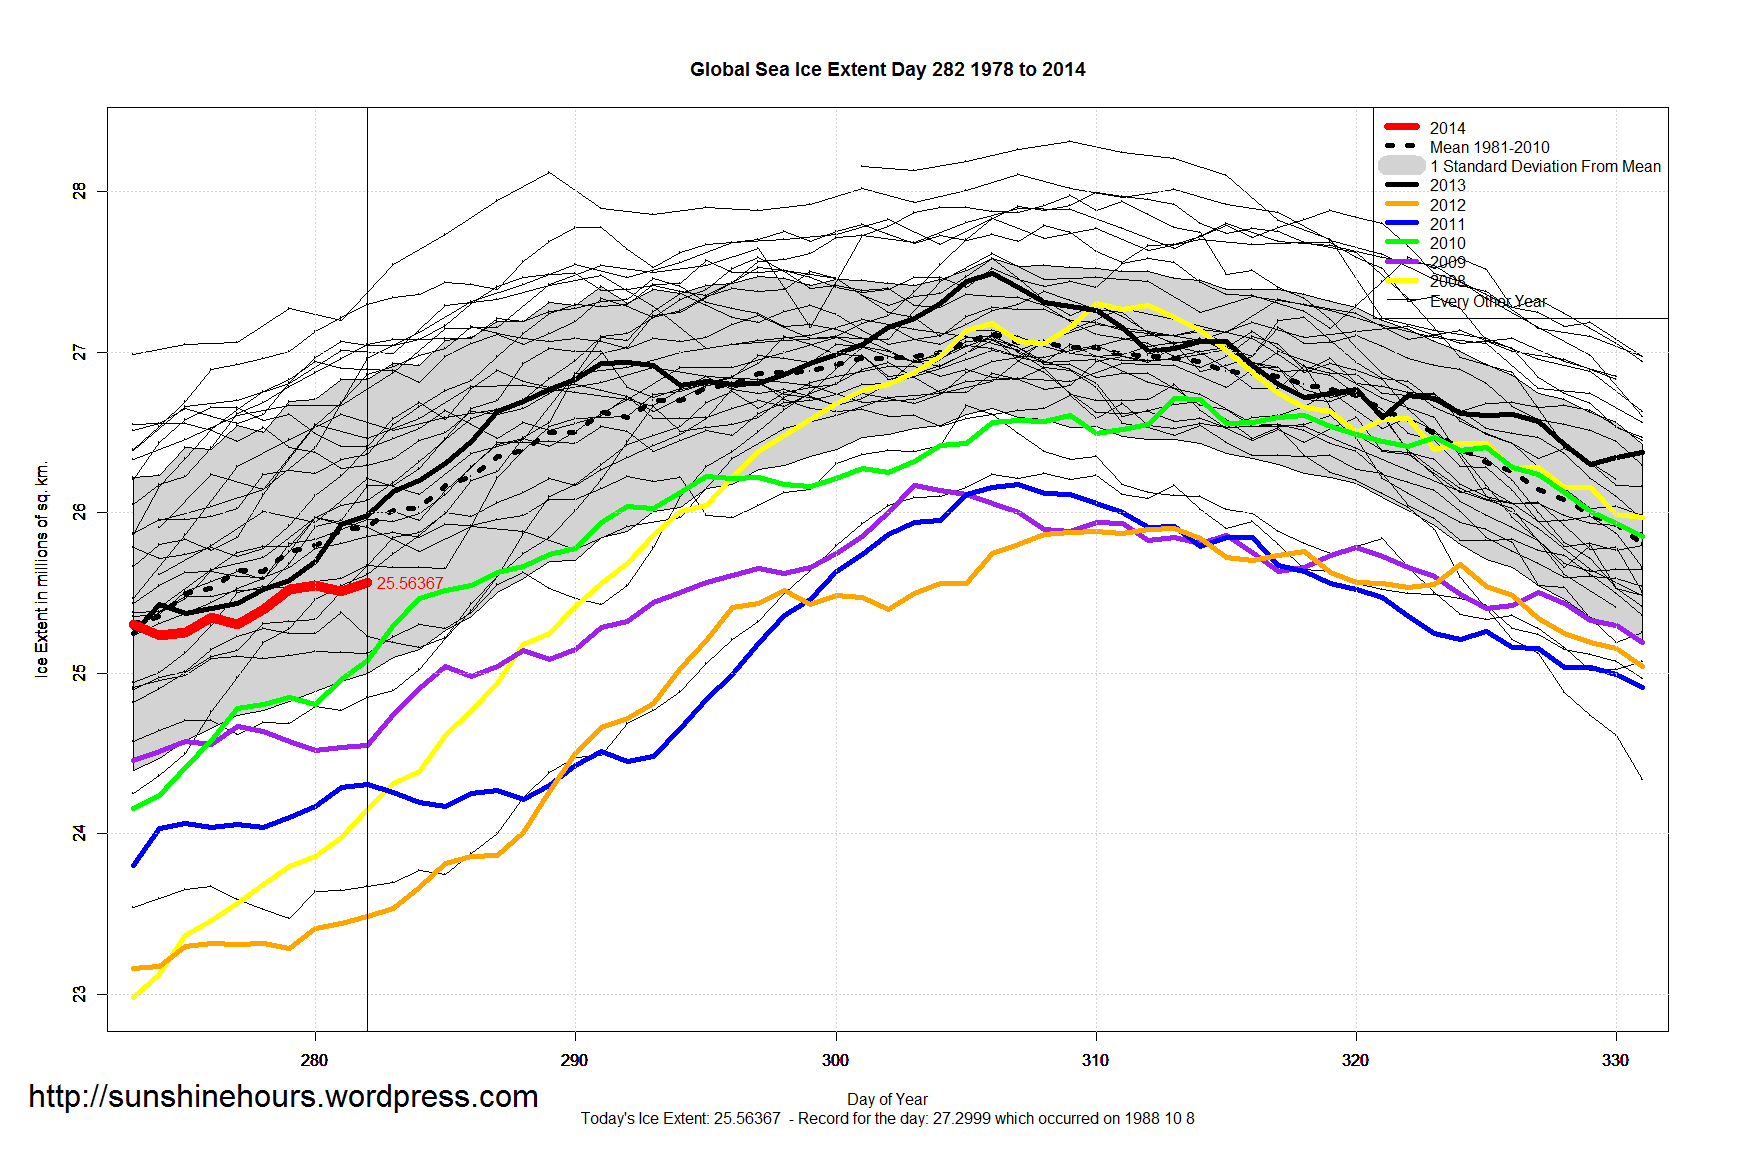
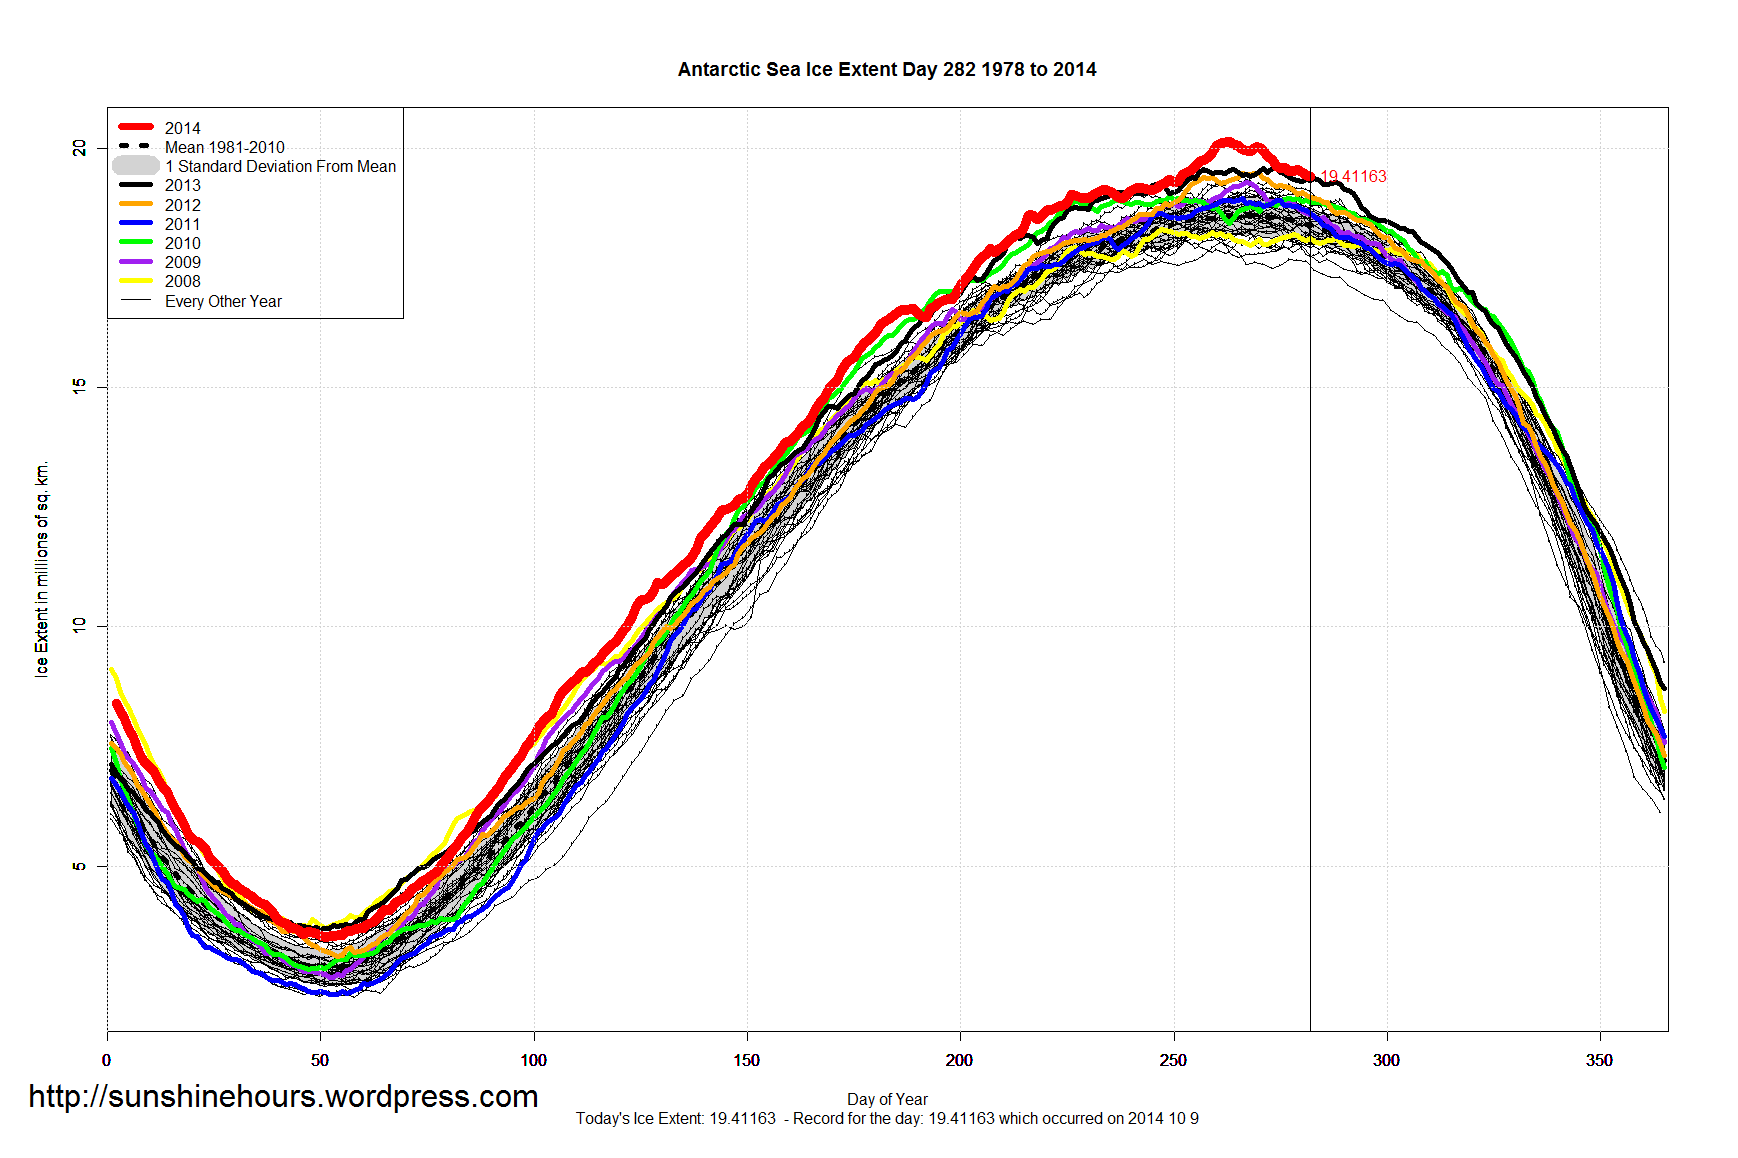
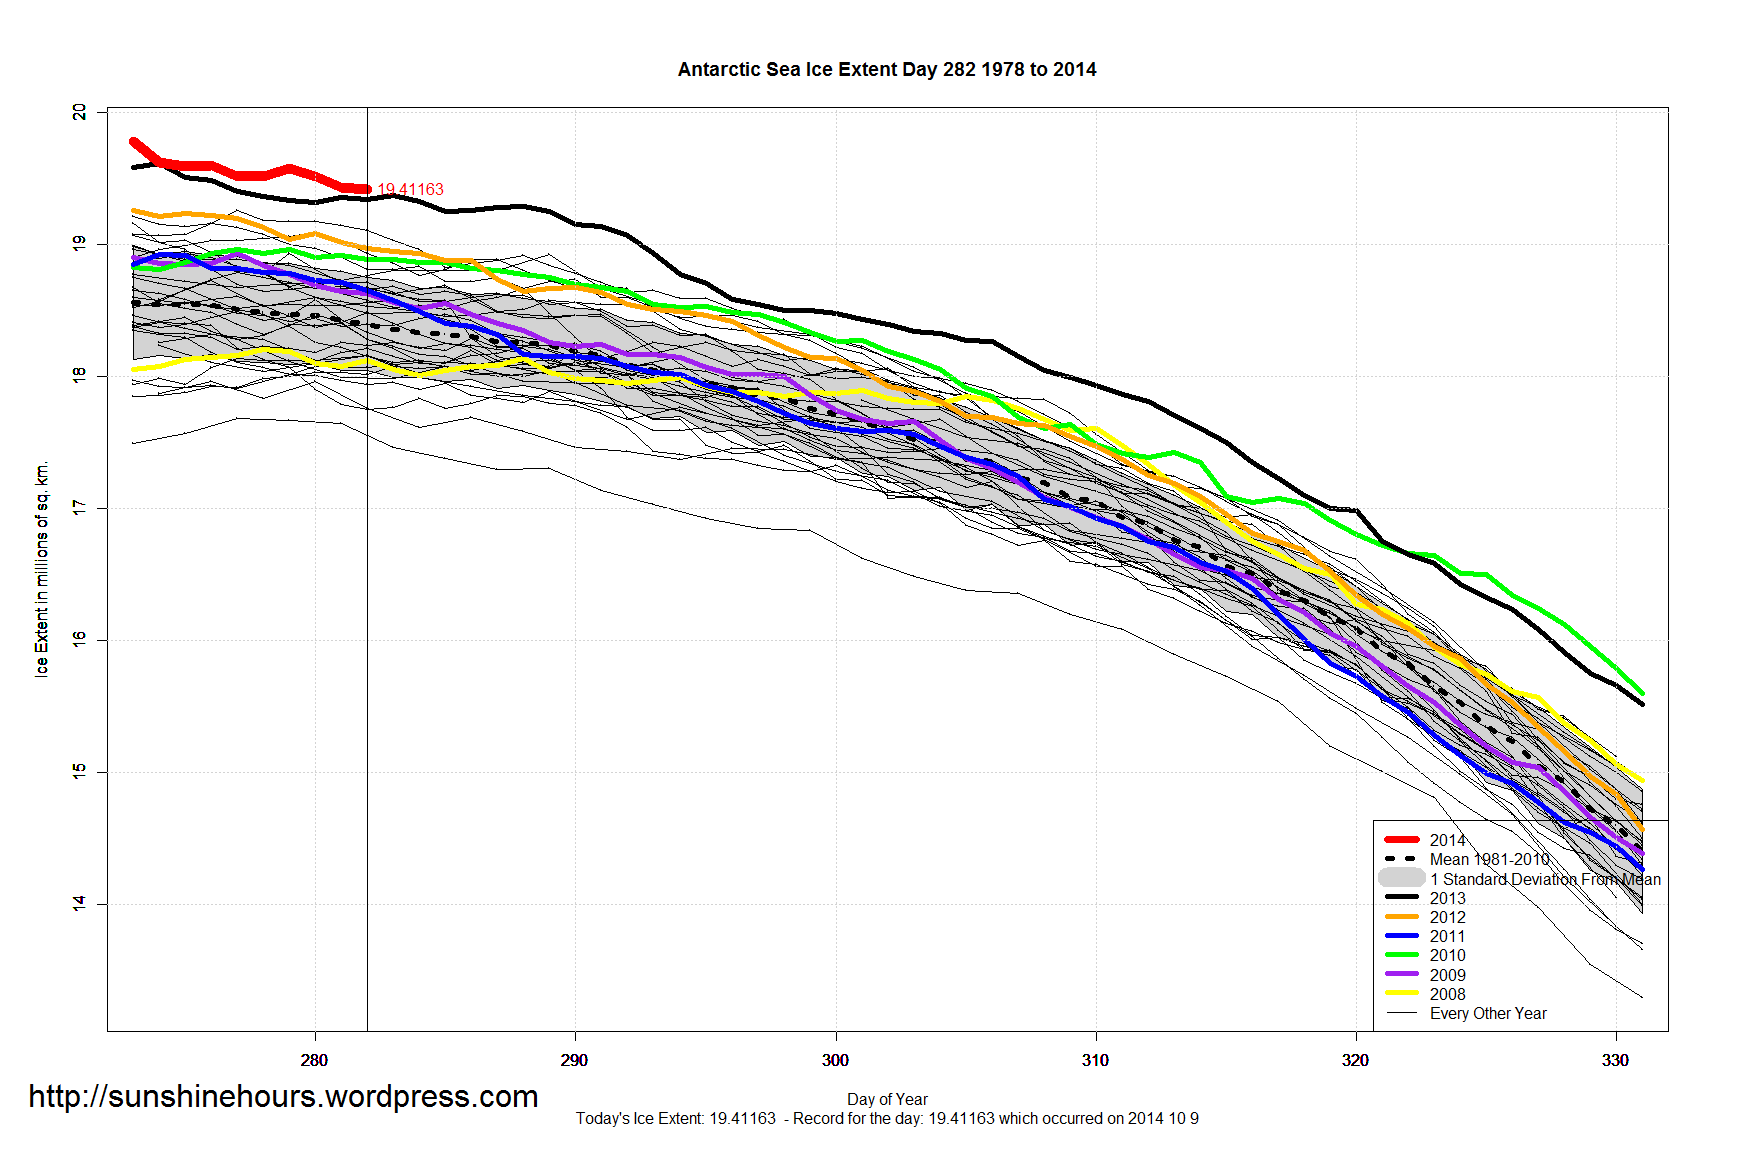
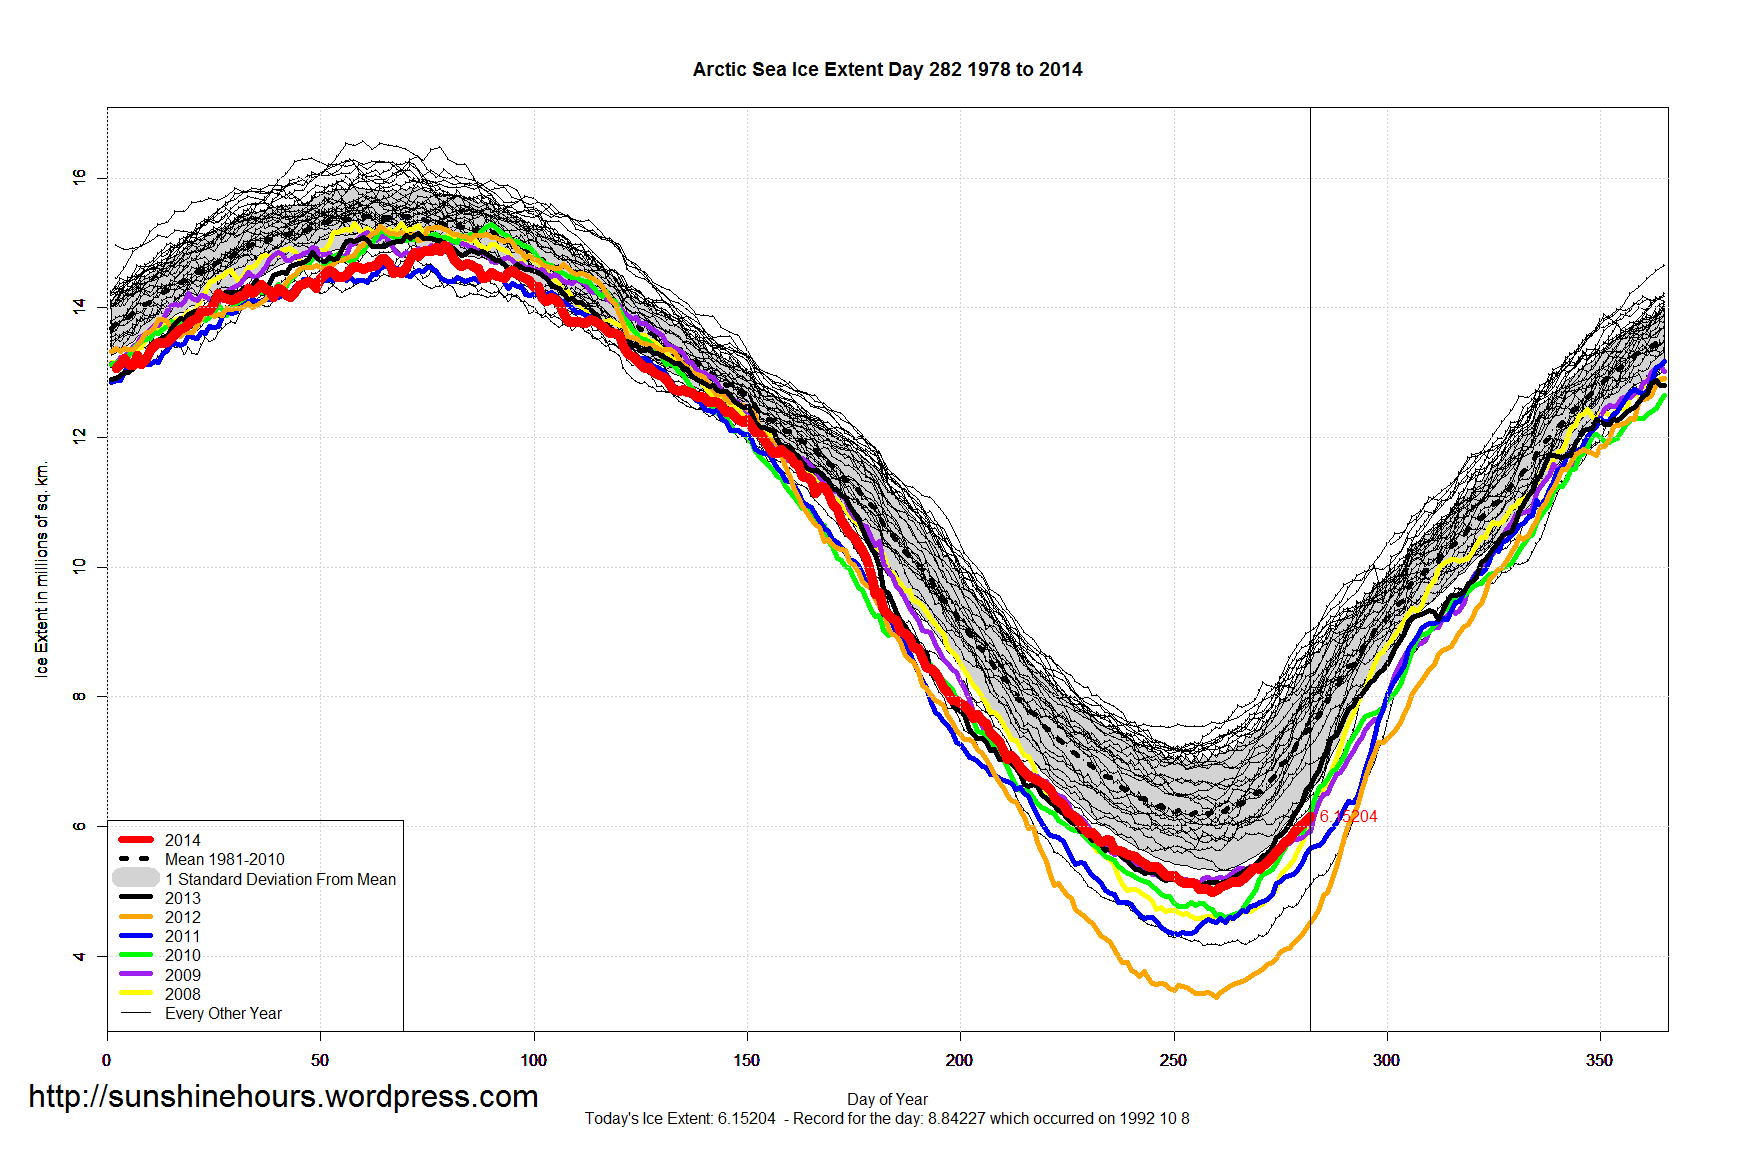
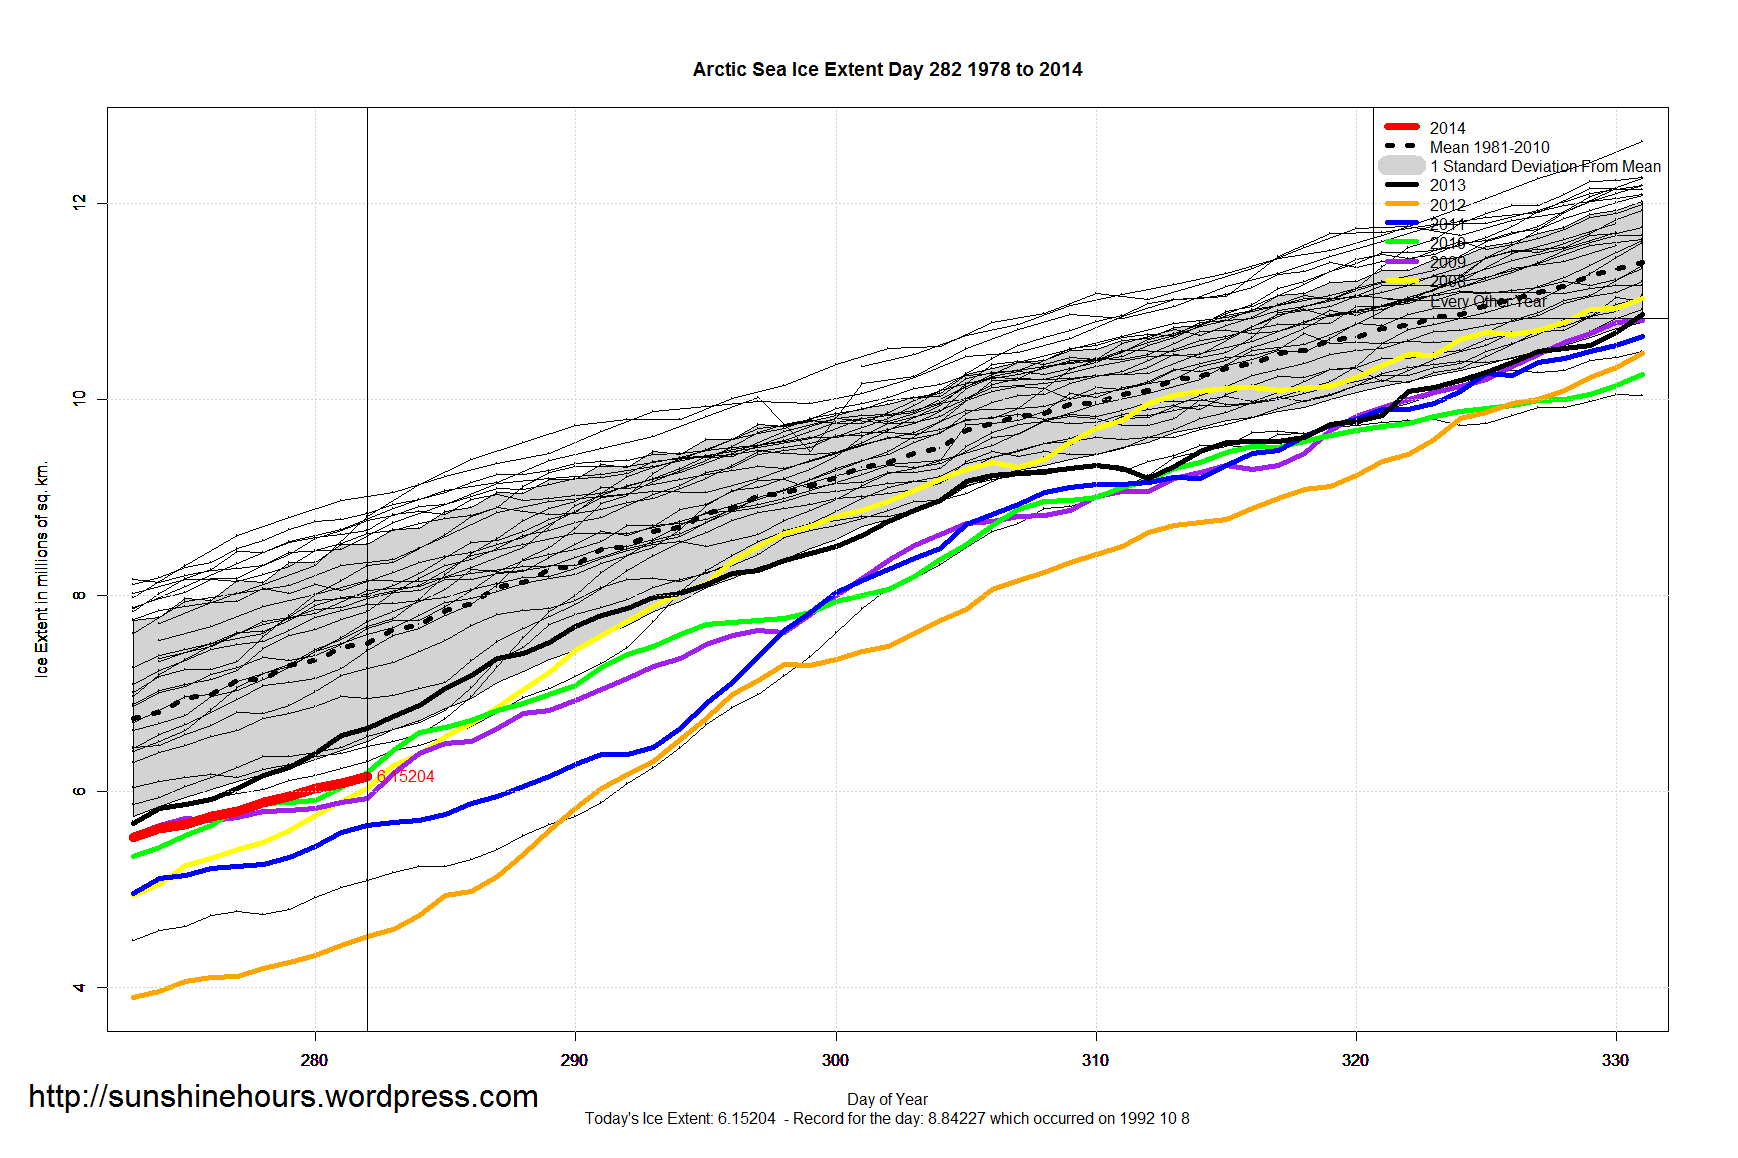
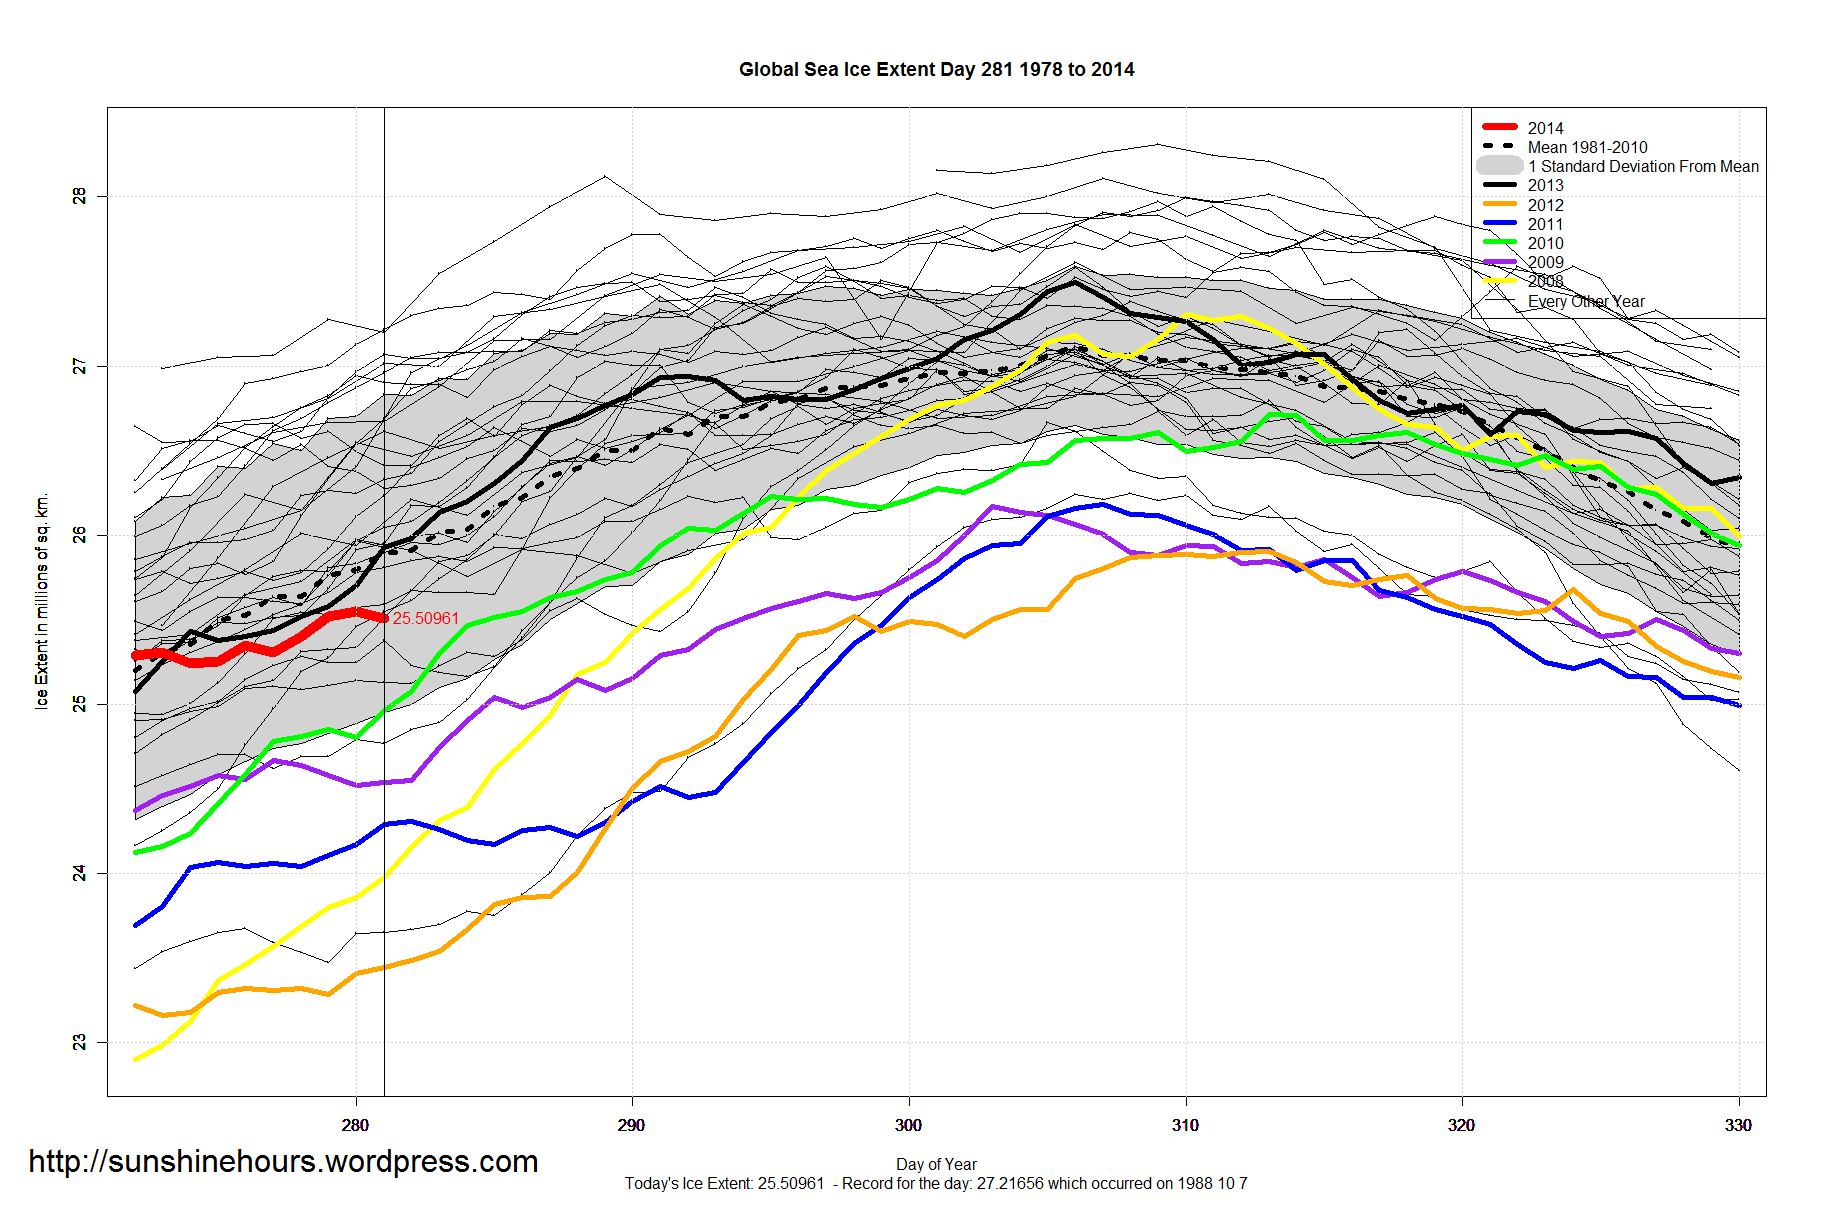
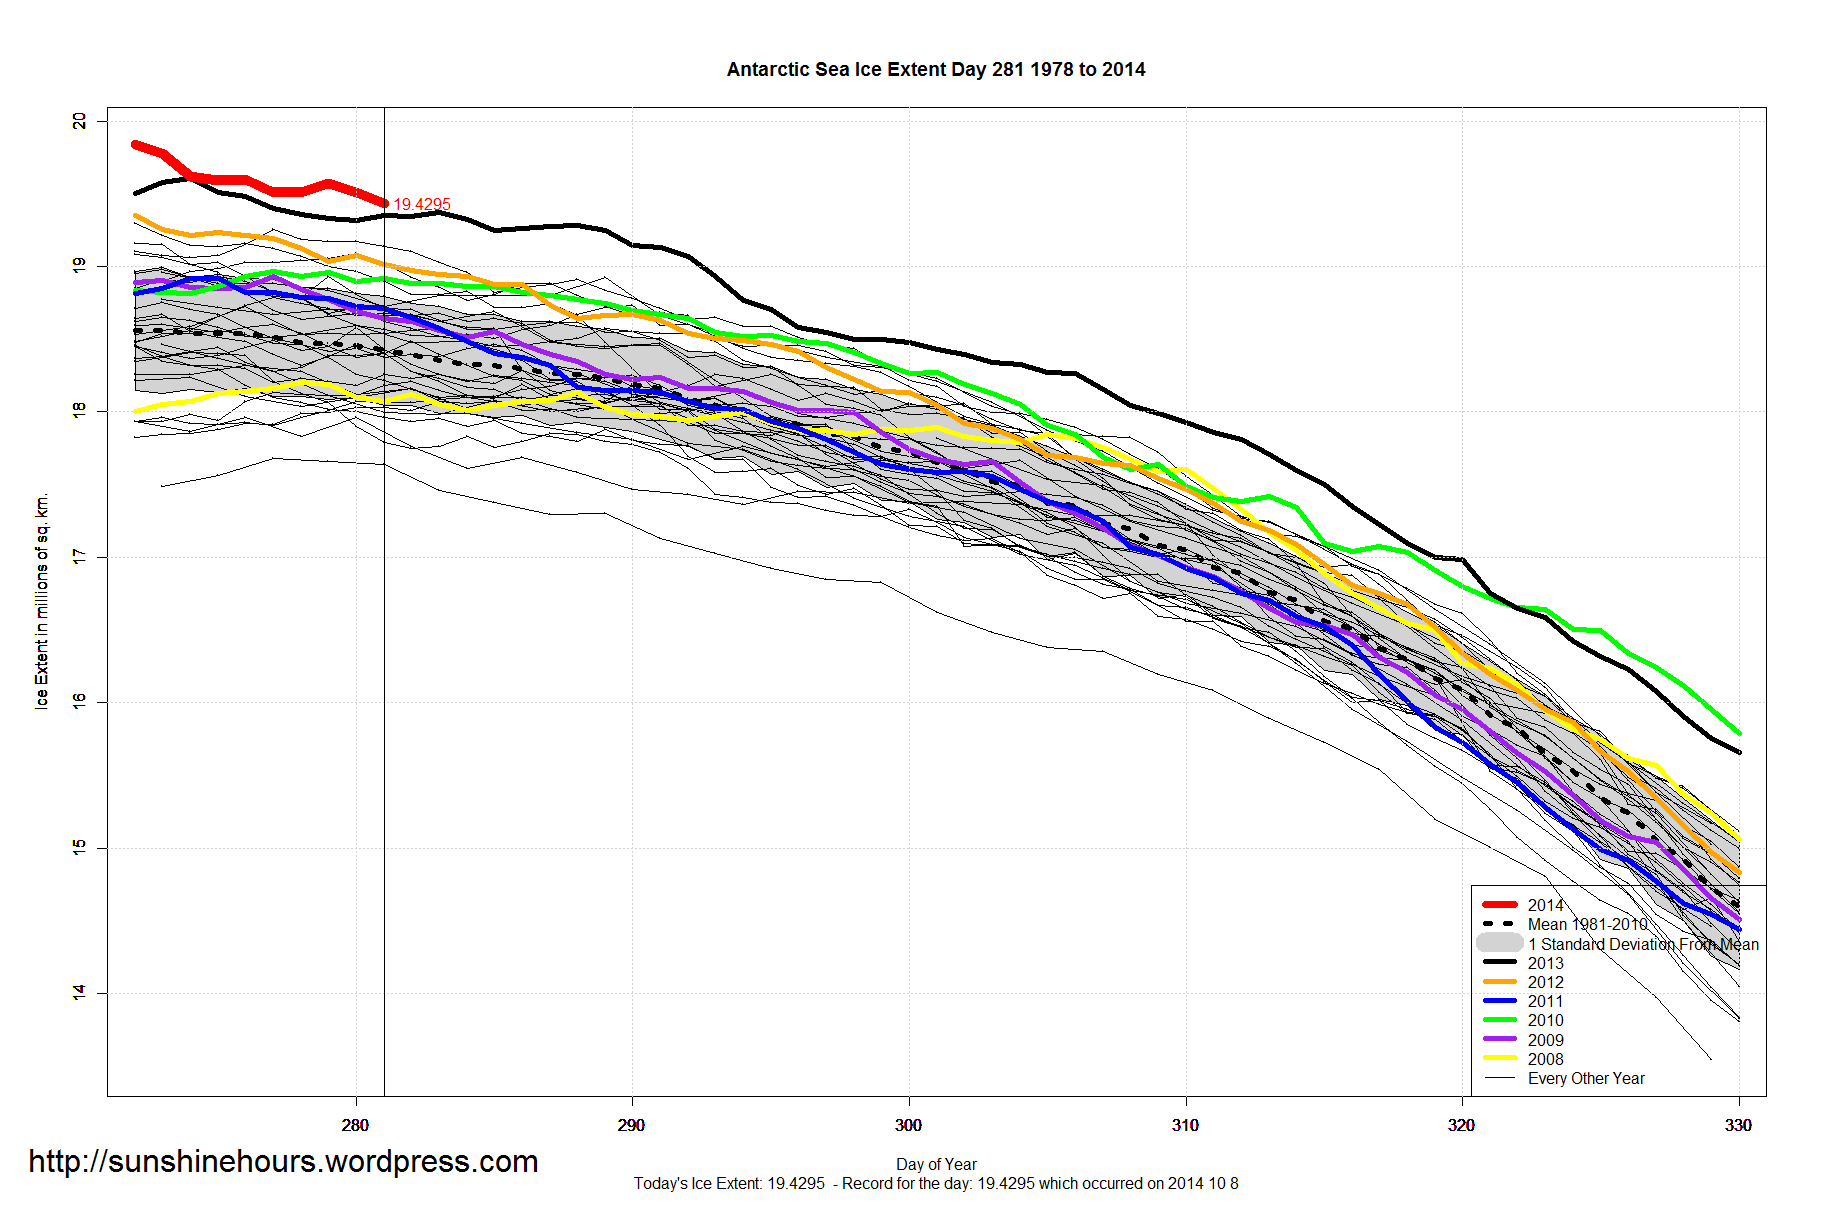
Sea Ice Extent – Day 282
MASIE Arctic Oct 09 2014 – Big Gain
Oct 09 2014 MASIE Update – Big Gain – Every Region Still With Ice Gained More Ice
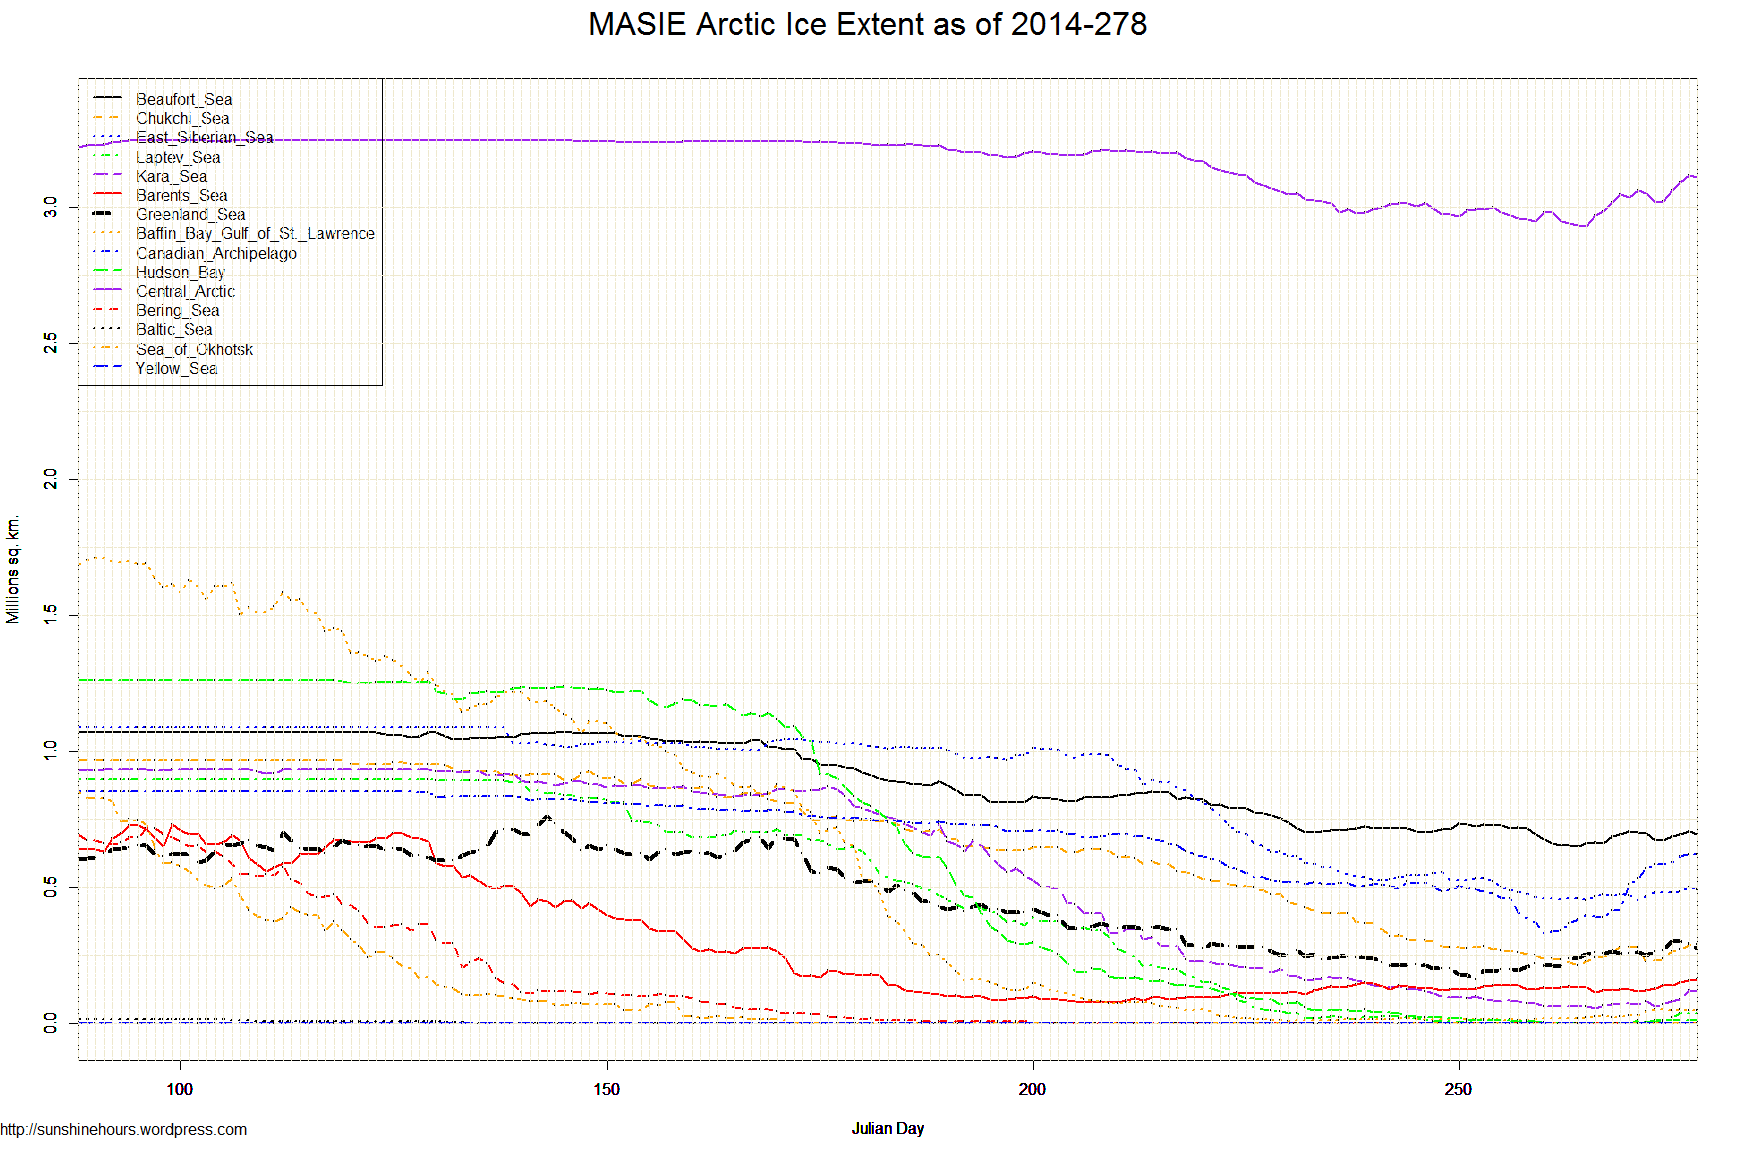
Data here. Click for bigger.
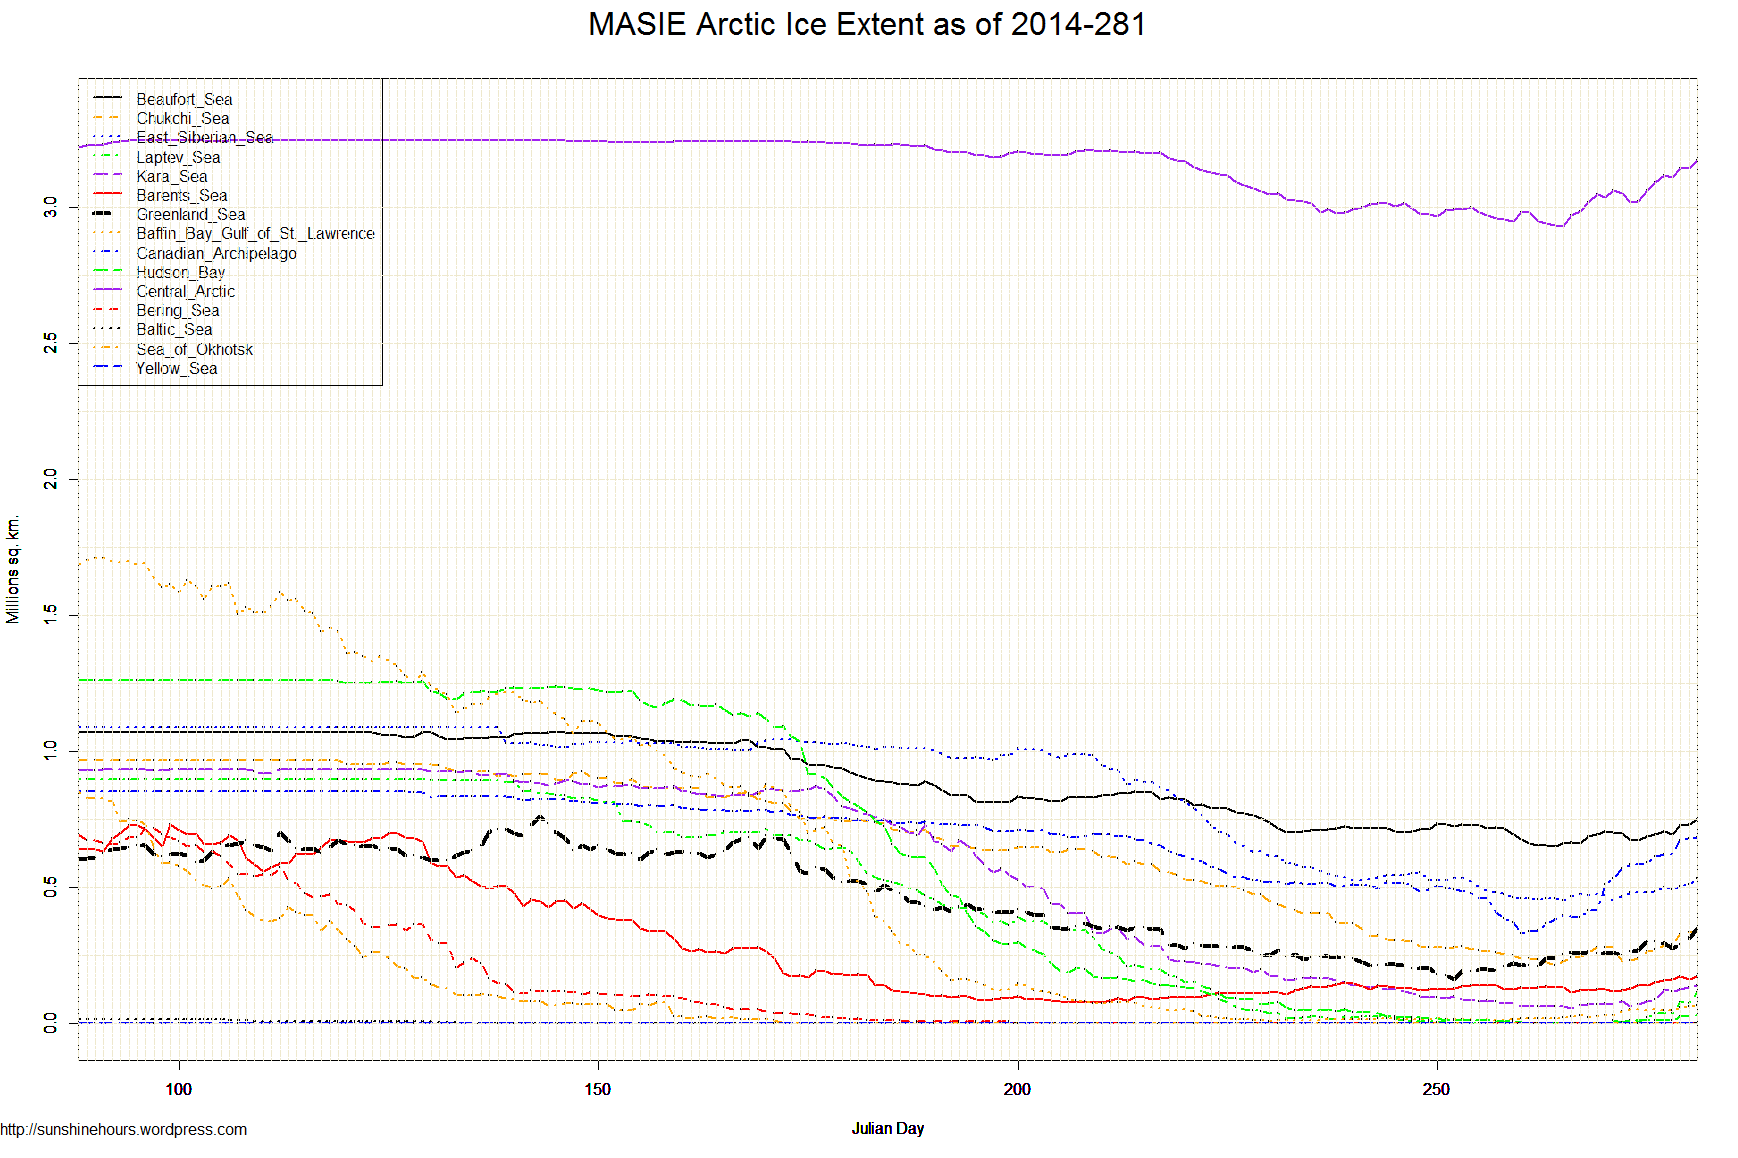
| Region | 194 days ago | End | Last 193 | Last 28 | Last 14 | Last 7 | Last 3 | Last 1 |
| Bering Sea | 697,324 | 0 | -697,324 | 0 | 0 | 0 | 0 | 0 |
| Baltic Sea | 15,337 | 0 | -15,337 | 0 | 0 | 0 | 0 | 0 |
| Sea of Okhotsk | 853,240 | 0 | -853,240 | 0 | 0 | 0 | 0 | 0 |
| Yellow Sea | 0 | 0 | 0 | 0 | 0 | 0 | 0 | 0 |
| Chukchi Sea | 966,006 | 335,001 | -631,005 | 52,805 | 86,108 | 96,399 | 42,123 | 314 |
| Baffin Bay Gulf of St. Lawrence | 1,688,530 | 65,308 | -1,623,223 | 50,872 | 36,064 | 12,430 | 16,039 | 2,278 |
| Canadian Archipelago | 853,214 | 683,668 | -169,547 | 196,530 | 292,248 | 99,709 | 62,394 | 2,386 |
| Hudson Bay | 1,260,903 | 29,757 | -1,231,146 | 16,972 | 28,309 | 19,382 | 19,382 | 2,578 |
| Kara Sea | 933,859 | 141,662 | -792,198 | 52,816 | 75,915 | 69,649 | 24,314 | 6,854 |
| Barents Sea | 645,917 | 171,904 | -474,013 | 33,741 | 50,010 | 33,013 | 8,234 | 10,550 |
| Beaufort Sea | 1,070,445 | 752,106 | -318,339 | 18,871 | 90,446 | 79,678 | 58,062 | 19,931 |
| East Siberian Sea | 1,087,137 | 534,651 | -552,486 | -559 | 61,101 | 53,680 | 42,064 | 23,803 |
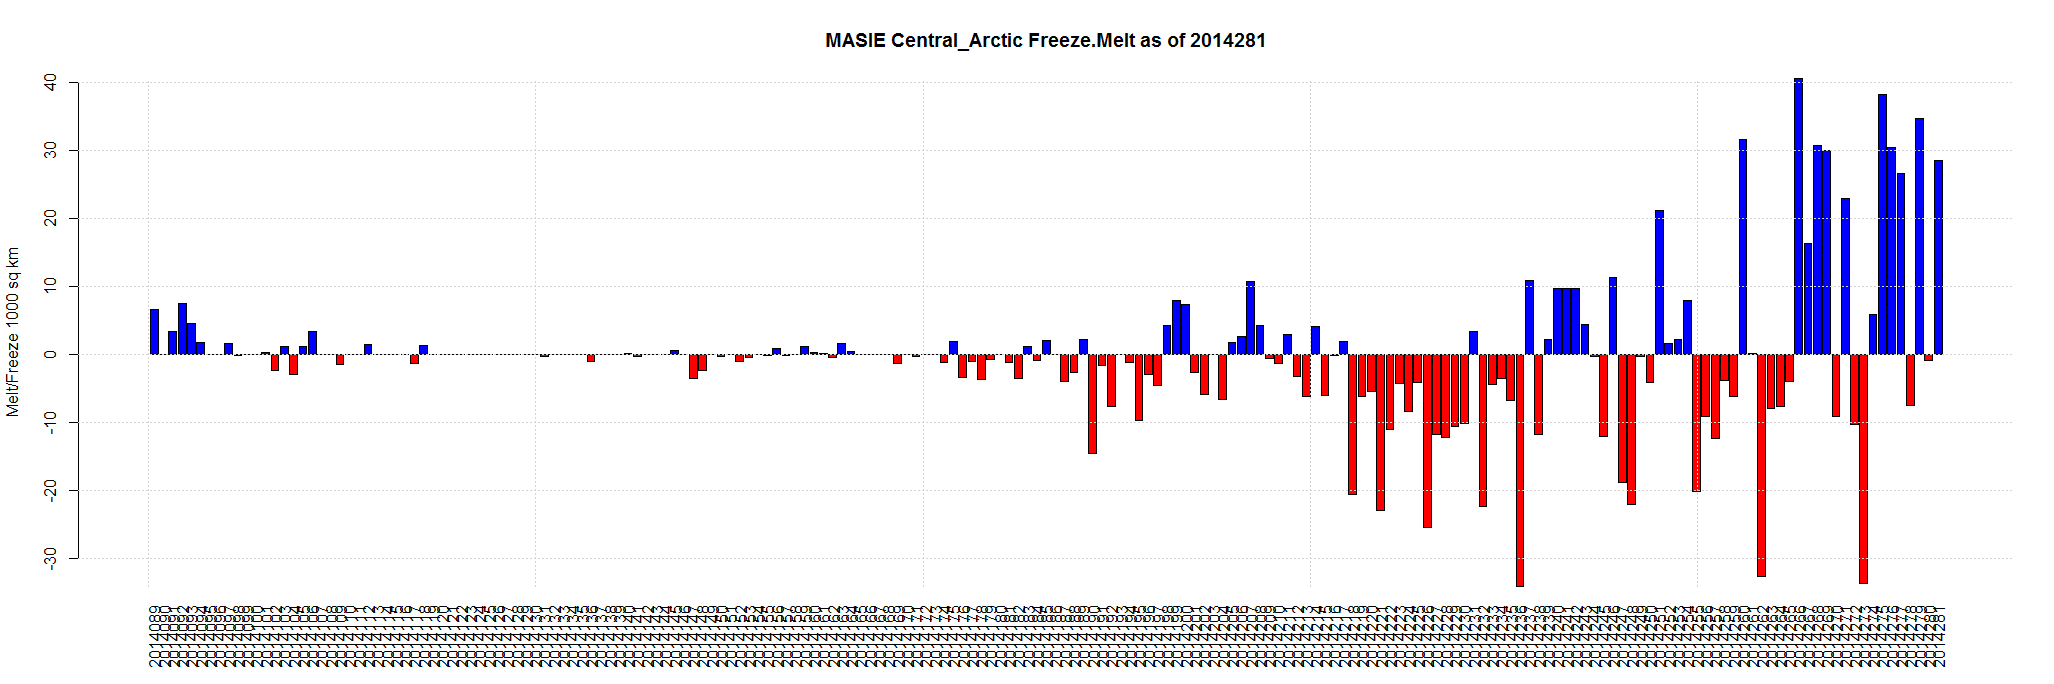
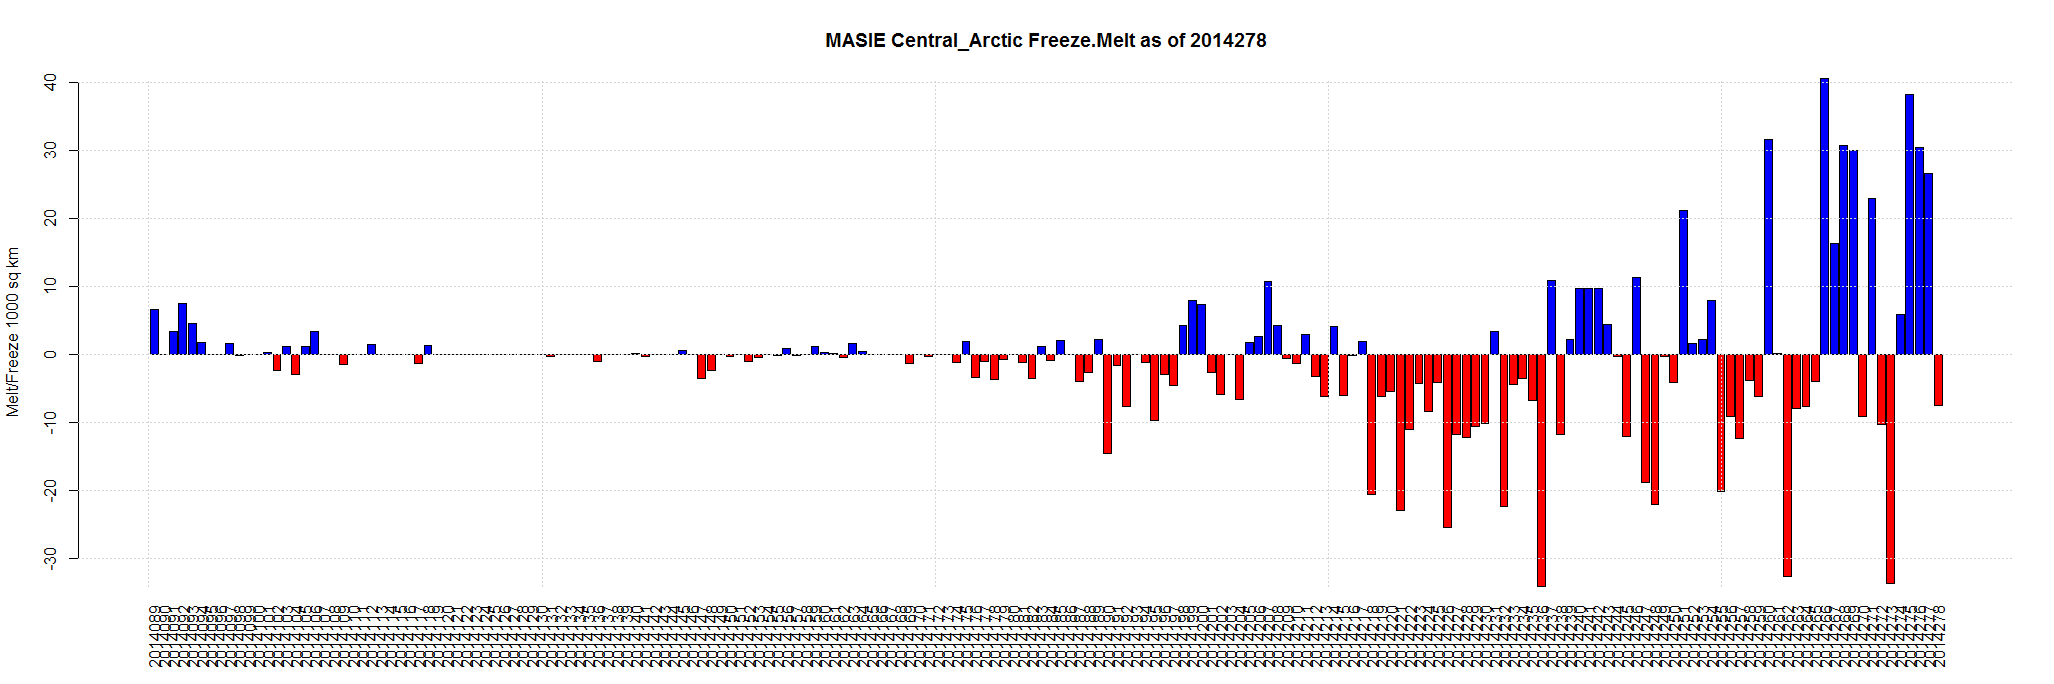
| Central Arctic | 3,221,921 | 3,172,976 | -48,945 | 179,325 | 186,389 | 149,917 | 62,278 | 28,512 |
| Greenland Sea | 603,416 | 348,954 | -254,461 | 152,450 | 91,727 | 78,556 | 72,701 | 37,205 |
| Laptev Sea | 897,845 | 114,502 | -783,343 | 112,707 | 113,153 | 108,890 | 77,396 | 41,561 |
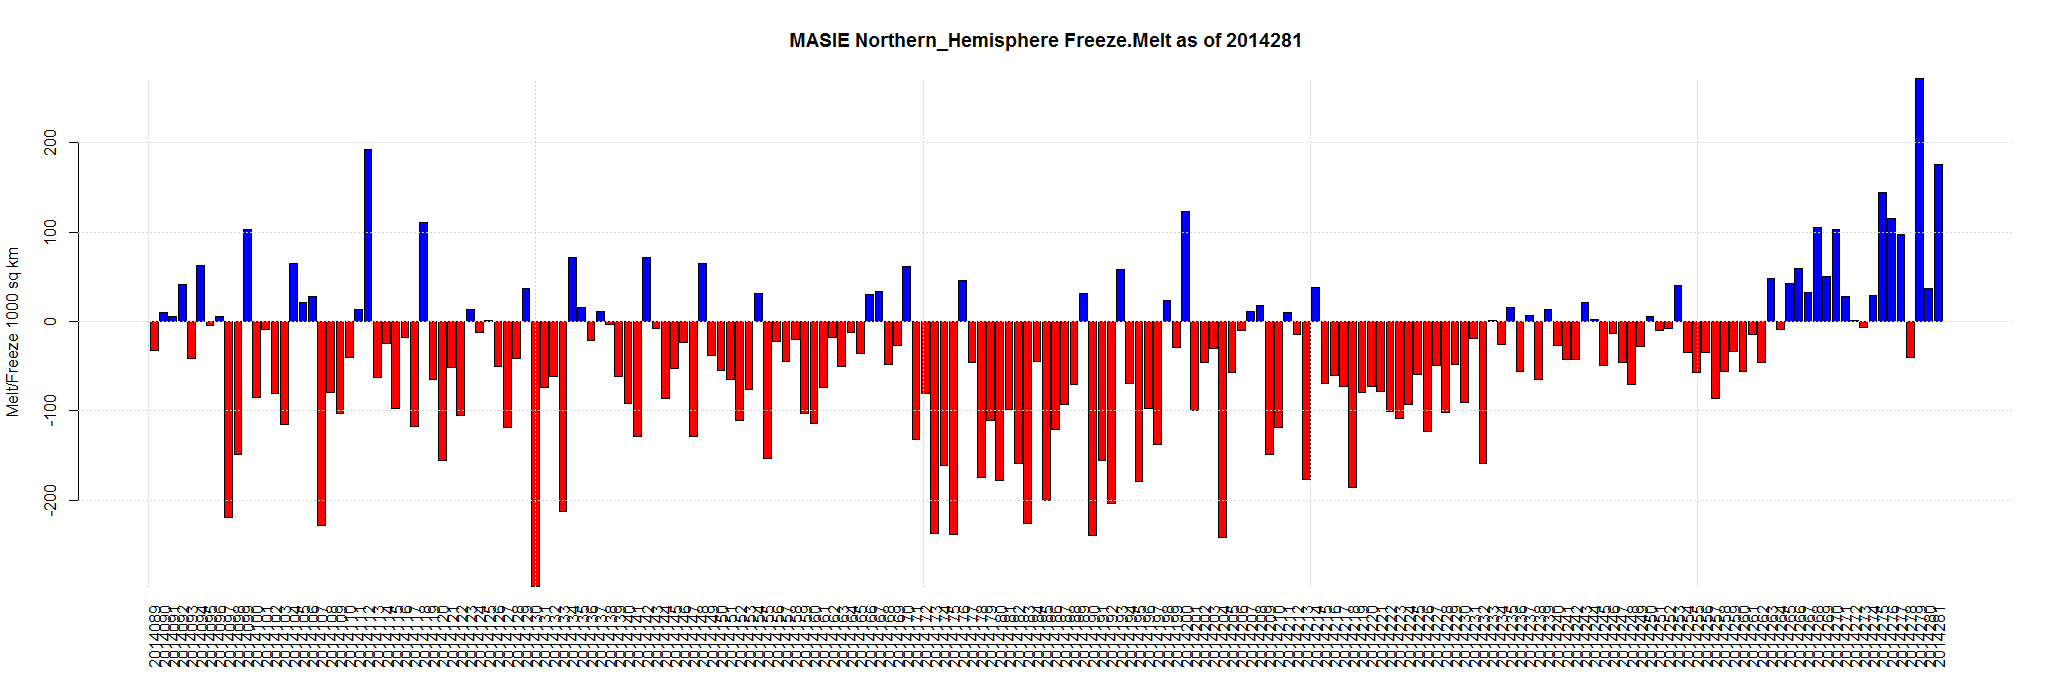
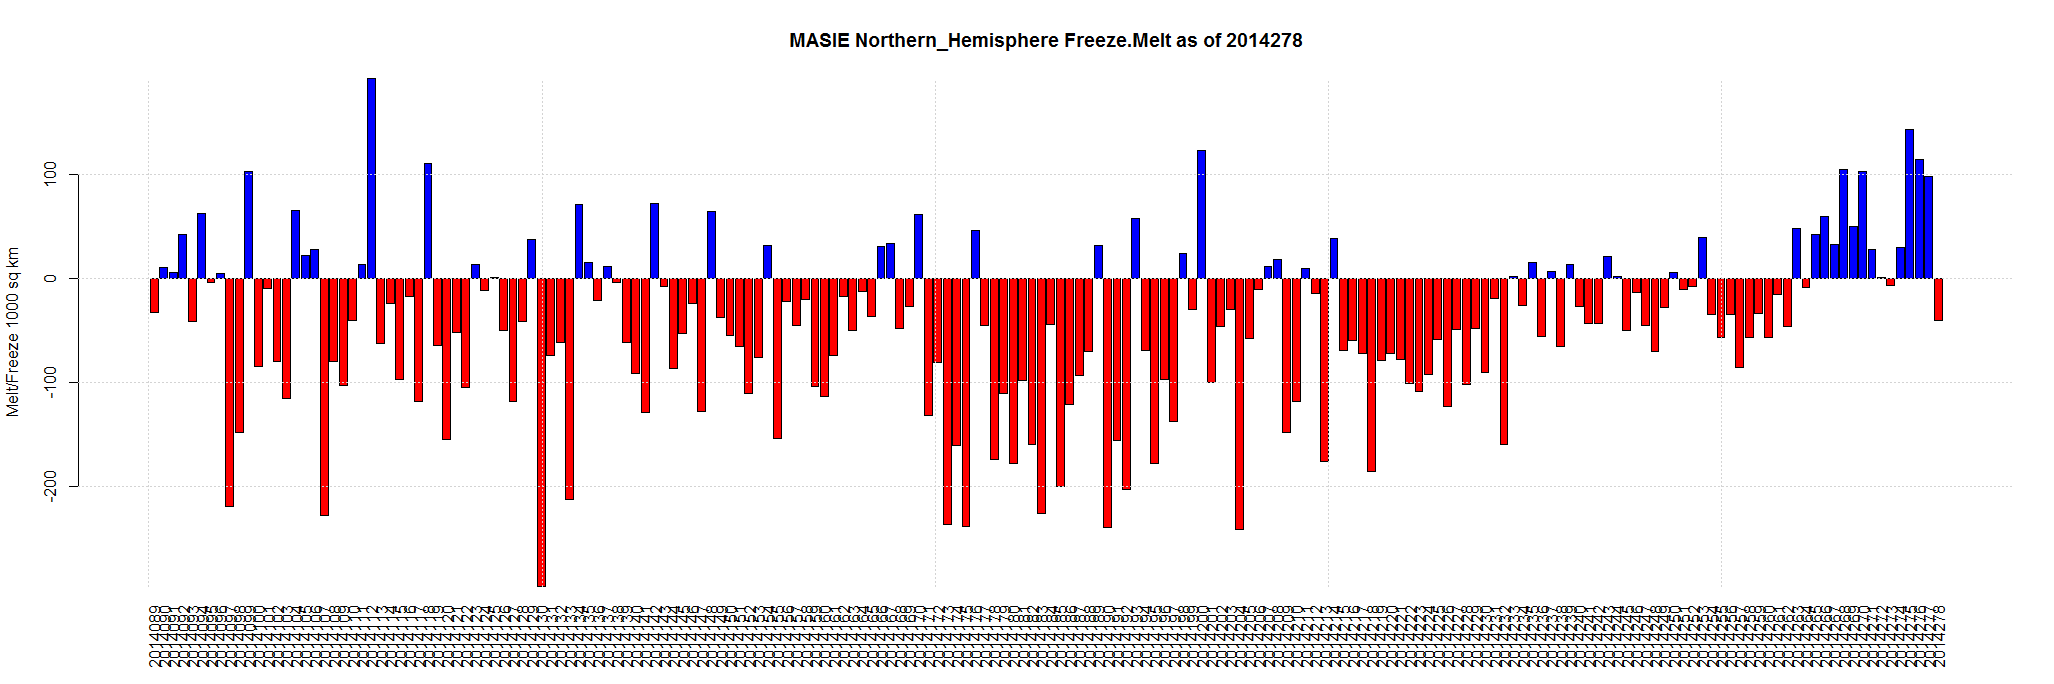
| Northern Hemisphere (Total) | 14,805,115 | 6,351,630 | -8,453,485 | 866,802 | 1,111,471 | 801,304 | 484,986 | 175,973 |
| NH (Average Loss per Day) | -43,575 | 30,957 | 79,391 | 114,472 | 161,662 | 175,973 |
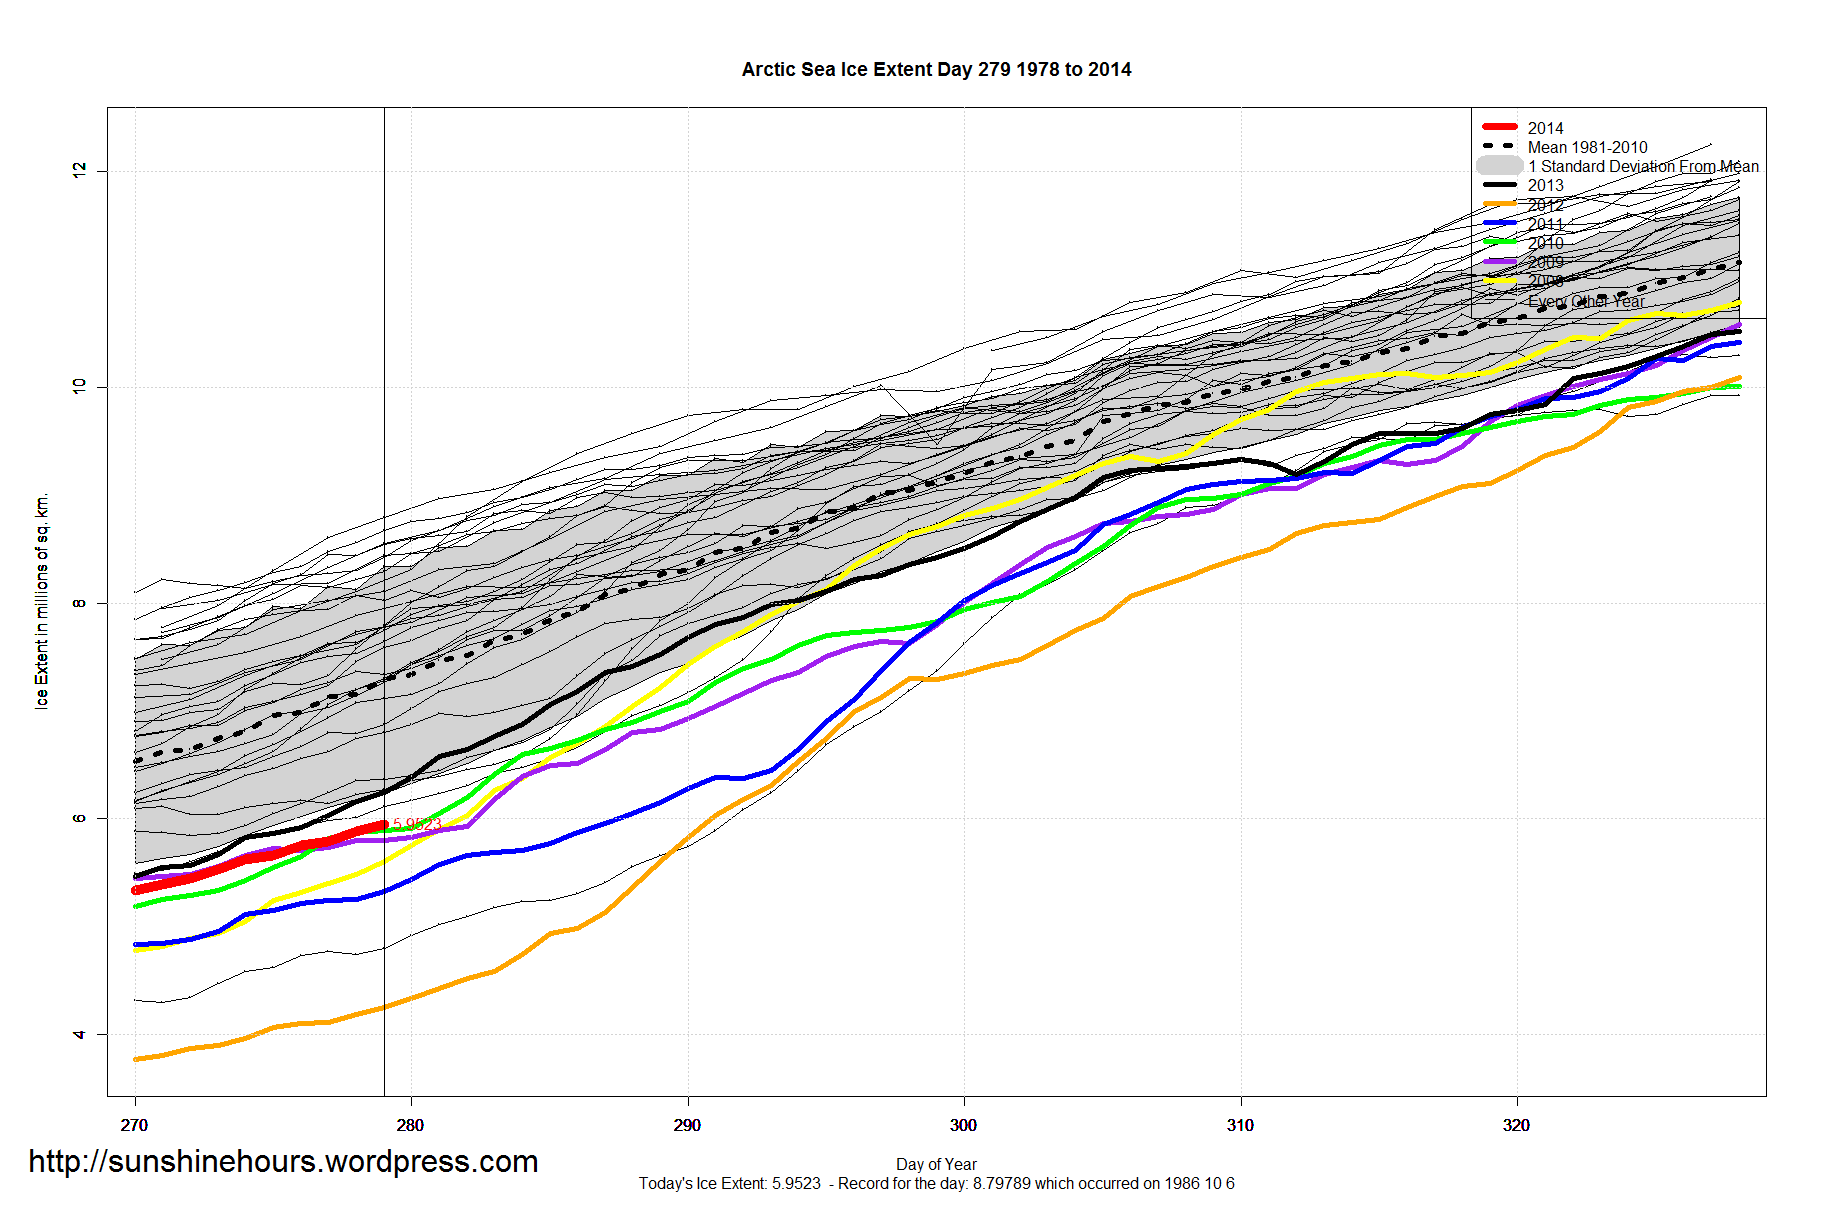
Sea Ice Extent – Day 281

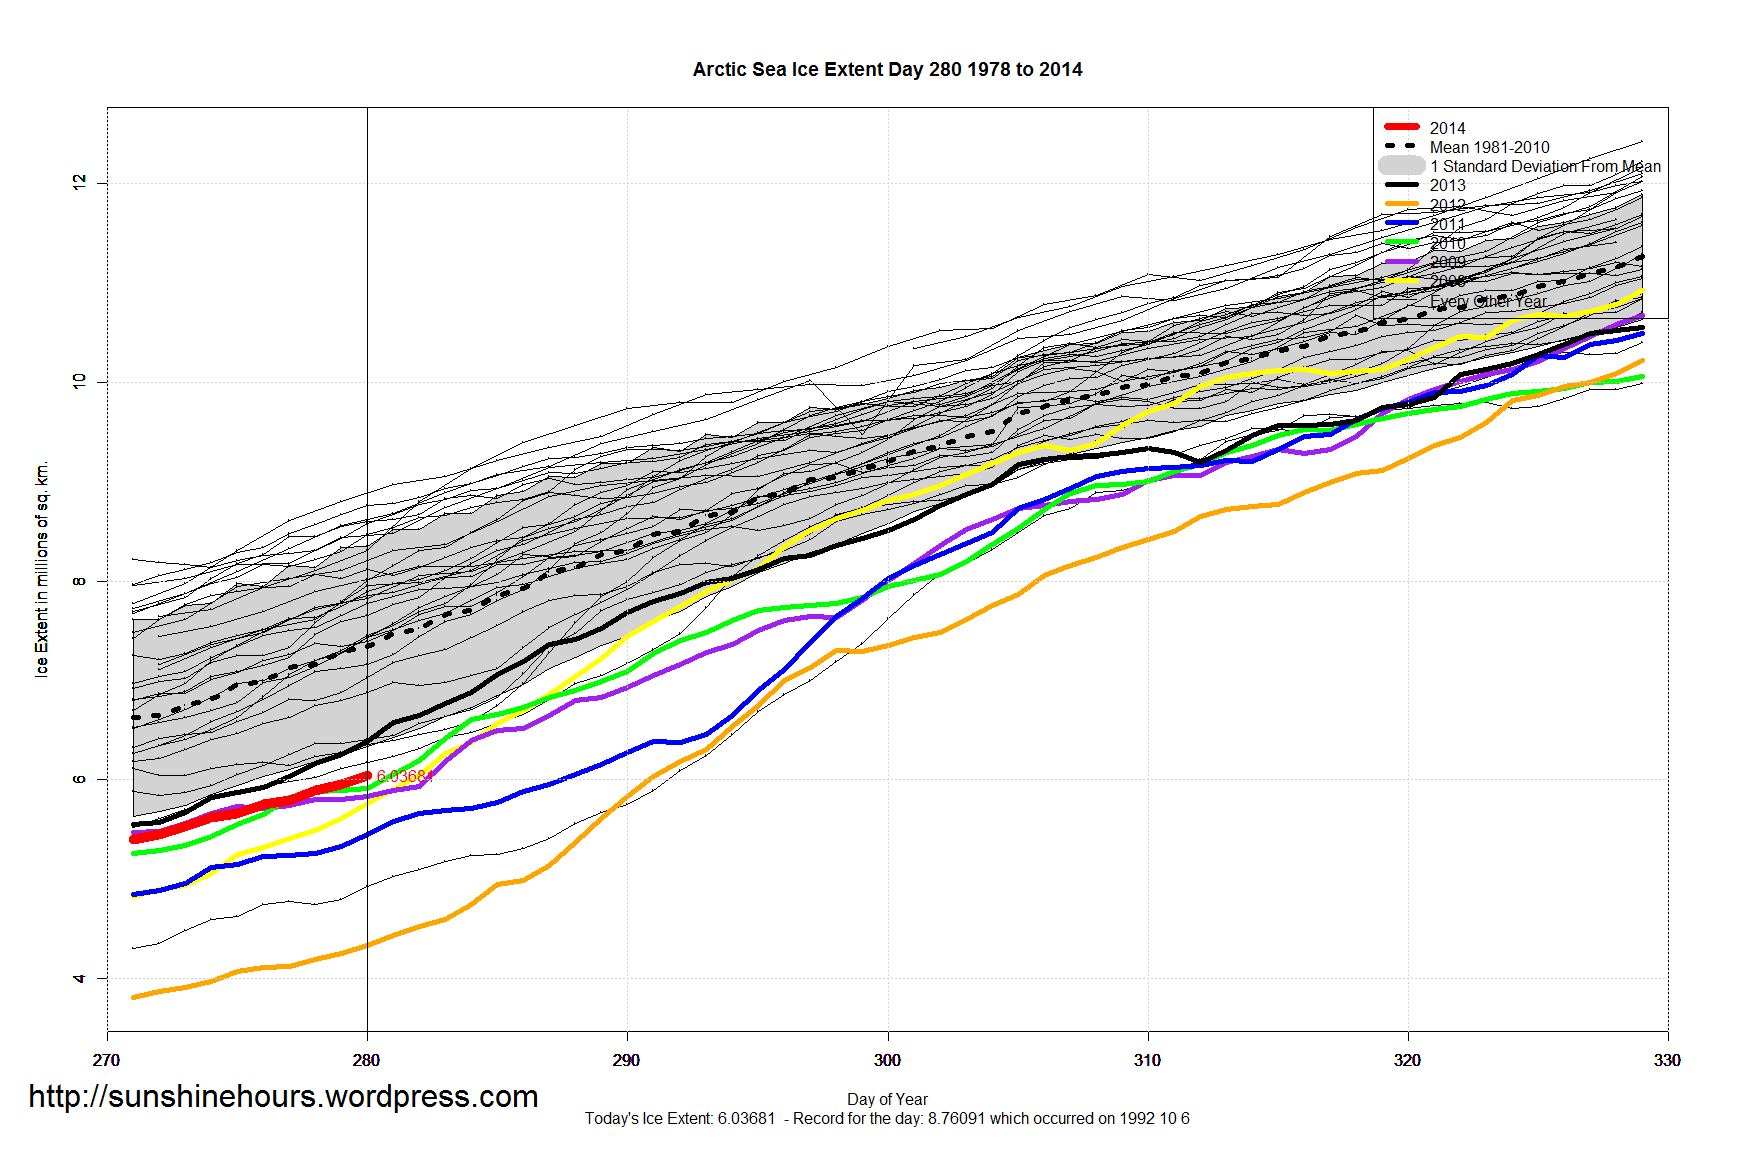
Sea Ice Extent – Day 280


Arctic Sea Ice Extent Oct 07 2014 – -1.3 million sq km below Normal – But 1.7 million above 2012
Arctic Sea Ice Extent Oct 07 2014 – -1,338,000 sq km below the 1981-2010 mean. Data for Day 279. Data here.

MASIE Arctic Oct 06 2014 – Melting?
Oct 06 2014 MASIE Update – Melting ?
Data here. Click for bigger.
| Region | 191 days ago | End | Last 190 | Last 28 | Last 14 | Last 7 | Last 3 | Last 1 |
| Greenland Sea | 603,416 | 276,254 | -327,162 | 95,204 | 34,372 | 14,936 | -24,807 | -20,089 |
| Beaufort Sea | 1,070,445 | 694,045 | -376,400 | -40,146 | 40,759 | -7,669 | 6,474 | -12,207 |
| Central Arctic | 3,221,921 | 3,110,698 | -111,223 | 141,898 | 176,868 | 49,648 | 49,401 | -7,506 |
| East Siberian Sea | 1,087,137 | 492,587 | -594,550 | -34,954 | 33,804 | 38,419 | 9,535 | -7,369 |
| Kara Sea | 933,859 | 117,348 | -816,512 | 21,132 | 53,418 | 45,452 | 36,854 | -3,257 |
| Laptev Sea | 897,845 | 37,106 | -860,739 | 31,021 | 36,020 | 25,057 | 15,250 | -2,012 |
| Canadian Archipelago | 853,214 | 621,274 | -231,941 | 117,499 | 237,178 | 89,042 | 29,440 | -88 |
| Baffin Bay Gulf of St. Lawrence | 1,688,530 | 49,269 | -1,639,262 | 31,259 | 31,620 | 18,467 | -191 | 0 |
| Hudson Bay | 1,260,903 | 10,375 | -1,250,528 | -9,974 | 9,513 | 8,927 | 0 | 0 |
| Bering Sea | 697,324 | 0 | -697,324 | 0 | 0 | 0 | 0 | 0 |
| Baltic Sea | 15,337 | 0 | -15,337 | 0 | 0 | 0 | 0 | 0 |
| Sea of Okhotsk | 853,240 | 0 | -853,240 | 0 | 0 | 0 | 0 | 0 |
| Yellow Sea | 0 | 0 | 0 | 0 | 0 | 0 | 0 | 0 |
| Barents Sea | 645,917 | 163,670 | -482,247 | 38,971 | 30,634 | 46,750 | 22,670 | 5,113 |
| Chukchi Sea | 966,006 | 292,878 | -673,128 | 11,347 | 77,123 | 11,356 | 27,743 | 7,105 |
| Northern Hemisphere (Total) | 14,805,115 | 5,866,644 | -8,938,470 | 403,256 | 761,308 | 340,385 | 172,369 | -40,310 |
| NH (Average Loss per Day) | -46,798 | 14,402 | 54,379 | 48,626 | 57,456 | -40,310 |
MASIE Arctic Oct 04 2014 – No Melting Anywhere
Oct 04 2014 MASIE Update – No Melting Anywhere
Data here. Click for bigger.
As comment Dave in Canmore notes, this is the first day all of the regions are up (except for the ones at 0).
| Region | 189 days ago | End | Last 188 | Last 28 | Last 14 | Last 7 | Last 3 | Last 1 |
| Hudson Bay | 1,260,903 | 10,375 | -1,250,528 | -13,176 | 9,513 | 8,927 | 0 | 0 |
| Bering Sea | 697,324 | 0 | -697,324 | 0 | 0 | 0 | 0 | 0 |
| Baltic Sea | 15,337 | 0 | -15,337 | 0 | 0 | 0 | 0 | 0 |
| Sea of Okhotsk | 853,240 | 0 | -853,240 | 0 | 0 | 0 | 0 | 0 |
| Yellow Sea | 0 | 0 | 0 | 0 | 0 | 0 | 0 | 0 |
| Baffin Bay Gulf of St. Lawrence | 1,688,530 | 50,785 | -1,637,745 | 35,634 | 32,541 | 25,251 | -2,997 | 1,325 |
| Greenland Sea | 603,416 | 302,816 | -300,600 | 101,357 | 92,626 | 45,492 | 38,128 | 1,755 |
| East Siberian Sea | 1,087,137 | 487,217 | -599,920 | -68,366 | 31,385 | 12,646 | 5,342 | 4,165 |
| Kara Sea | 933,859 | 88,498 | -845,361 | -12,626 | 24,243 | 16,051 | 23,380 | 8,005 |
| Beaufort Sea | 1,070,445 | 696,067 | -374,378 | -19,420 | 40,531 | 1,275 | 23,282 | 8,497 |
| Chukchi Sea | 966,006 | 274,037 | -691,969 | -10,164 | 38,916 | -4,584 | 40,903 | 8,902 |
| Barents Sea | 645,917 | 153,070 | -492,847 | 31,863 | 20,329 | 27,990 | 22,167 | 12,070 |
| Laptev Sea | 897,845 | 38,336 | -859,509 | 31,925 | 37,124 | 36,988 | 32,467 | 16,480 |
| Canadian Archipelago | 853,214 | 615,102 | -238,112 | 127,965 | 273,480 | 198,622 | 31,261 | 23,269 |
| Central Arctic | 3,221,921 | 3,091,693 | -130,228 | 118,461 | 142,319 | 44,468 | 74,519 | 30,396 |
| Northern Hemisphere (Total) | 14,805,115 | 5,809,140 | -8,995,975 | 323,454 | 743,006 | 413,126 | 288,452 | 114,865 |
| NH (Average Loss per Day) | -47,598 | 11,552 | 53,072 | 59,018 | 96,151 | 114,865 |
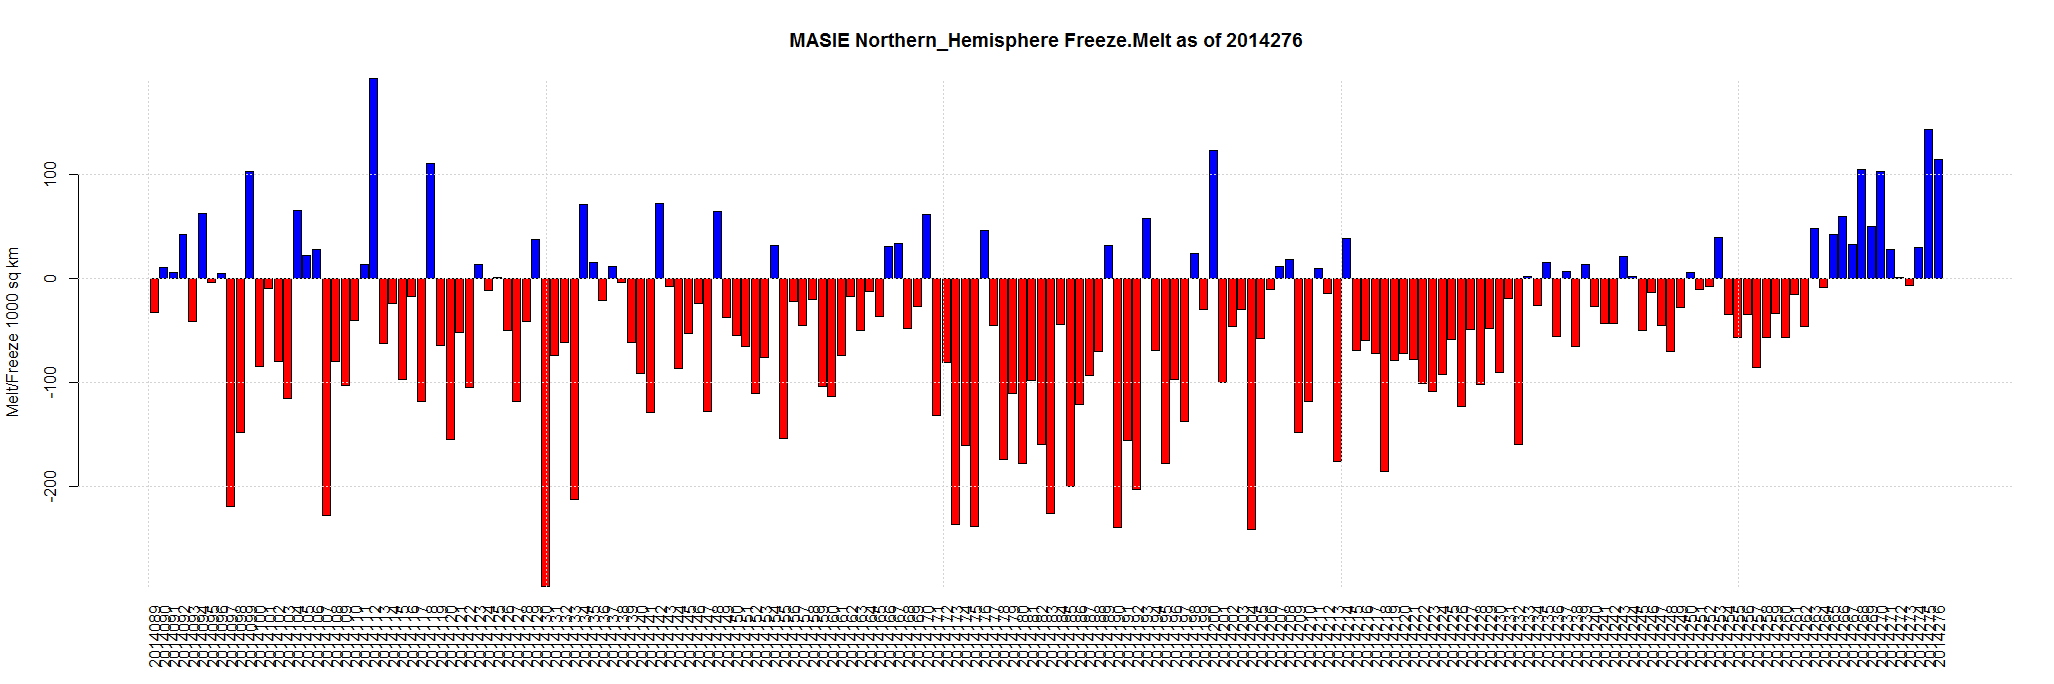
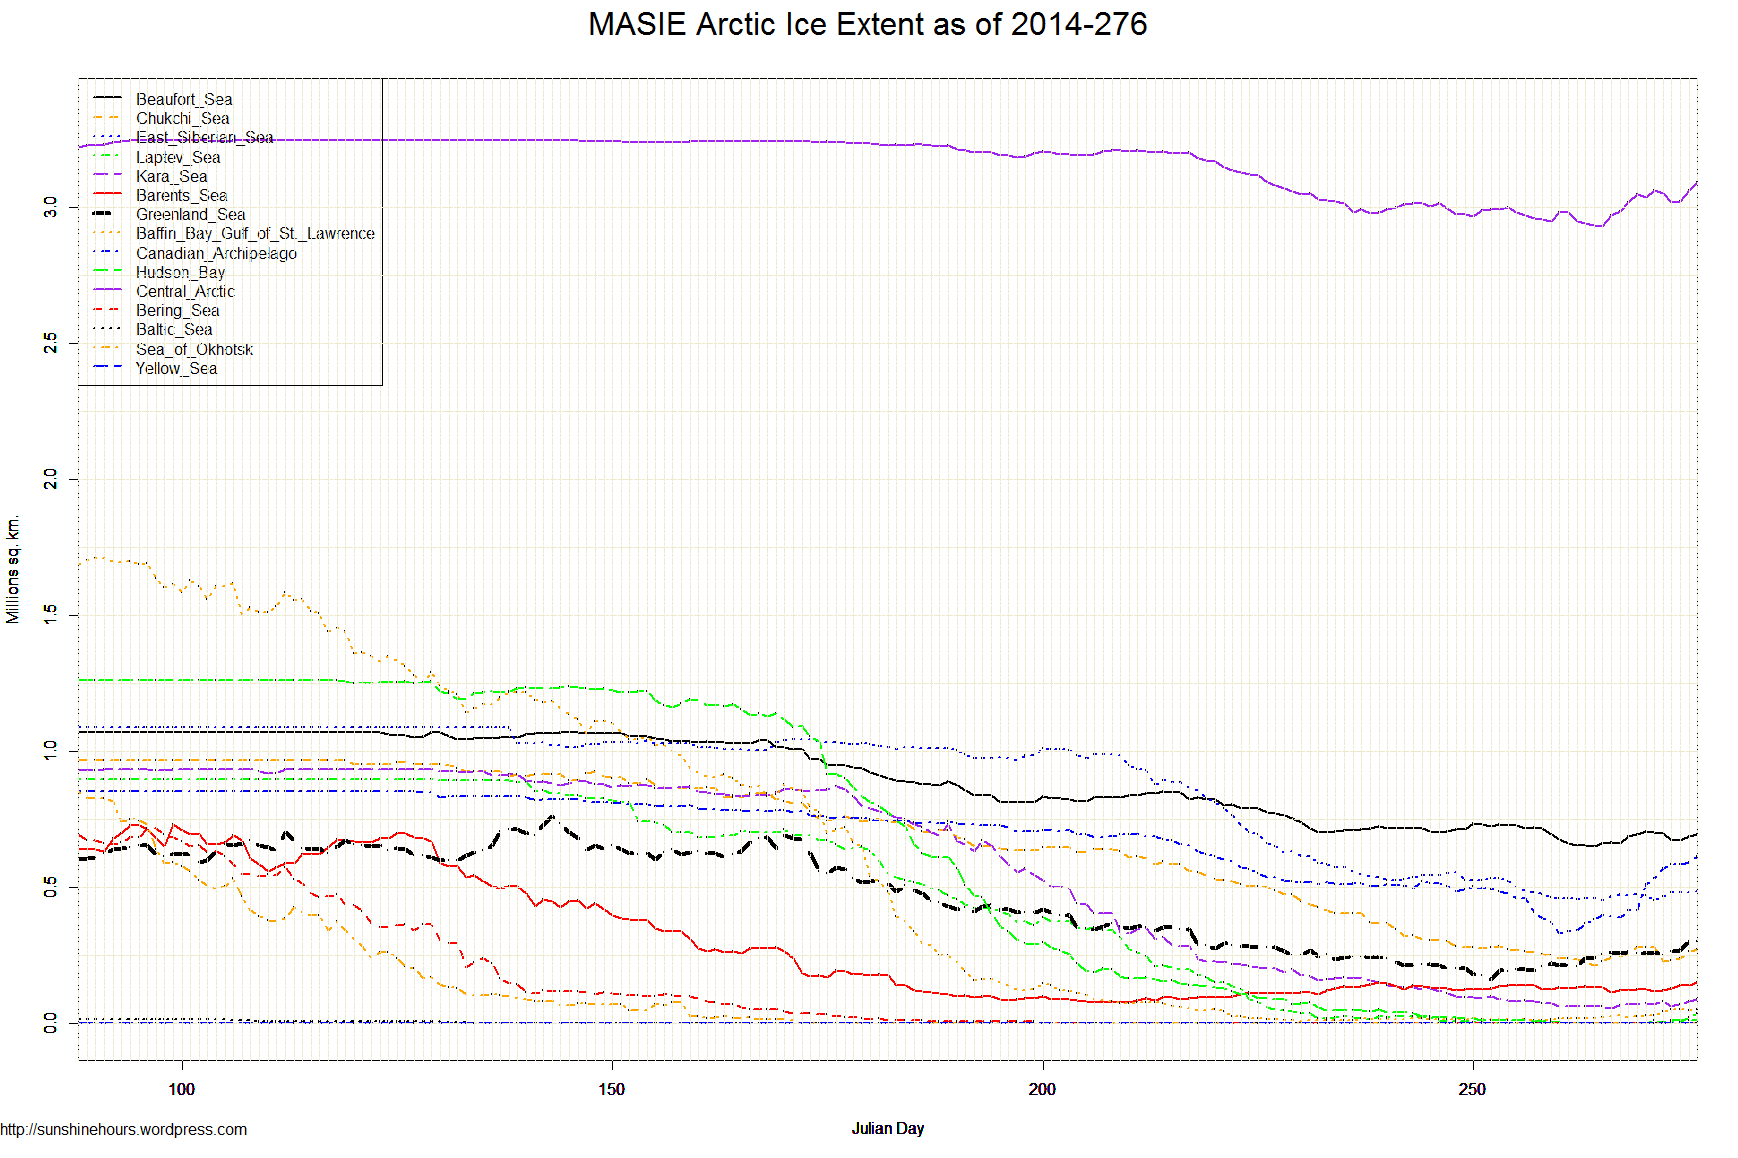
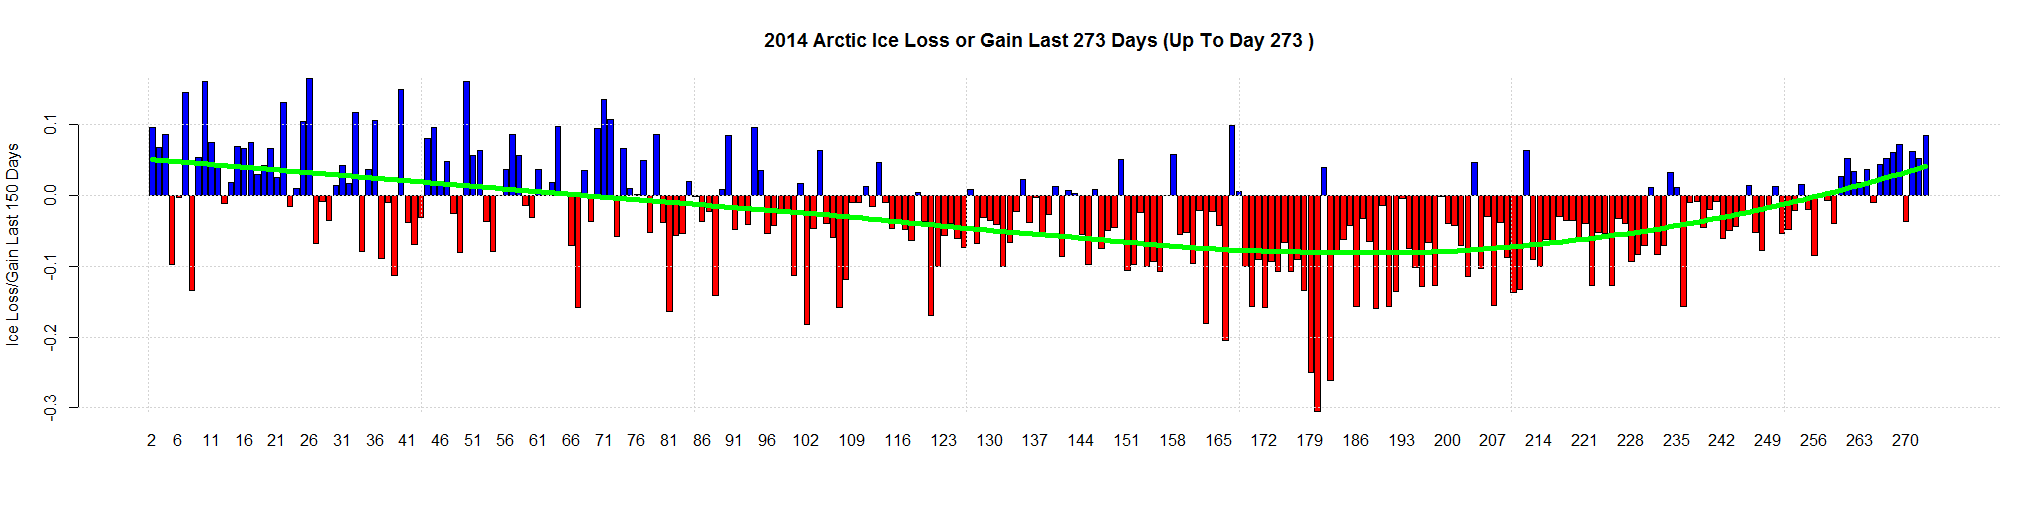
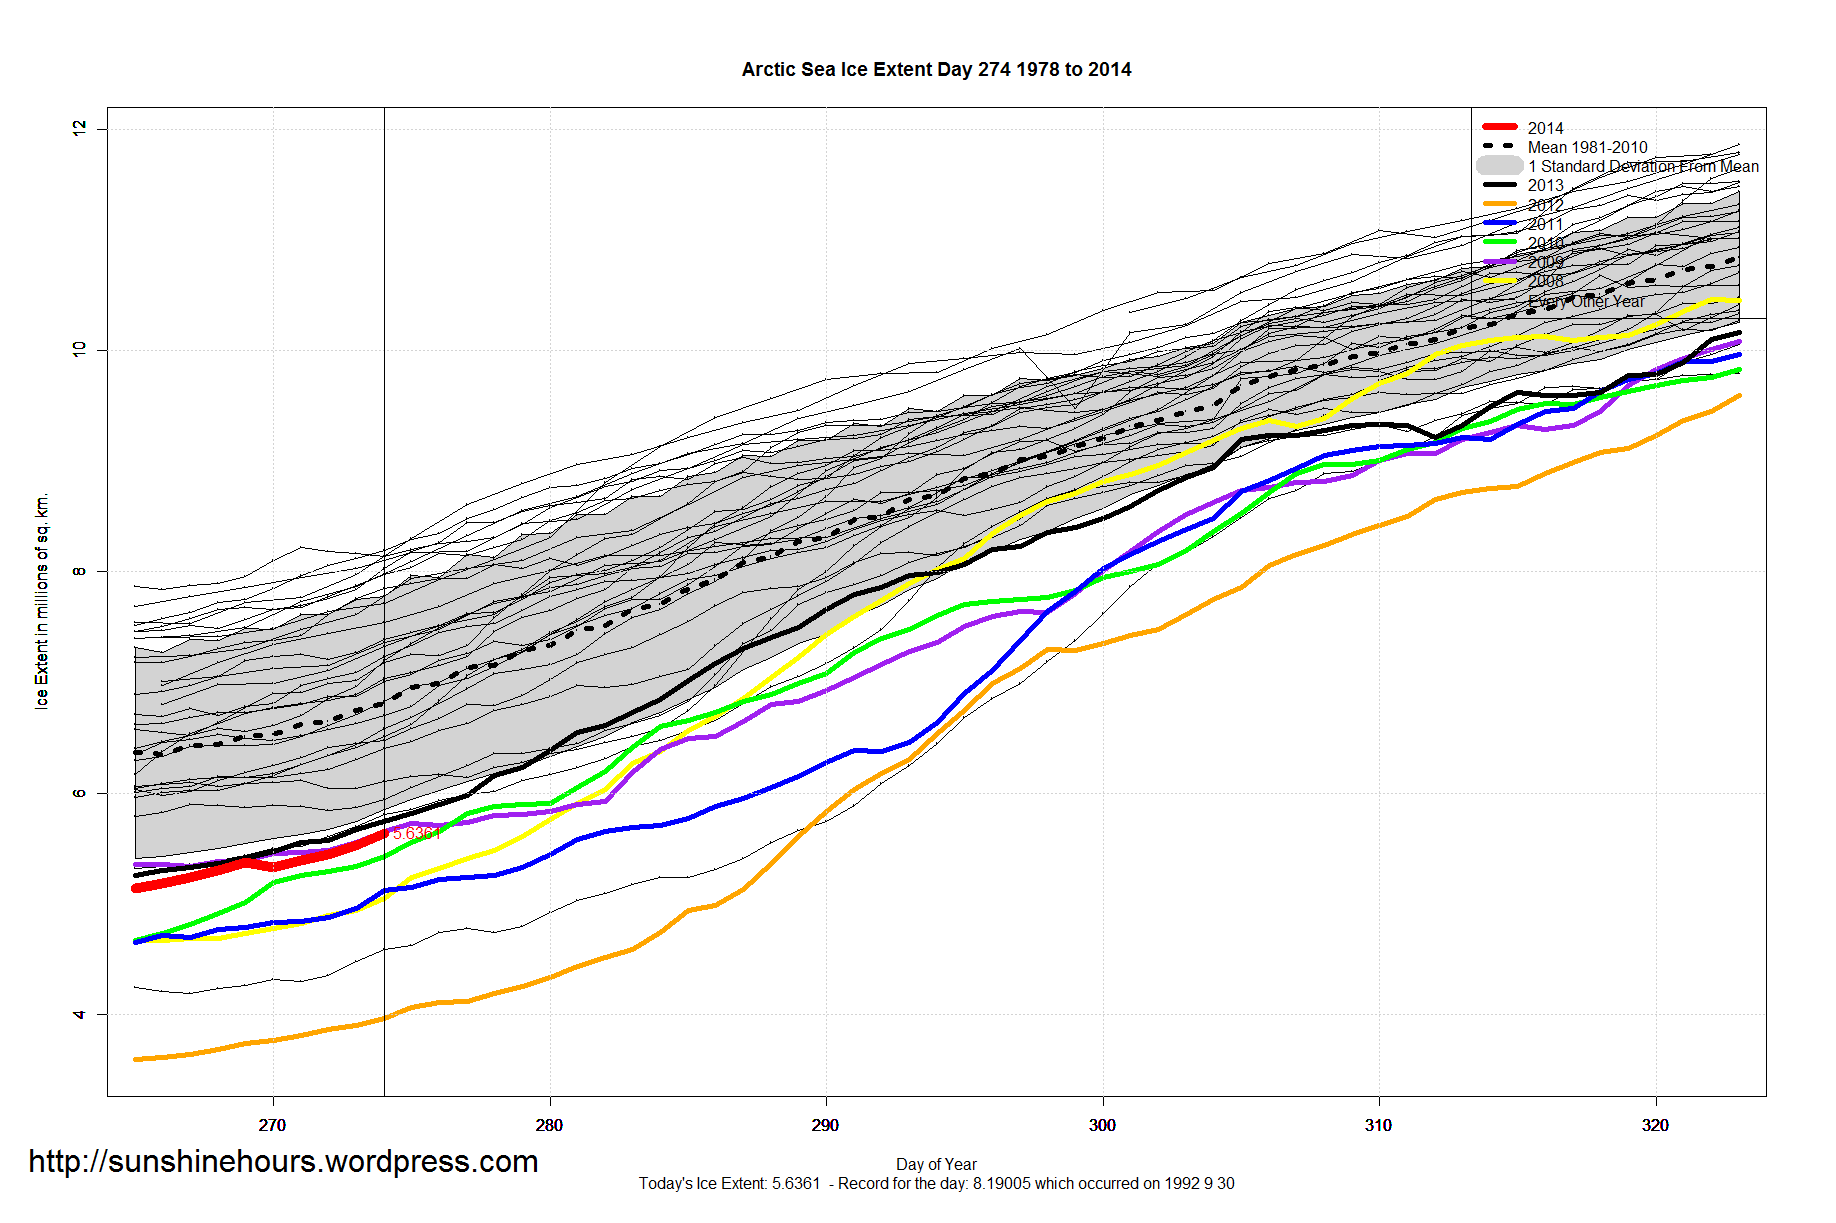
Sea Ice Extent – Day 274
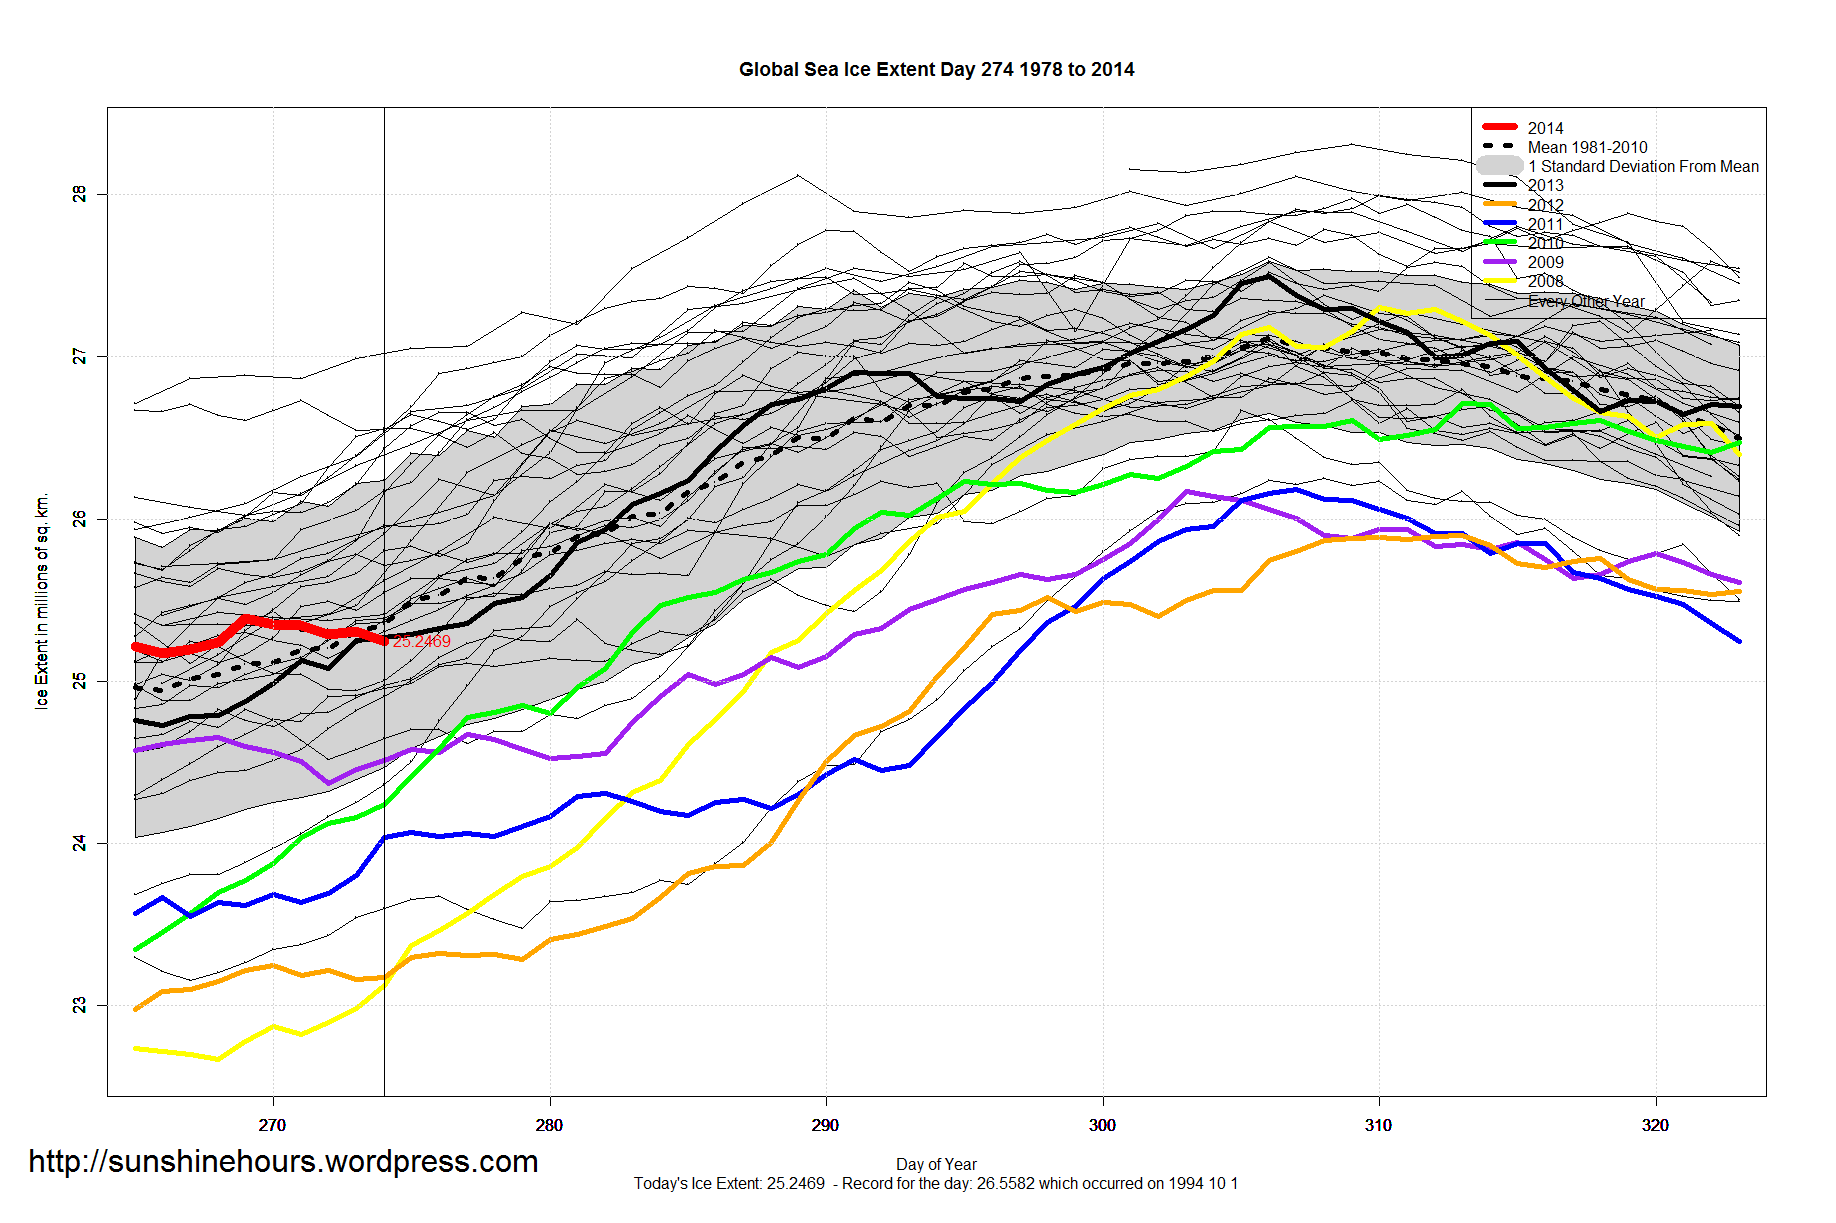
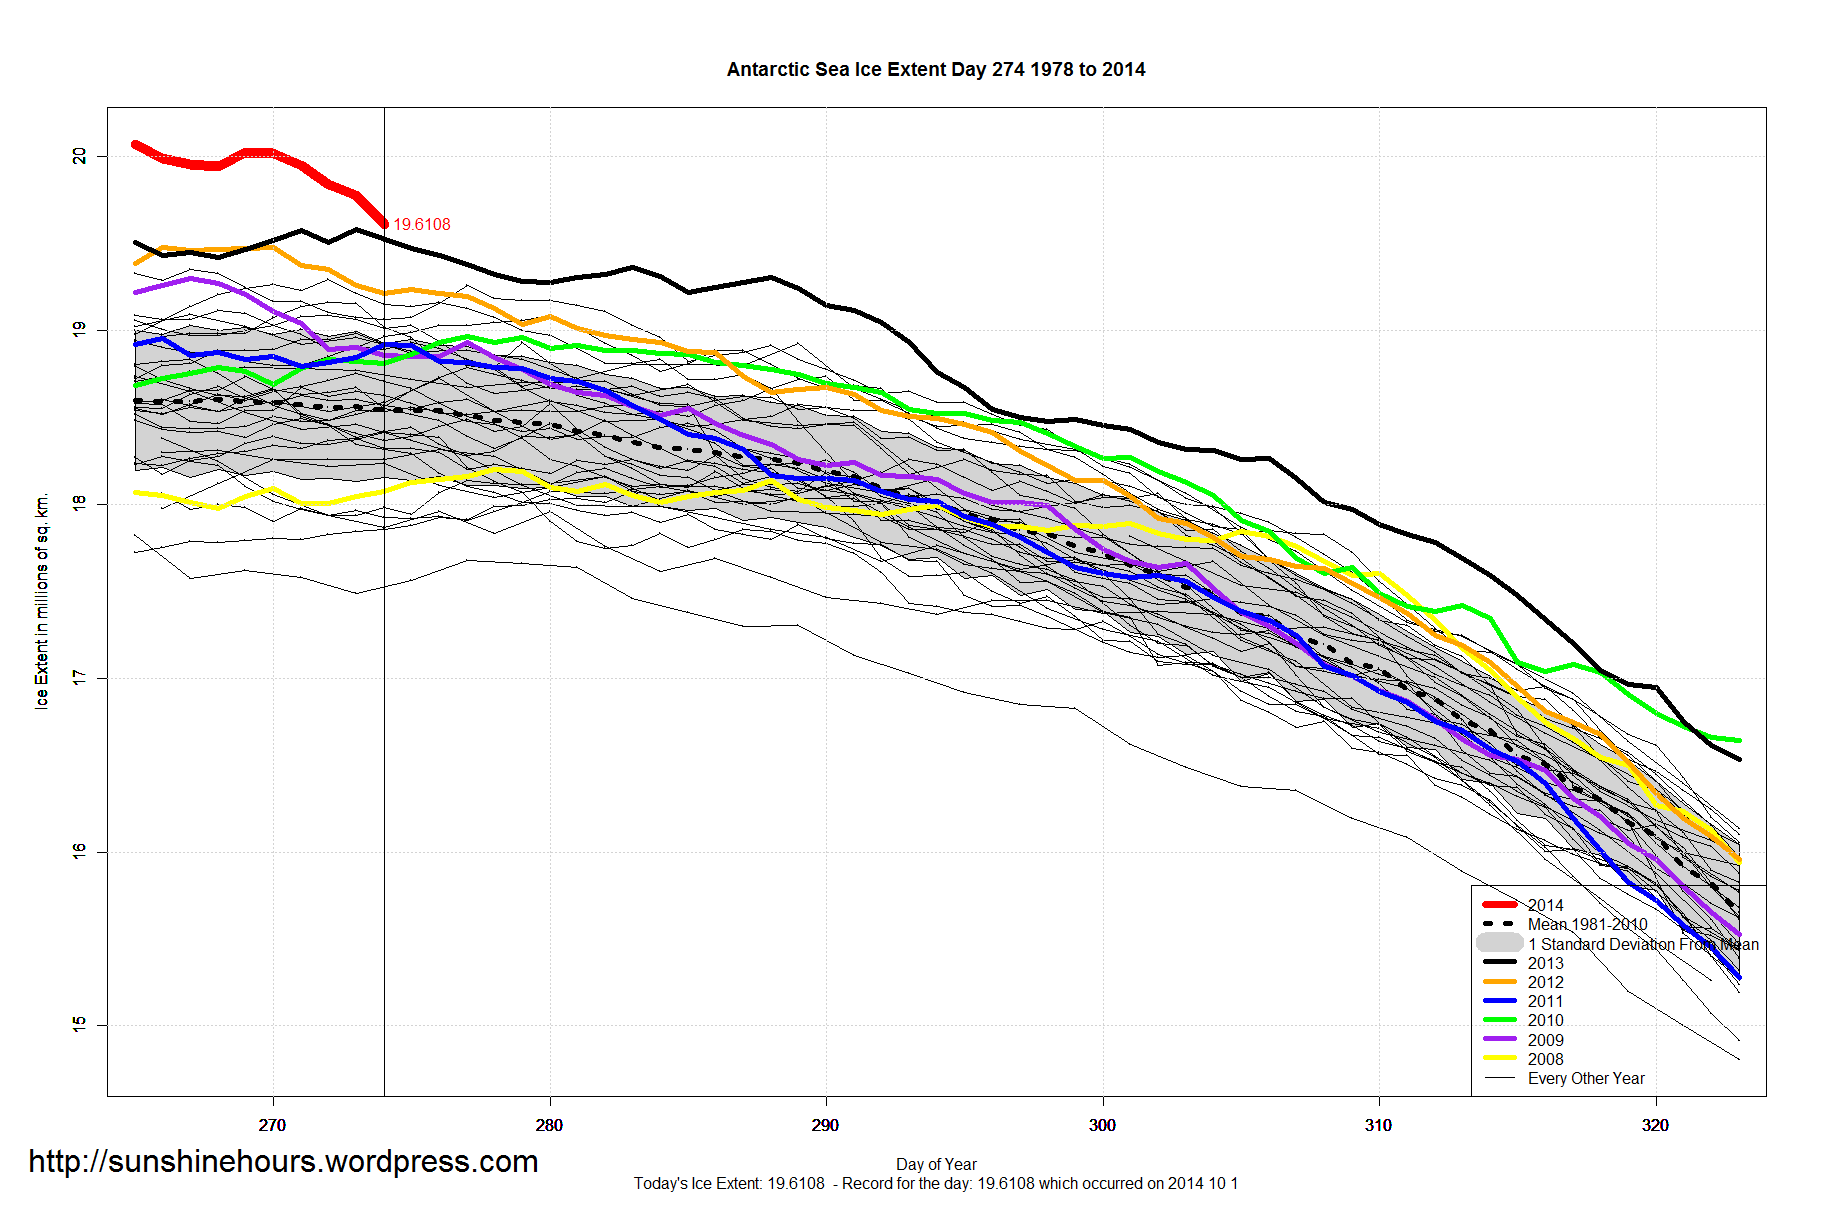
Arctic Sea Ice Extent Oct 01 2014 – Gain/Loss For 2014
Arctic Sea Ice Extent Oct 01 2014 – -1,218,000 sq km below the 1981-2010 mean. Data for Day 273. Data here.