Arctic Sea Ice Extent Sep 02 2014 – -985,000 sq km below the 1981-2010 mean. Data for Day 244. Data here.
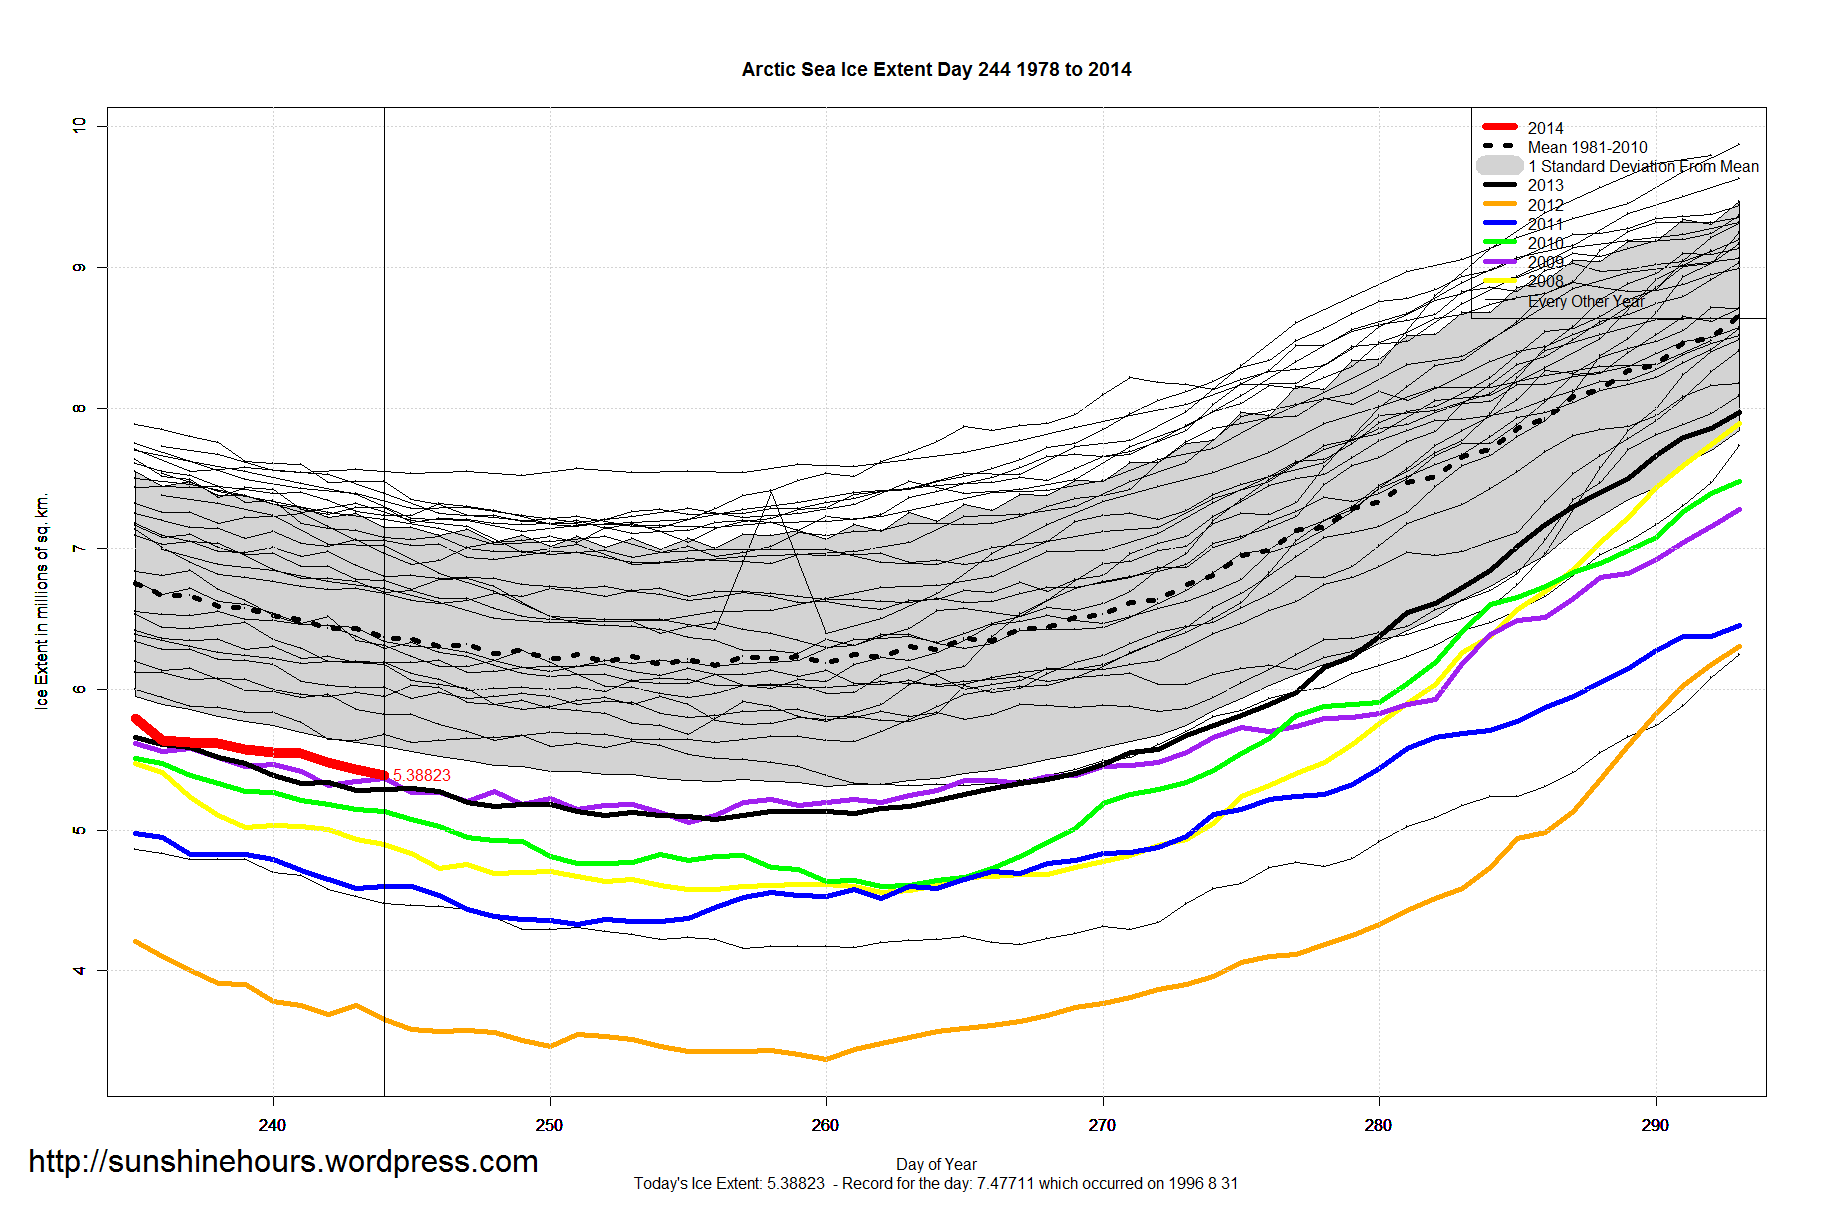

Arctic Sea Ice Extent Sep 02 2014 – -985,000 sq km below the 1981-2010 mean. Data for Day 244. Data here.
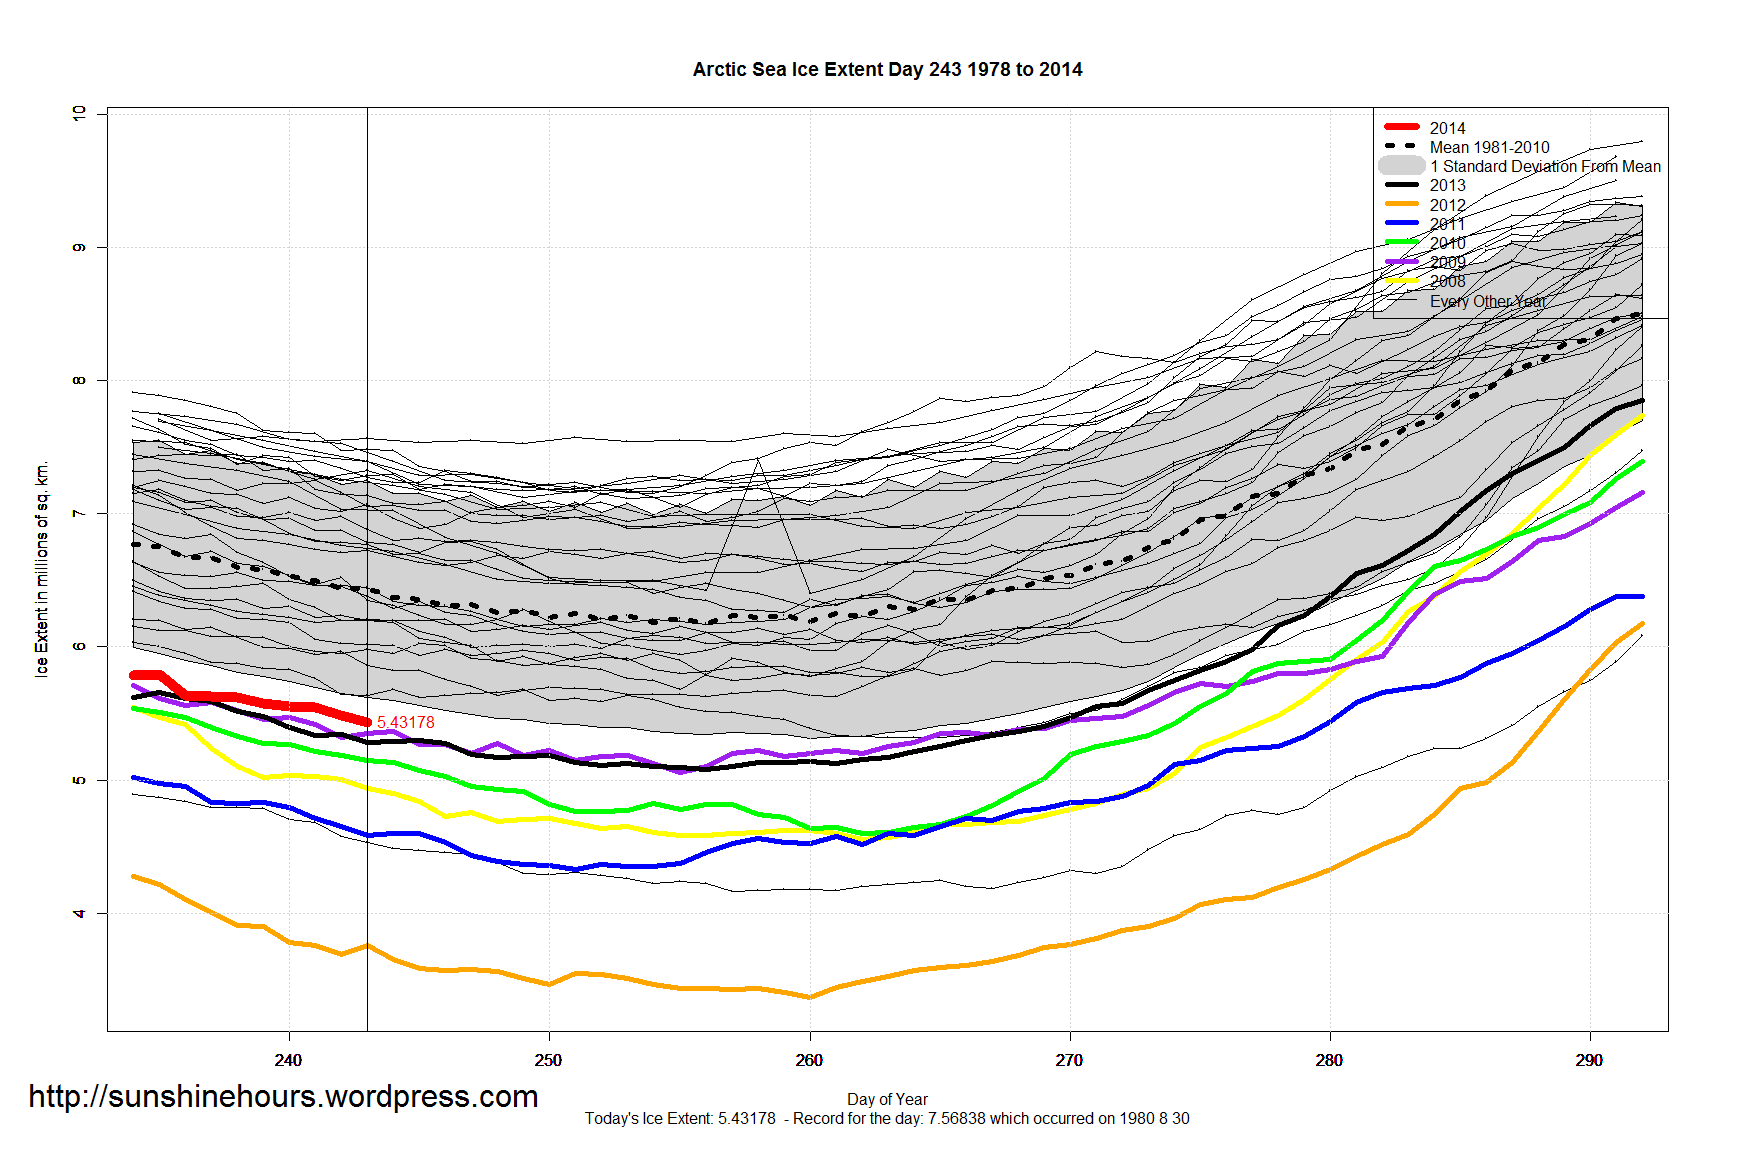
Arctic Sea Ice Extent Sep 01 2014 – -1,005,000 sq km below the 1981-2010 mean. Data for Day 243. Data here.
1.7 million sq km higher than 2012 for the same day. 1 million higher than 2011. 1 million higher than 2007 … etc etc

Aug 31 2014 MASIE Update – The data for day 241 us missing because of the data glitch on 30-Aug-2014. I have infilled with a guess using the formula (Day 240 + Day 242) / 2
Data here. Click for bigger.


| Region | 155 days ago | End | Last 154 | Last 28 | Last 14 | Last 7 | Last 3 | Last 1 |
| Chukchi Sea | 966,006 | 322,273 | -643,733 | -273,253 | -152,628 | -82,580 | -47,546 | -23,560 |
| Greenland Sea | 603,416 | 214,362 | -389,053 | -137,668 | -52,481 | -30,460 | -28,937 | -11,800 |
| Barents Sea | 645,917 | 125,481 | -520,436 | 30,863 | 12,611 | -11,729 | -26,084 | -10,339 |
| Kara Sea | 933,859 | 132,148 | -801,711 | -183,939 | -54,982 | -37,843 | -18,547 | -4,706 |
| Canadian Archipelago | 853,214 | 505,283 | -347,932 | -172,939 | -22,496 | -6,741 | -269 | -3,843 |
| Beaufort Sea | 1,070,445 | 717,347 | -353,098 | -136,302 | -46,463 | 6,076 | -5,861 | -972 |
| Hudson Bay | 1,260,903 | 41,866 | -1,219,037 | -113,002 | -45,855 | -8,017 | -9,579 | -397 |
| Bering Sea | 697,324 | 0 | -697,324 | 0 | 0 | 0 | 0 | 0 |
| Baltic Sea | 15,337 | 0 | -15,337 | 0 | 0 | 0 | 0 | 0 |
| Sea of Okhotsk | 853,240 | 0 | -853,240 | 0 | 0 | 0 | 0 | 0 |
| Yellow Sea | 0 | 0 | 0 | 0 | 0 | 0 | 0 | 0 |
| Baffin Bay Gulf of St. Lawrence | 1,688,530 | 14,462 | -1,674,068 | -58,086 | 1,865 | 4,220 | 18 | 9 |
| East Siberian Sea | 1,087,137 | 528,474 | -558,664 | -367,032 | -100,198 | -45,079 | -7,241 | 971 |
| Laptev Sea | 897,845 | 27,175 | -870,670 | -185,864 | -21,211 | 1,962 | 2,048 | 2,018 |
| Central Arctic | 3,221,921 | 3,010,793 | -211,128 | -194,195 | -58,087 | -3,742 | 29,060 | 9,700 |
| Northern Hemisphere (Total) | 14,805,115 | 5,640,806 | -9,164,308 | -1,791,416 | -539,924 | -213,934 | -112,939 | -42,919 |
| NH (Average Loss per Day) | -59,125 | -63,979 | -38,566 | -30,562 | -37,646 | -42,919 |
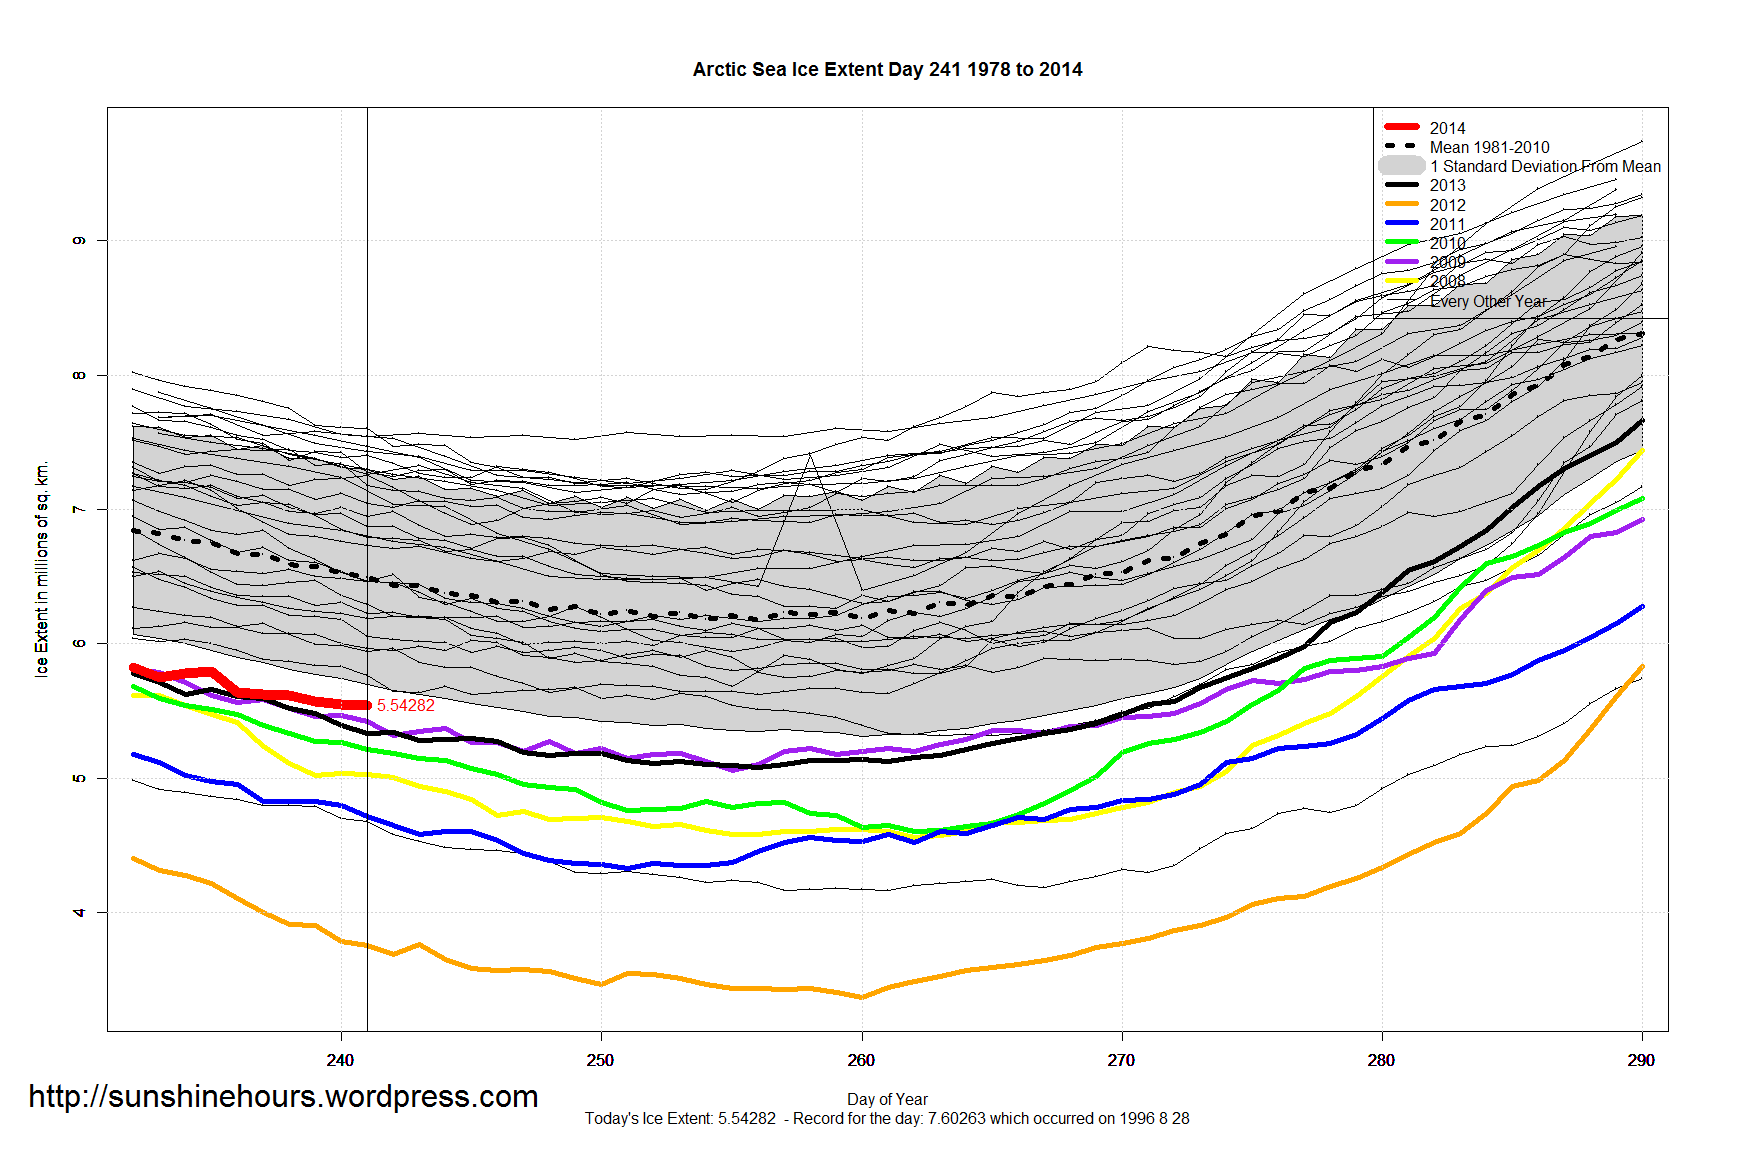
Arctic Sea Ice Extent Aug 30 2014 – -1,022,000 sq km below the 1981-2010 mean. Data for Day 241. Data here.

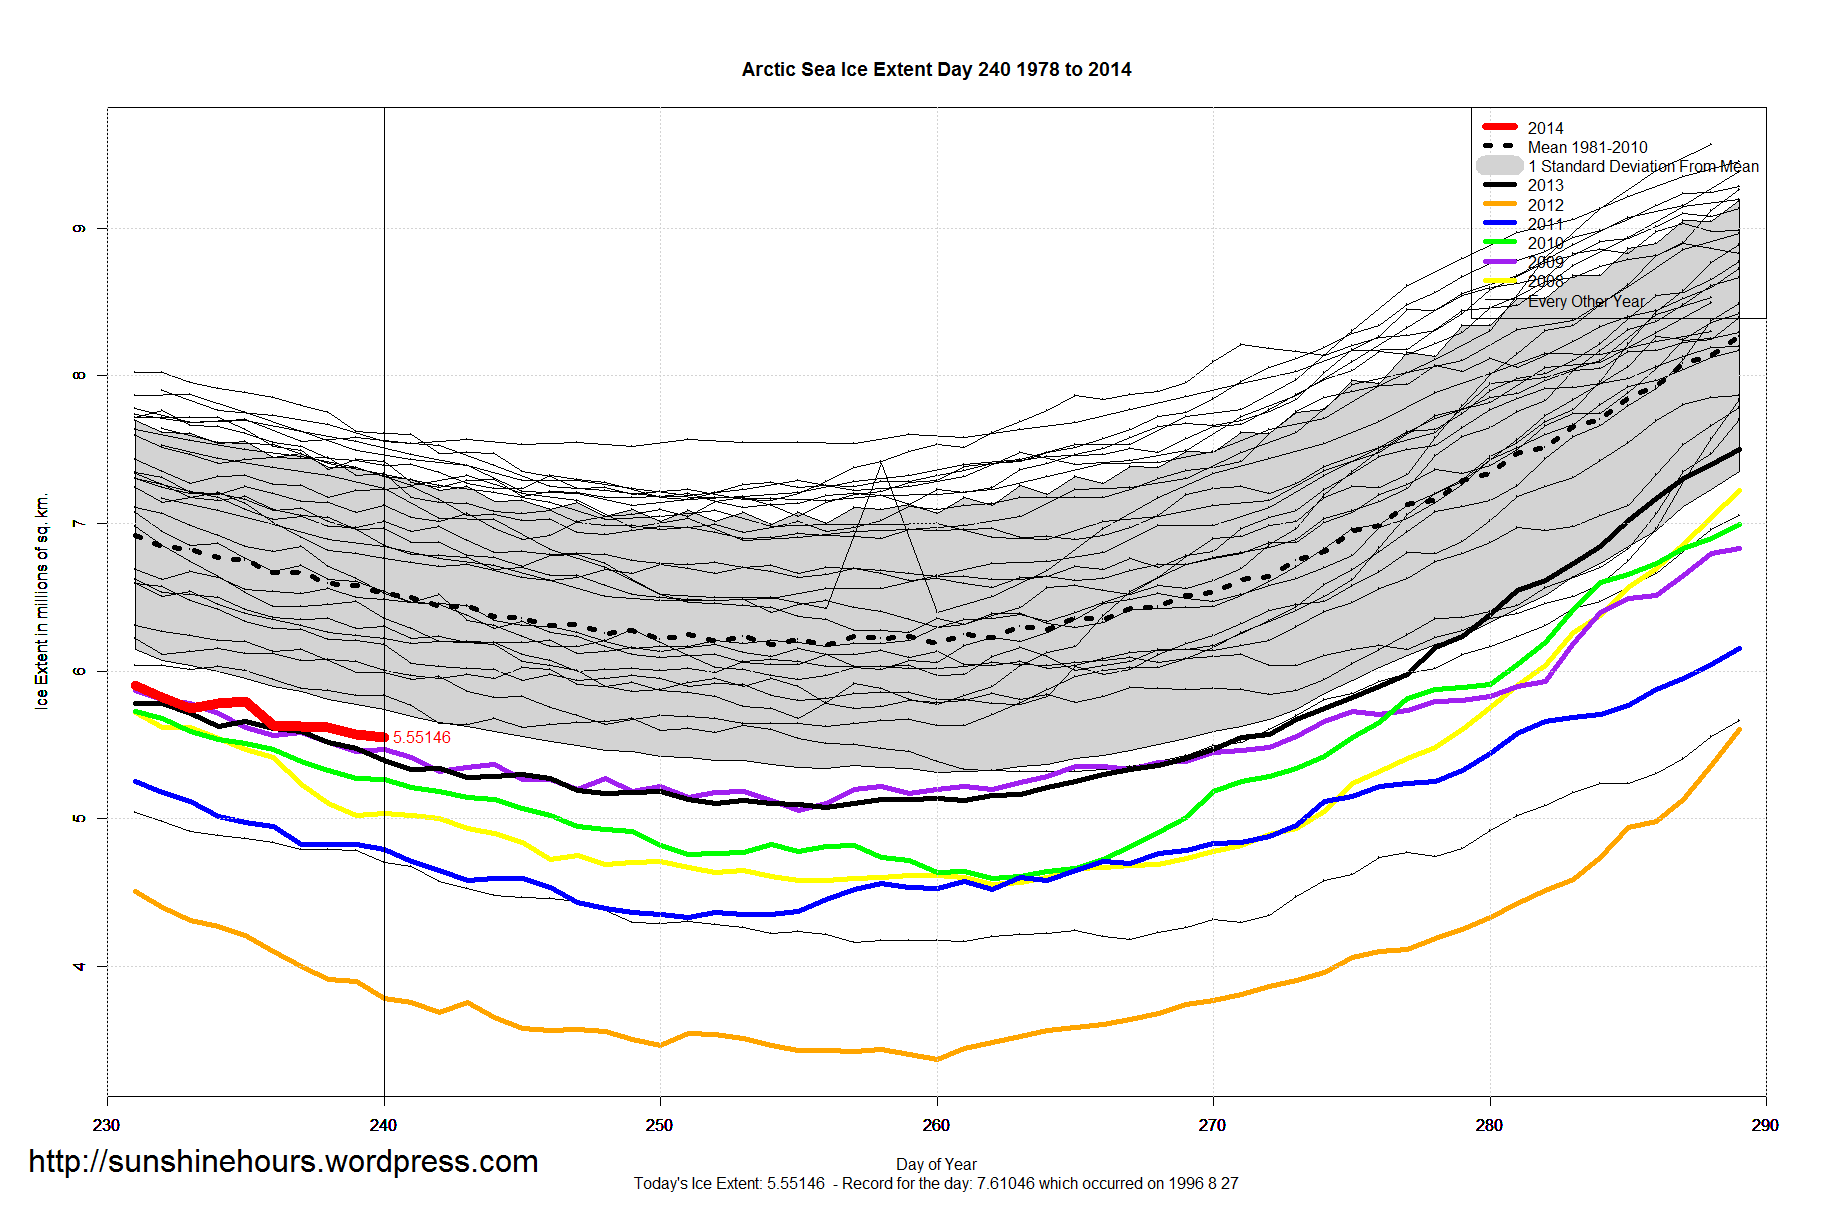
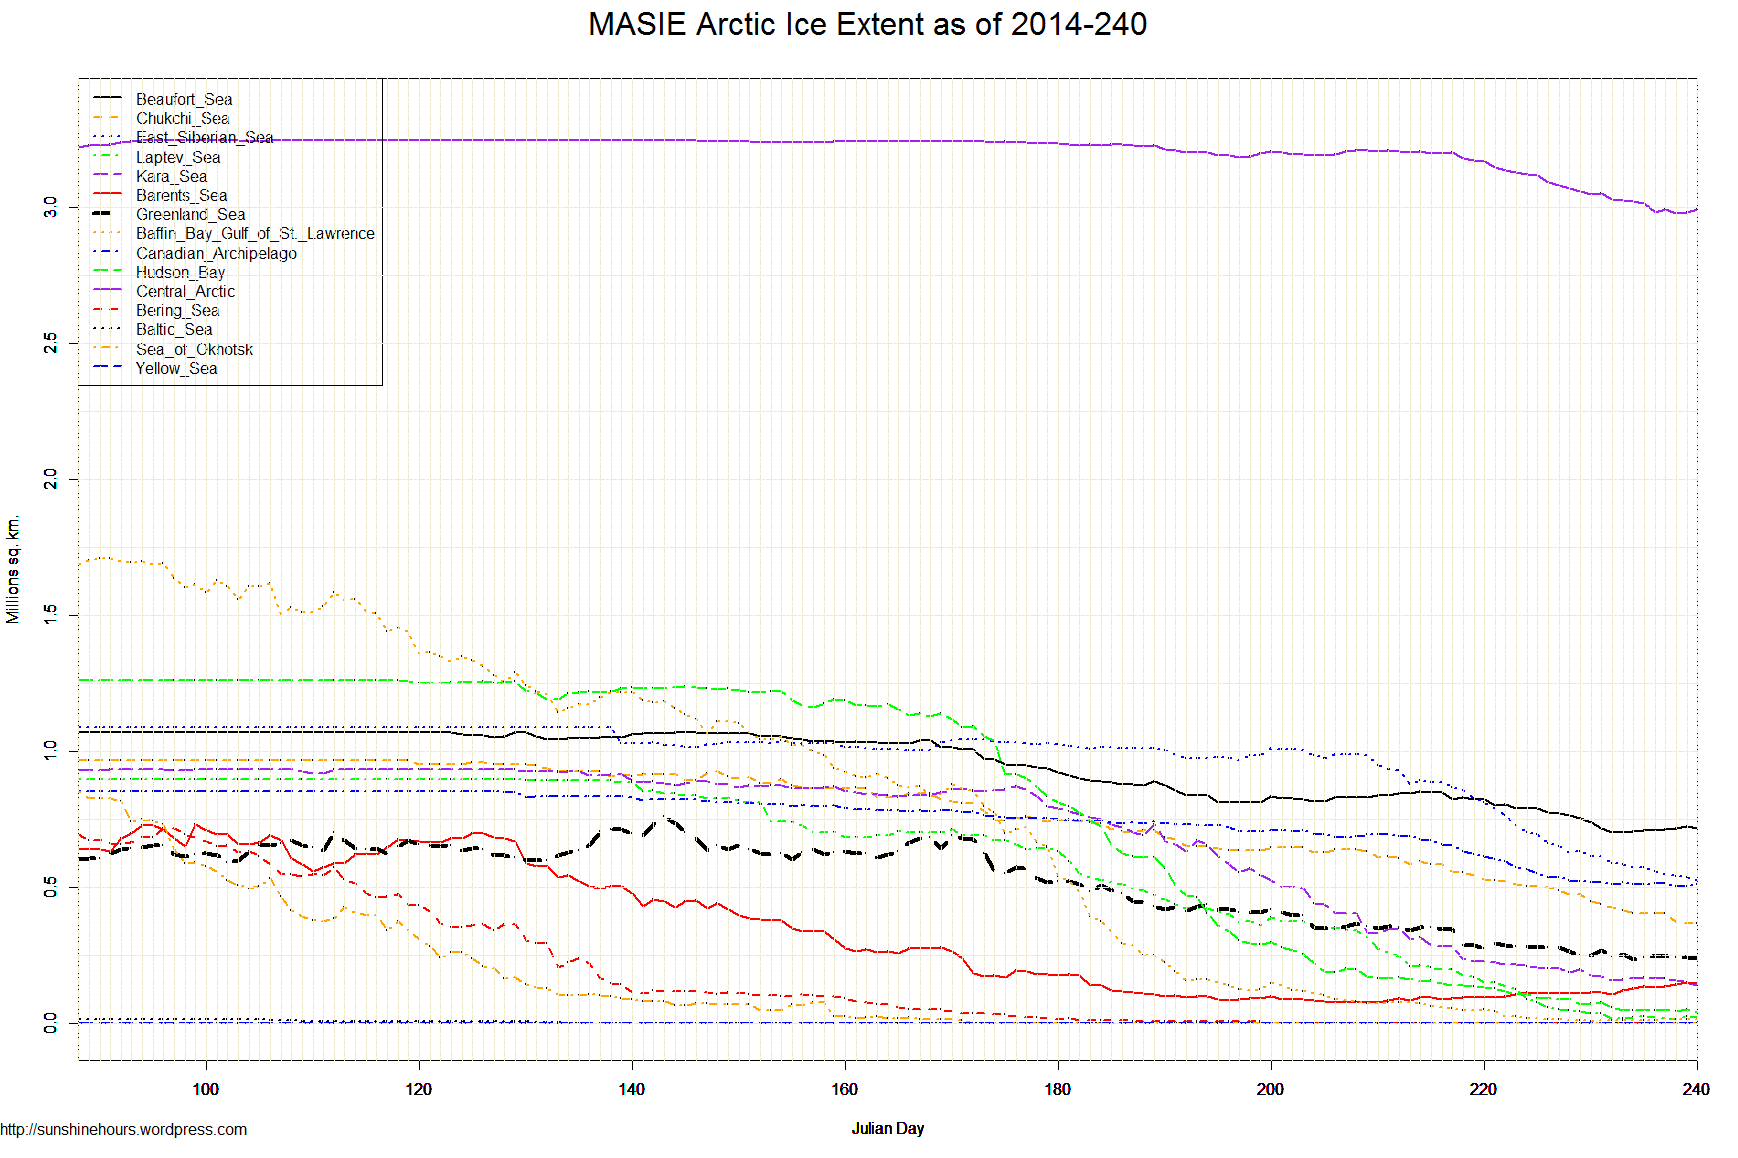
Arctic Sea Ice Extent Aug 29 2014 – -1,068,000 sq km below the 1981-2010 mean. Data for Day 240. Data here.

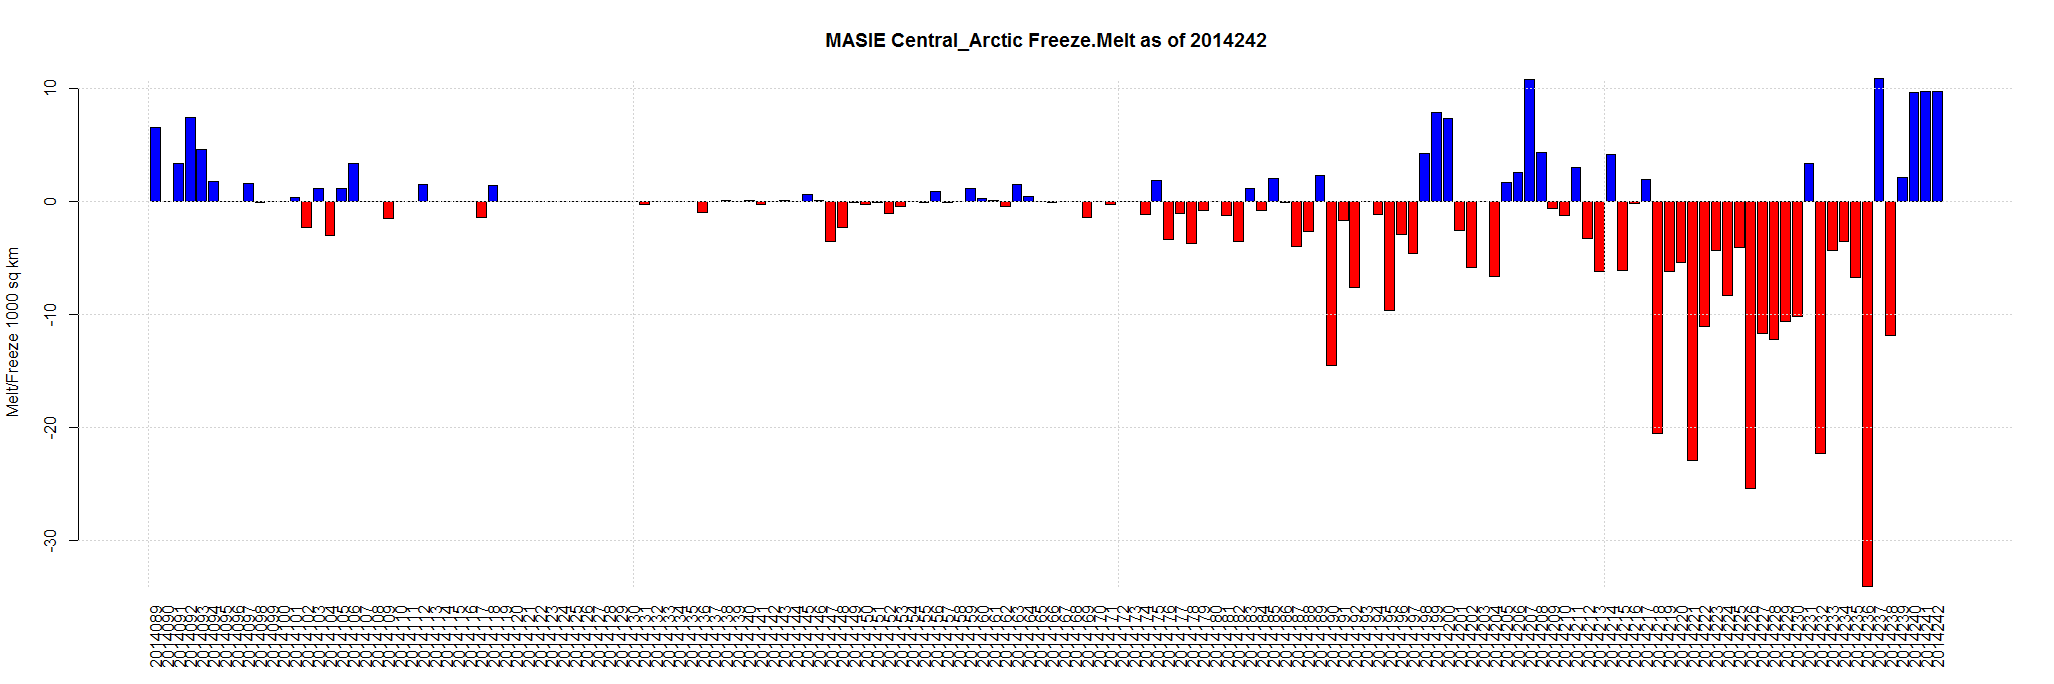
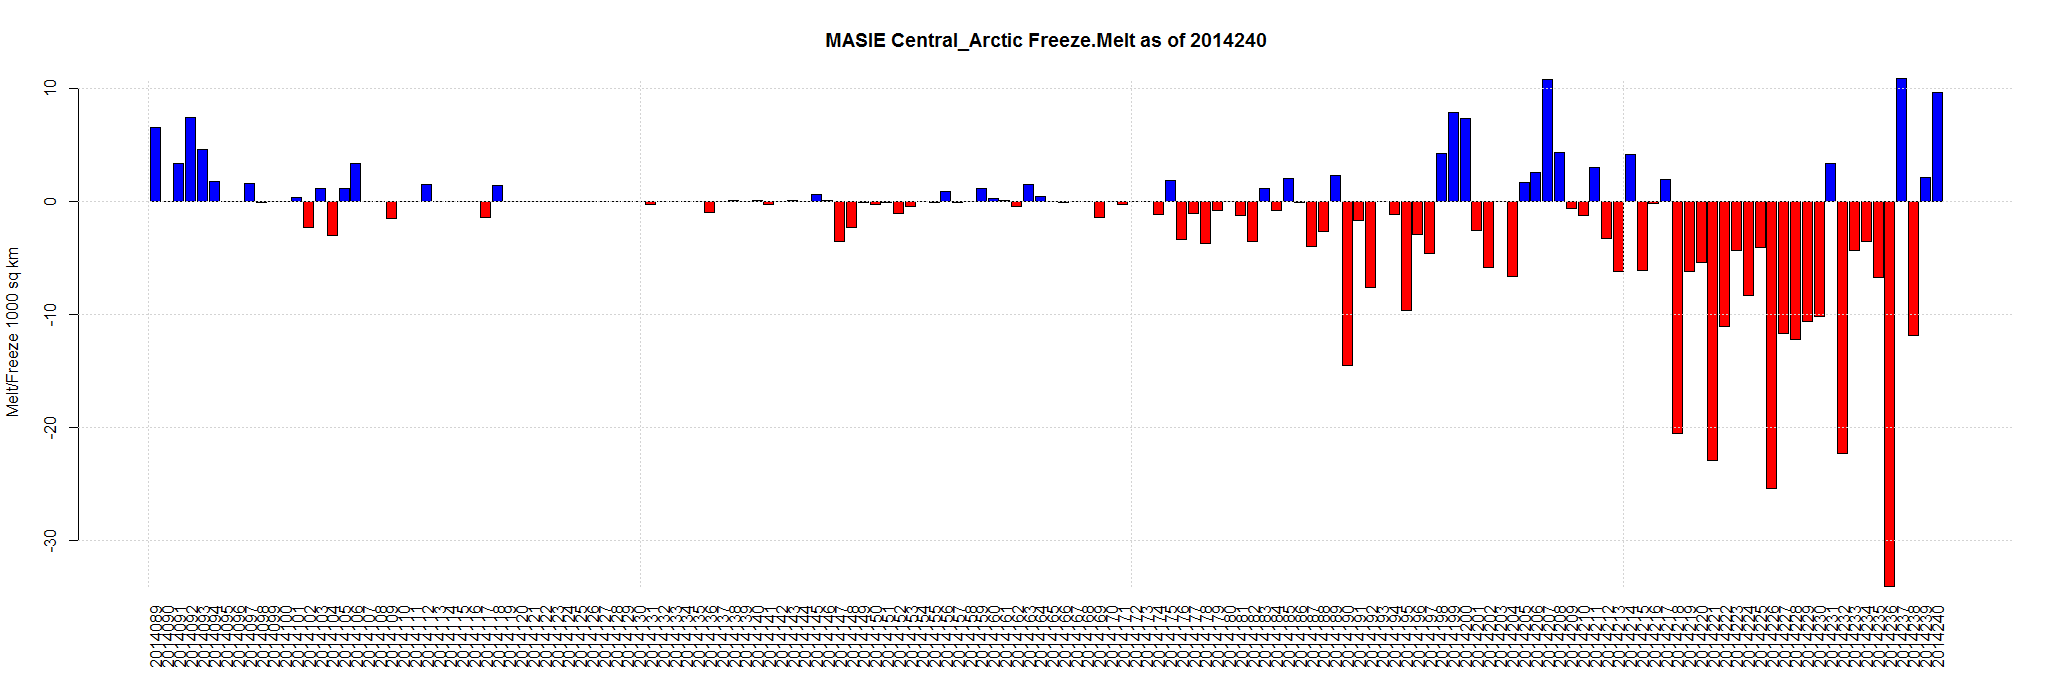
Aug 29 2014 MASIE Update – Smallish Melt – Central Arctic Up
Data here. Click for bigger.

| Region | 153 days ago | End | Last 152 | Last 28 | Last 14 | Last 7 | Last 3 | Last 1 |
| East Siberian Sea | 1,087,137 | 526,531 | -560,606 | -403,086 | -135,058 | -57,657 | -20,196 | -9,184 |
| Kara Sea | 933,859 | 141,560 | -792,300 | -208,394 | -61,807 | -19,750 | -22,995 | -9,136 |
| Hudson Bay | 1,260,903 | 42,660 | -1,218,243 | -126,611 | -50,283 | -7,223 | -7,078 | -8,785 |
| Barents Sea | 645,917 | 146,158 | -499,759 | 53,791 | 35,795 | 22,362 | 8,900 | -5,406 |
| Greenland Sea | 603,416 | 237,962 | -365,454 | -114,575 | -42,848 | -16,280 | -7,868 | -5,337 |
| Beaufort Sea | 1,070,445 | 719,292 | -351,153 | -127,641 | -57,714 | 14,690 | 7,173 | -3,917 |
| Laptev Sea | 897,845 | 23,140 | -874,705 | -224,482 | -37,409 | 4,939 | 3,417 | -1,987 |
| Chukchi Sea | 966,006 | 369,392 | -596,614 | -237,721 | -129,618 | -45,495 | -36,169 | -426 |
| Baffin Bay Gulf of St. Lawrence | 1,688,530 | 14,444 | -1,674,087 | -62,523 | -465 | 4,183 | -2,978 | 0 |
| Bering Sea | 697,324 | 0 | -697,324 | 0 | 0 | 0 | 0 | 0 |
| Baltic Sea | 15,337 | 0 | -15,337 | 0 | 0 | 0 | 0 | 0 |
| Sea of Okhotsk | 853,240 | 0 | -853,240 | 0 | 0 | 0 | 0 | 0 |
| Yellow Sea | 0 | 0 | 0 | 0 | 0 | 0 | 0 | 0 |
| Canadian Archipelago | 853,214 | 512,969 | -340,245 | -176,859 | -25,011 | -4,652 | -980 | 7,418 |
| Central Arctic | 3,221,921 | 2,991,393 | -230,528 | -215,618 | -101,321 | -33,385 | -7 | 9,660 |
| Northern Hemisphere (Total) | 14,805,115 | 5,726,644 | -9,078,471 | -1,843,719 | -605,737 | -138,268 | -78,780 | -27,101 |
| NH (Average Loss per Day) | -59,336 | -65,847 | -43,267 | -19,753 | -26,260 | -27,101 |
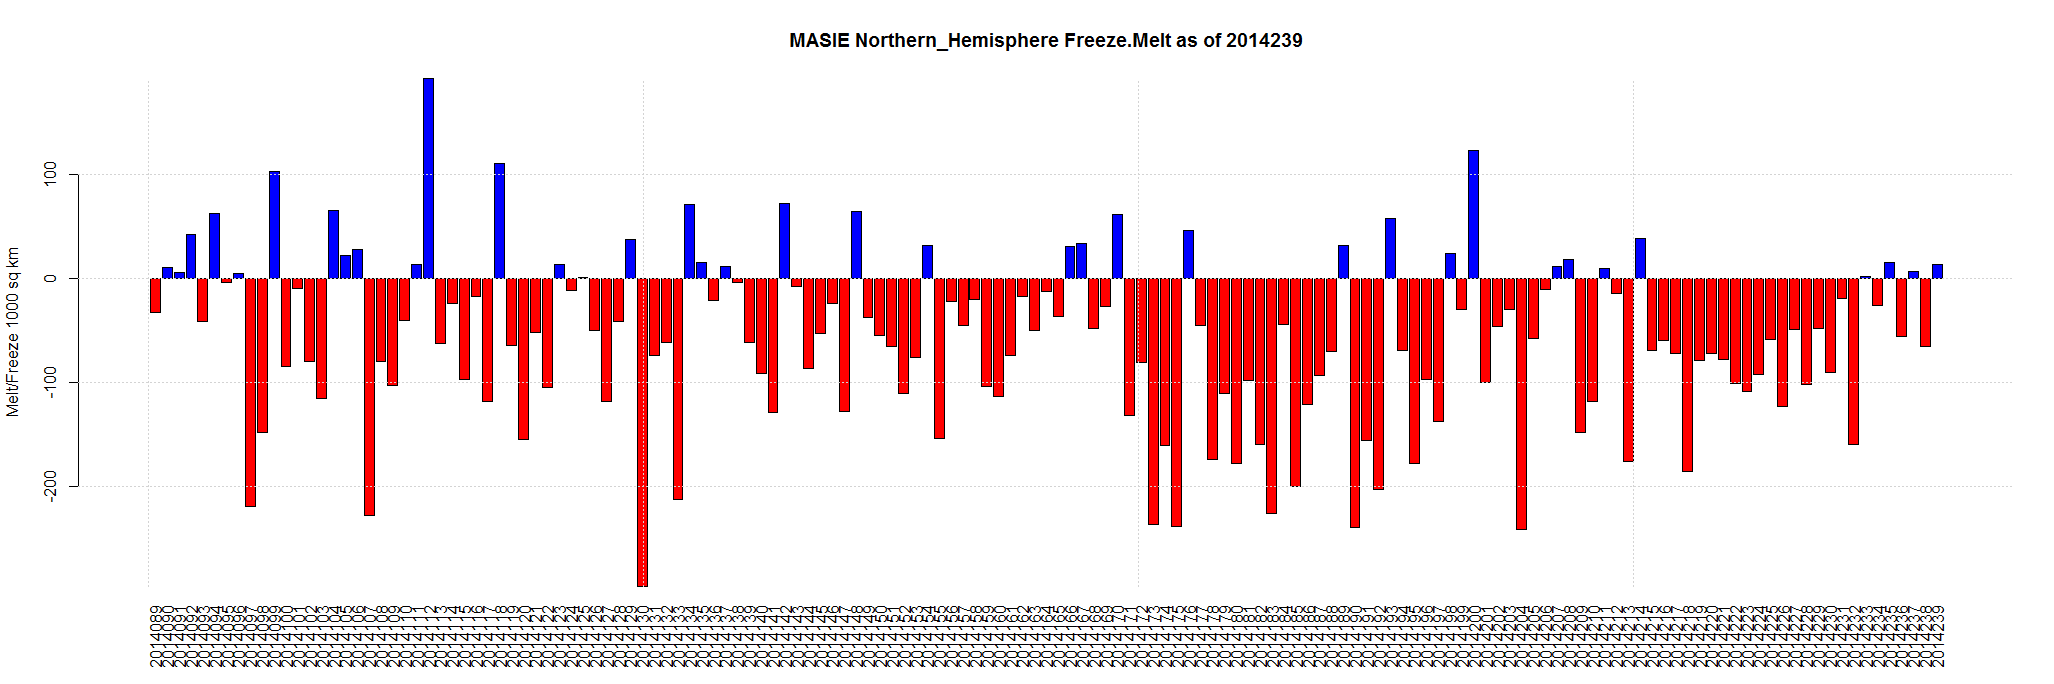
Aug 28 2014 MASIE Update – The last 7 days have been up and down. 6 regions gained over last day (see at bottom) and 5 of those have a positive change over 3 days.
Data here. Click for bigger.
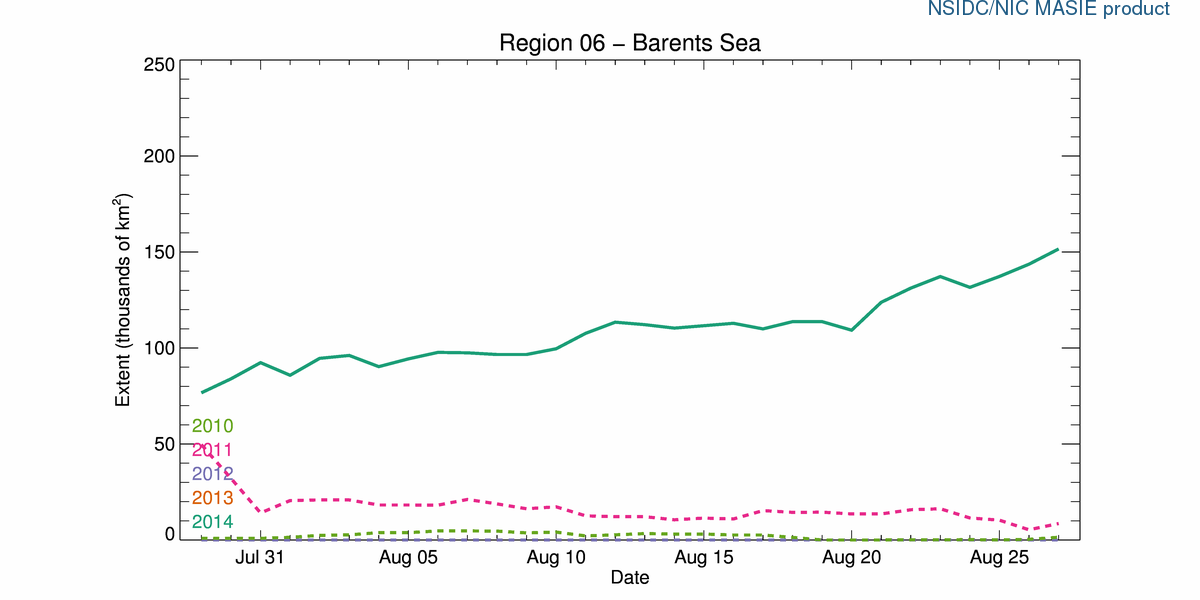
See how bizarre the Barents Sea is compare to previous 4 years.:
| Region | 152 days ago | End | Last 151 | Last 28 | Last 14 | Last 7 | Last 3 | Last 1 |
| Kara Sea | 933,859 | 150,696 | -783,163 | -197,441 | -56,246 | -6,863 | -15,760 | -7,781 |
| East Siberian Sea | 1,087,137 | 535,715 | -551,422 | -399,480 | -160,613 | -52,800 | -24,345 | -5,451 |
| Chukchi Sea | 966,006 | 369,819 | -596,188 | -243,128 | -135,602 | -55,842 | -35,034 | -3,888 |
| Baffin Bay Gulf of St. Lawrence | 1,688,530 | 14,444 | -1,674,087 | -62,007 | -6,262 | 4,287 | 4,201 | -2,470 |
| Greenland Sea | 603,416 | 243,299 | -360,116 | -113,522 | -36,738 | -5,499 | -2,979 | -136 |
| Bering Sea | 697,324 | 0 | -697,324 | 0 | 0 | 0 | 0 | 0 |
| Baltic Sea | 15,337 | 0 | -15,337 | 0 | 0 | 0 | 0 | 0 |
| Sea of Okhotsk | 853,240 | 0 | -853,240 | 0 | 0 | 0 | 0 | 0 |
| Yellow Sea | 0 | 0 | 0 | 0 | 0 | 0 | 0 | 0 |
| Canadian Archipelago | 853,214 | 505,552 | -347,663 | -189,321 | -47,791 | -5,478 | -9,943 | 1,398 |
| Central Arctic | 3,221,921 | 2,981,734 | -240,188 | -228,505 | -136,325 | -47,407 | 1,203 | 2,145 |
| Beaufort Sea | 1,070,445 | 723,209 | -347,236 | -115,035 | -66,257 | 19,482 | 11,937 | 5,847 |
| Hudson Bay | 1,260,903 | 51,445 | -1,209,458 | -113,934 | -41,690 | -7,698 | 1,707 | 6,169 |
| Barents Sea | 645,917 | 151,565 | -494,353 | 67,628 | 39,410 | 42,304 | 19,985 | 7,908 |
| Laptev Sea | 897,845 | 25,126 | -872,718 | -236,263 | -53,555 | 6,063 | 3,703 | 9,965 |
| Northern Hemisphere (Total) | 14,805,115 | 5,753,745 | -9,051,370 | -1,831,007 | -701,669 | -109,452 | -45,325 | 13,705 |
| NH (Average Loss per Day) | -59,548 | -65,393 | -50,119 | -15,636 | -15,108 | 13,705 |
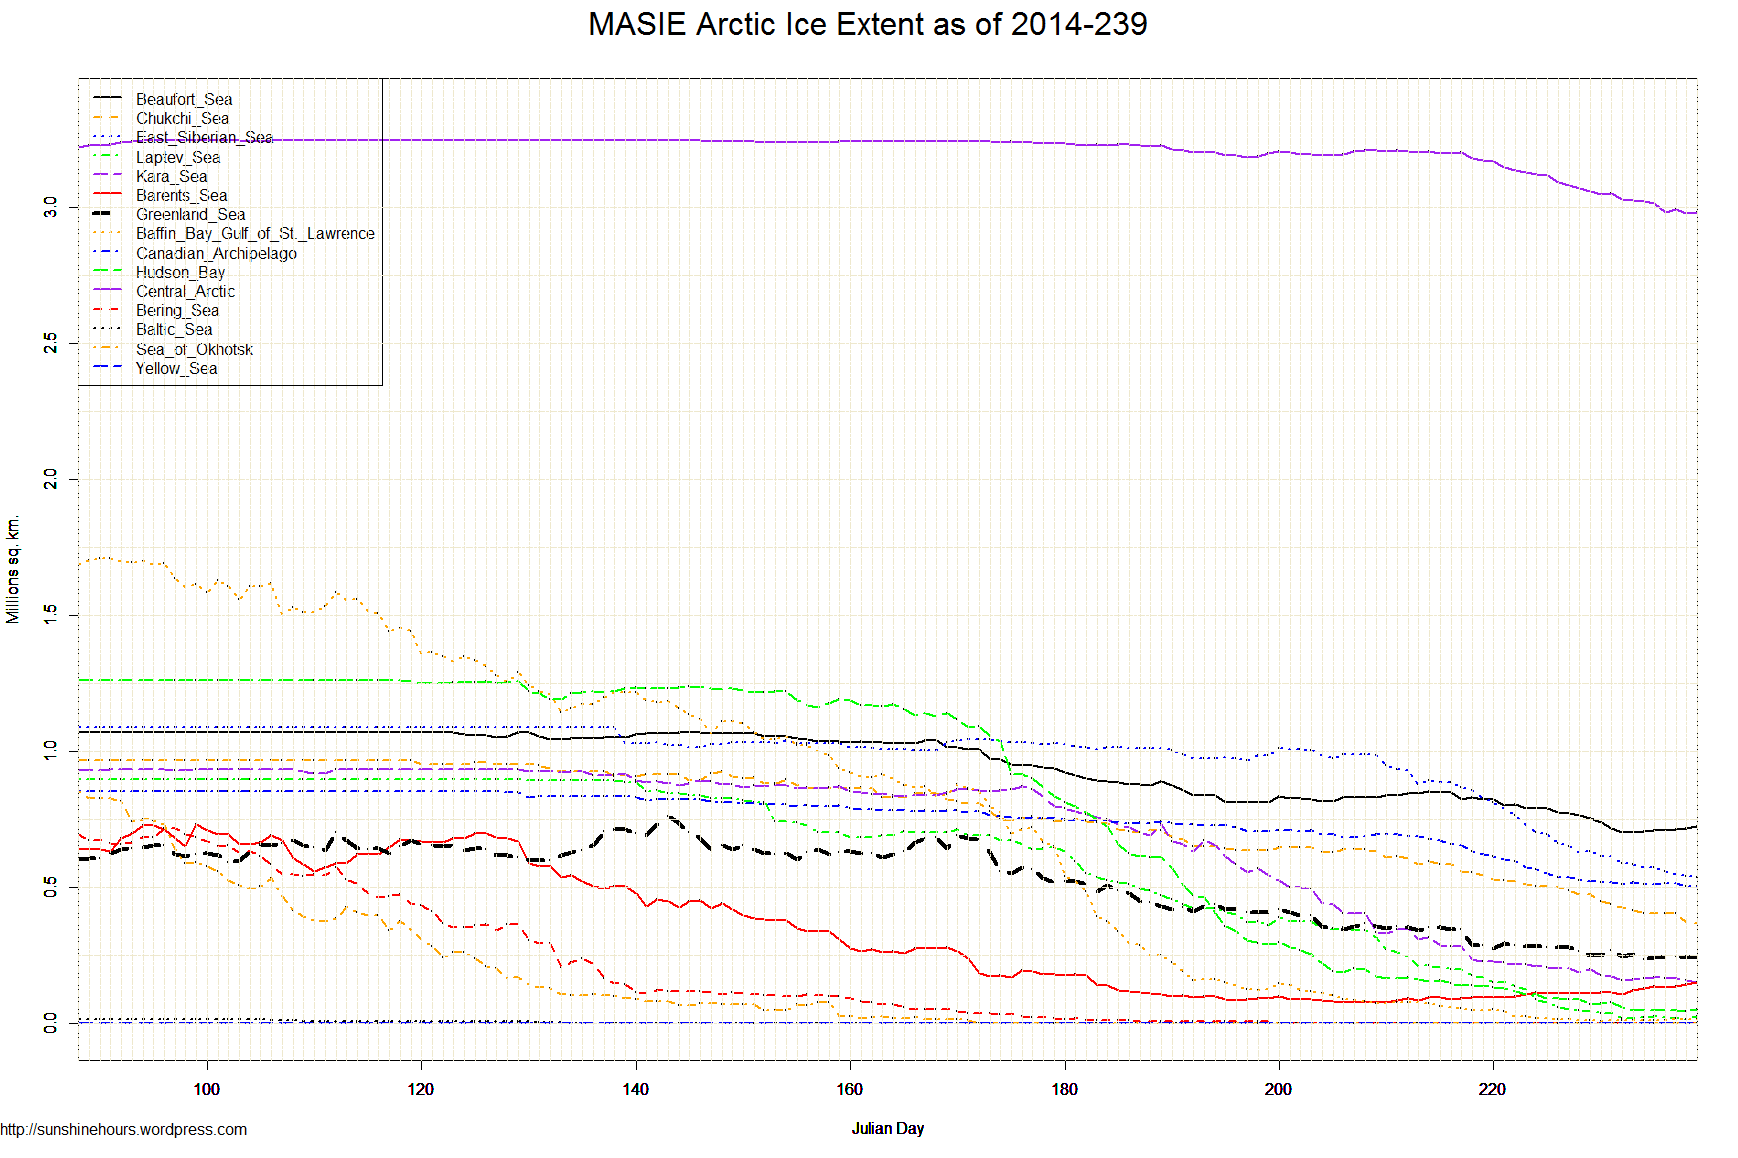
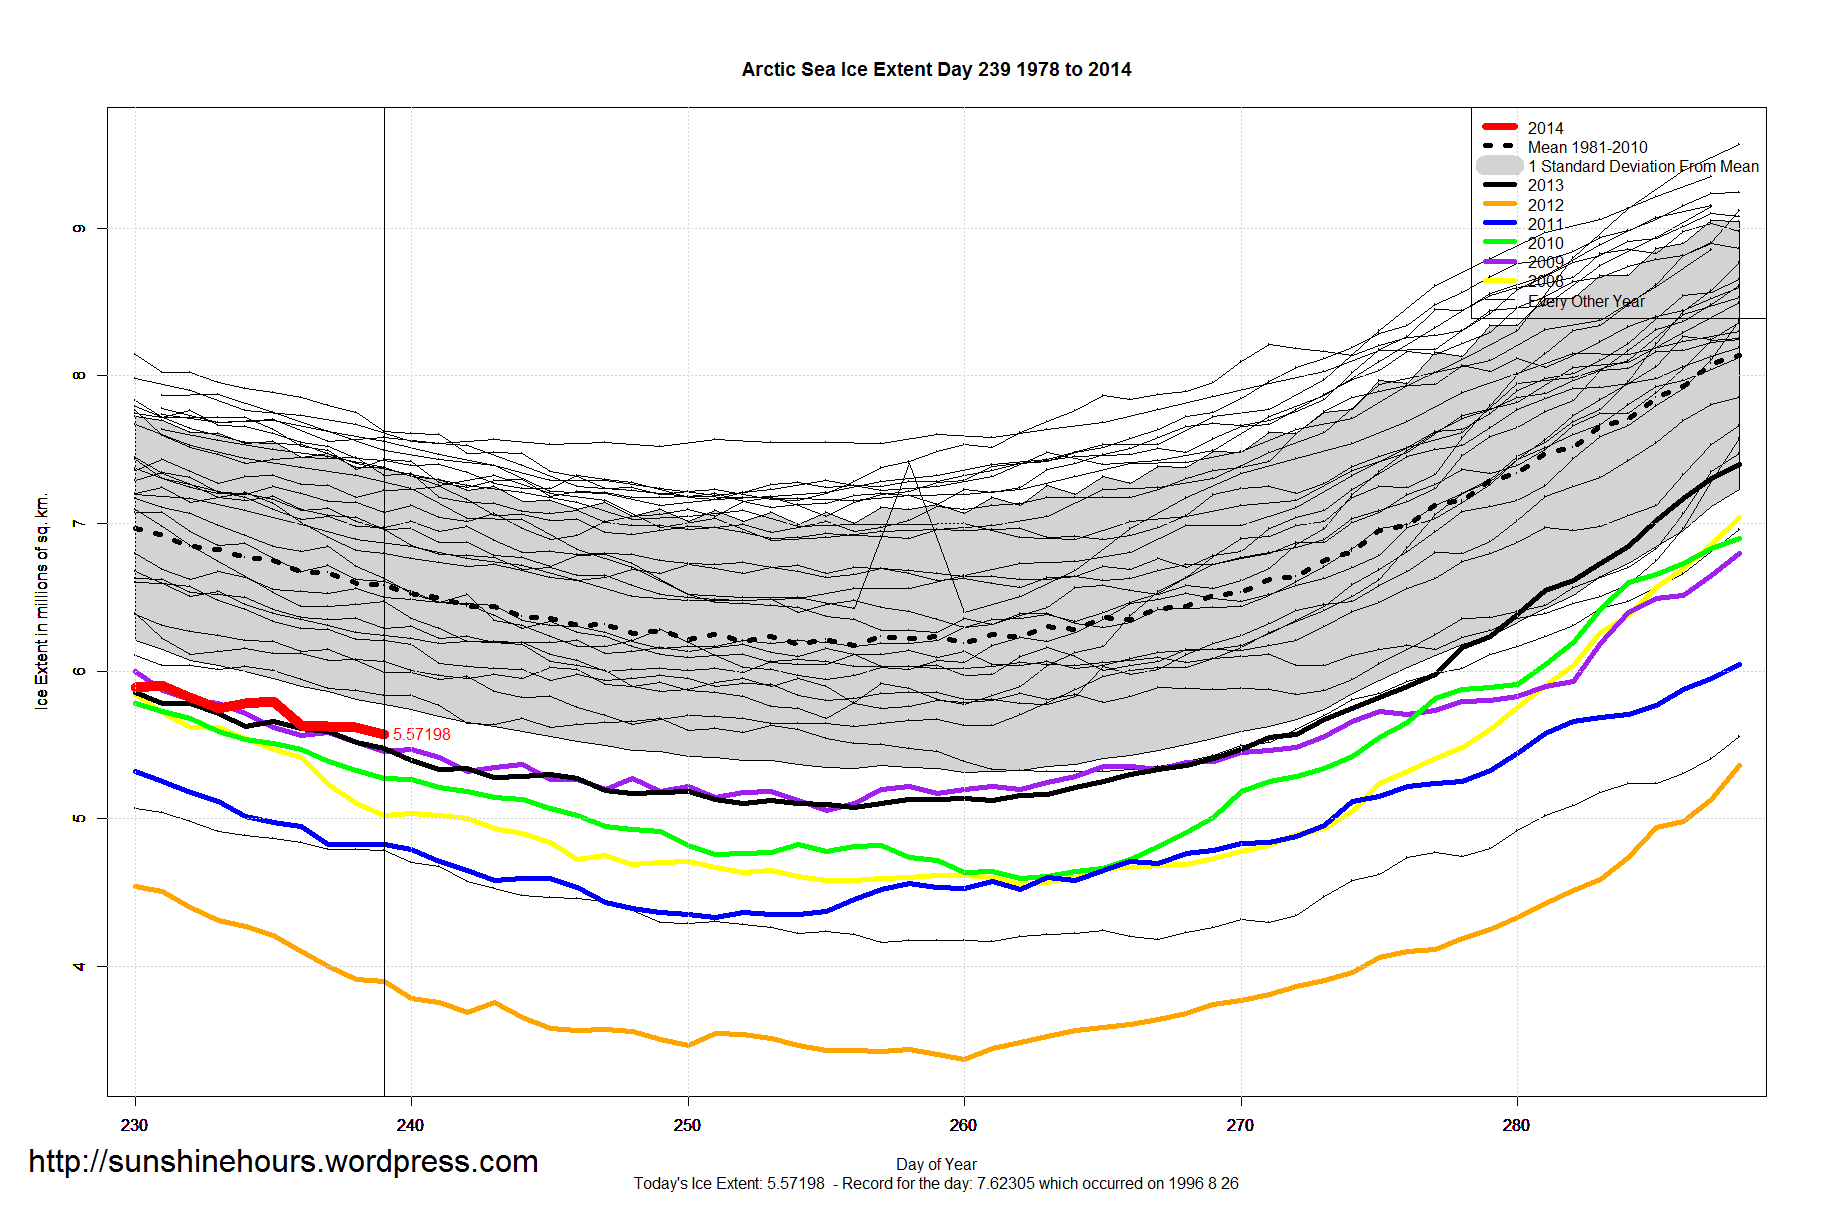
Arctic Sea Ice Extent Aug 28 2014 – -1,075,000 sq km below the 1981-2010 mean. Data for Day 239. Data here.
2006 was the last time Arctic Sea Ice Extent was higher for day 239.

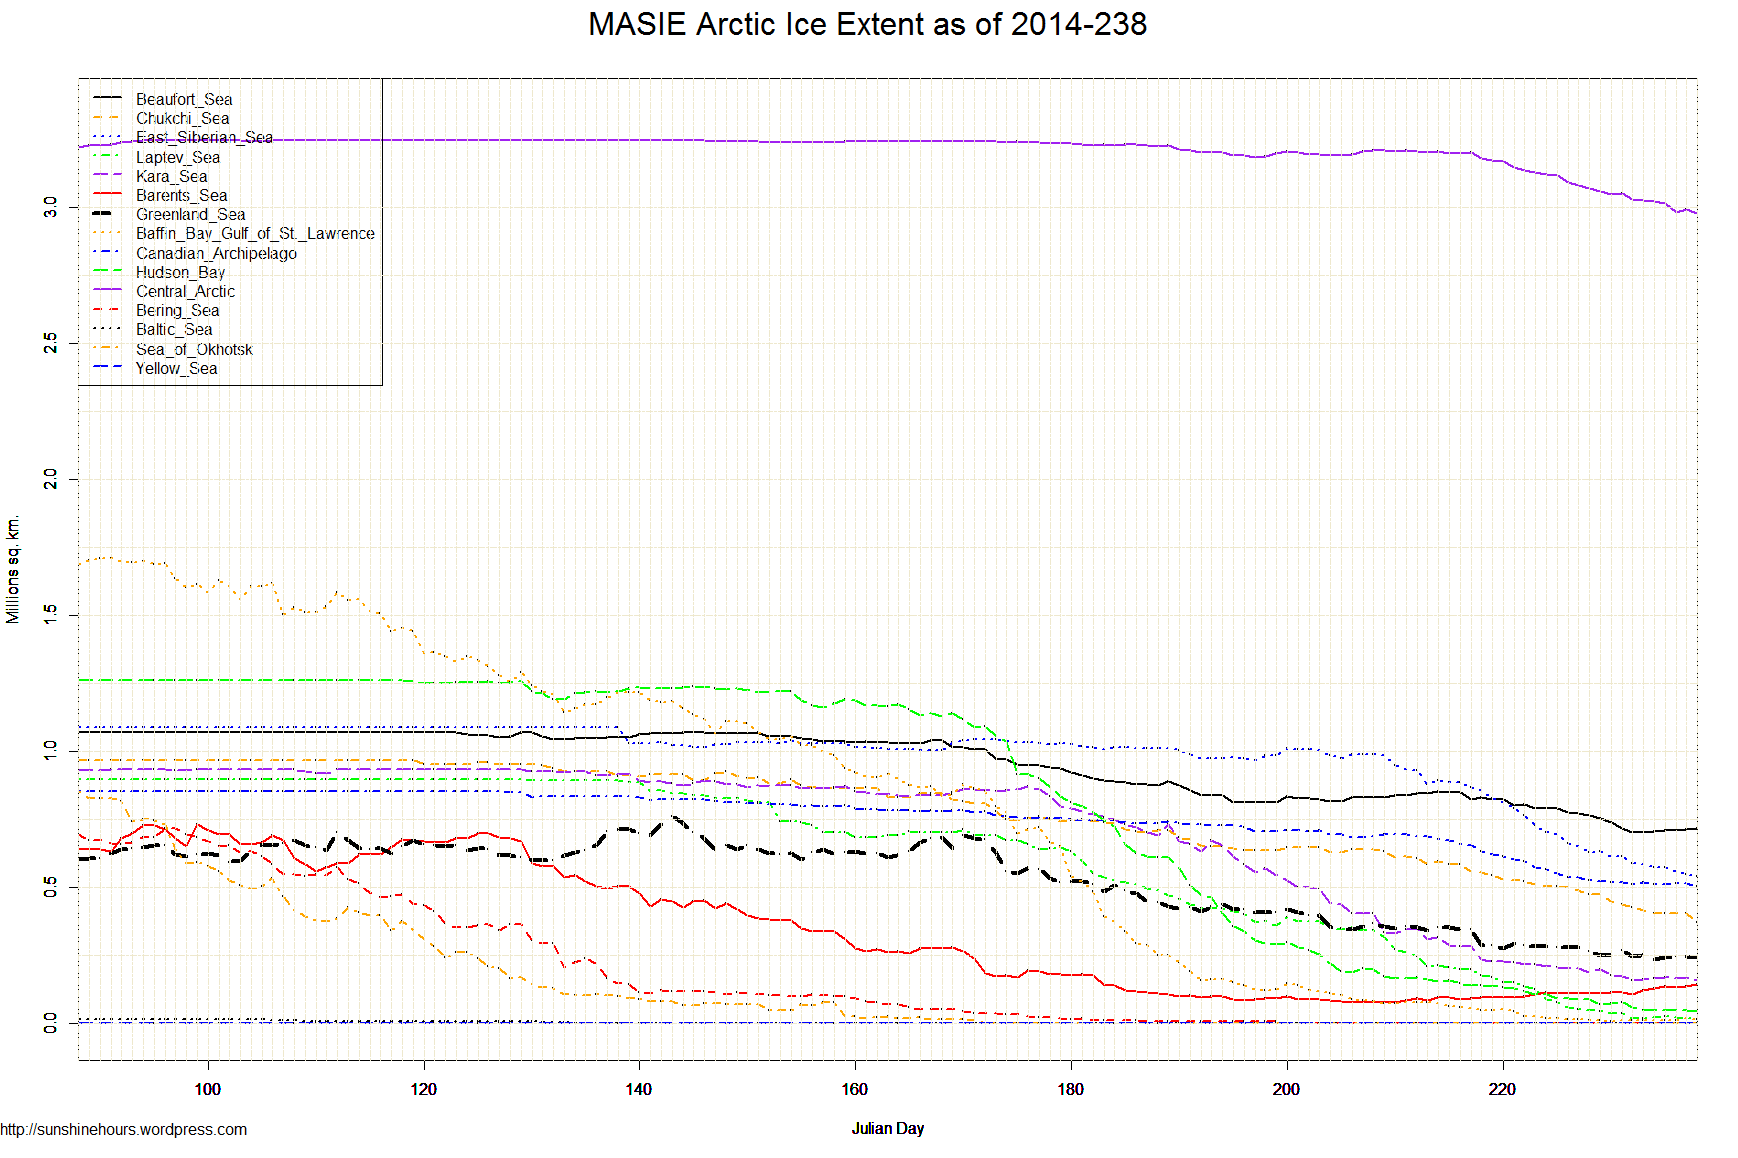
Aug 25 2014 MASIE Update – Smallish Melt – Barents and Beaufort Increase
Data here. Click for bigger.

| Region | 151 days ago | End | Last 150 | Last 28 | Last 14 | Last 7 | Last 3 | Last 1 |
| Chukchi Sea | 966,006 | 373,707 | -592,300 | -237,929 | -131,714 | -63,872 | -31,146 | -31,854 |
| Central Arctic | 3,221,921 | 2,979,589 | -242,332 | -227,666 | -142,539 | -71,843 | -34,947 | -11,812 |
| Canadian Archipelago | 853,214 | 504,154 | -349,061 | -191,839 | -61,886 | -15,376 | -7,870 | -9,796 |
| Kara Sea | 933,859 | 158,477 | -775,382 | -171,979 | -53,037 | -15,174 | -11,515 | -6,078 |
| East Siberian Sea | 1,087,137 | 541,167 | -545,971 | -406,990 | -162,755 | -72,875 | -32,386 | -5,561 |
| Laptev Sea | 897,845 | 15,161 | -882,683 | -258,052 | -75,160 | -22,794 | -10,051 | -4,561 |
| Hudson Bay | 1,260,903 | 45,276 | -1,215,627 | -120,439 | -61,869 | -31,208 | -4,607 | -4,462 |
| Greenland Sea | 603,416 | 243,436 | -359,980 | -106,561 | -39,529 | -26,351 | -1,387 | -2,394 |
| Baffin Bay Gulf of St. Lawrence | 1,688,530 | 16,914 | -1,671,617 | -57,585 | -4,010 | 5,832 | 6,671 | -508 |
| Bering Sea | 697,324 | 0 | -697,324 | 0 | 0 | 0 | 0 | 0 |
| Baltic Sea | 15,337 | 0 | -15,337 | 0 | 0 | 0 | 0 | 0 |
| Sea of Okhotsk | 853,240 | 0 | -853,240 | 0 | 0 | 0 | 0 | 0 |
| Yellow Sea | 0 | 0 | 0 | 0 | 0 | 0 | 0 | 0 |
| Beaufort Sea | 1,070,445 | 717,362 | -353,083 | -122,652 | -72,103 | 1,370 | 6,090 | 5,243 |
| Barents Sea | 645,917 | 143,656 | -502,261 | 66,980 | 30,224 | 29,929 | 6,447 | 6,399 |
| Northern Hemisphere (Total) | 14,805,115 | 5,740,040 | -9,065,075 | -1,834,712 | -774,376 | -282,362 | -114,701 | -65,384 |
| NH (Average Loss per Day) | -60,034 | -65,525 | -55,313 | -40,337 | -38,234 | -65,384 |
