Global Sea Ice Extent Aug 16 2014 – 216,000 sq km above the 1981-2010 mean. Data for Day 227. Data here.


Global Sea Ice Extent Aug 16 2014 – 216,000 sq km above the 1981-2010 mean. Data for Day 227. Data here.
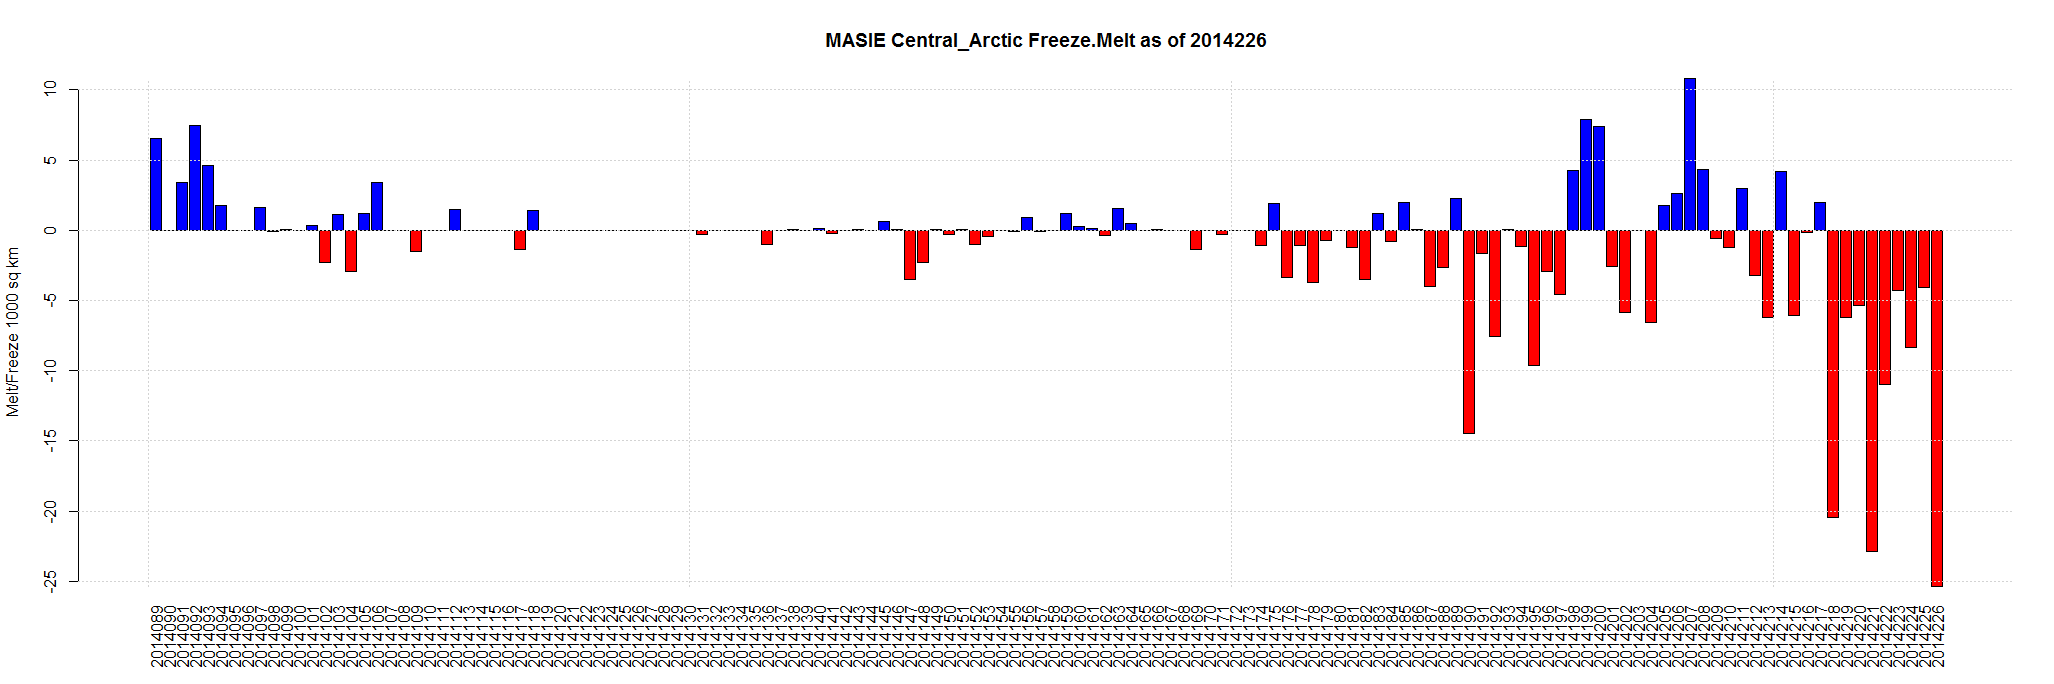
Aug 15 2014 MASIE Update – Steady Melting … Central Arctic is melting … But 25,000 sq km a day is less than 1%.
Data here. Click for bigger.

| Region | 139 days ago | End | Last 138 | Last 28 | Last 14 | Last 7 | Last 3 | Last 1 |
| East Siberian Sea | 1,087,137 | 661,589 | -425,548 | -323,275 | -268,028 | -167,652 | -67,671 | -34,740 |
| Central Arctic | 3,221,921 | 3,092,715 | -129,206 | -96,657 | -114,296 | -81,279 | -37,730 | -25,344 |
| Laptev Sea | 897,845 | 60,549 | -837,296 | -314,024 | -187,072 | -107,857 | -65,786 | -18,132 |
| Canadian Archipelago | 853,214 | 537,980 | -315,234 | -167,662 | -151,849 | -84,174 | -36,530 | -15,362 |
| Beaufort Sea | 1,070,445 | 777,006 | -293,439 | -35,505 | -69,927 | -48,917 | -12,936 | -12,459 |
| Chukchi Sea | 966,006 | 499,010 | -466,996 | -139,212 | -108,104 | -47,016 | -12,521 | -6,411 |
| Baffin Bay Gulf of St. Lawrence | 1,688,530 | 14,908 | -1,673,622 | -107,441 | -62,059 | -34,990 | -10,468 | -5,797 |
| Kara Sea | 933,859 | 203,367 | -730,492 | -366,257 | -146,587 | -24,419 | -15,228 | -3,575 |
| Barents Sea | 645,917 | 110,363 | -535,554 | 17,597 | 17,996 | 12,878 | 2,718 | -1,792 |
| Hudson Bay | 1,260,903 | 92,943 | -1,167,960 | -200,665 | -76,329 | -44,615 | -14,252 | -192 |
| Bering Sea | 697,324 | 0 | -697,324 | -7,345 | 0 | 0 | 0 | 0 |
| Baltic Sea | 15,337 | 0 | -15,337 | 0 | 0 | 0 | 0 | 0 |
| Sea of Okhotsk | 853,240 | 0 | -853,240 | 0 | 0 | 0 | 0 | 0 |
| Yellow Sea | 0 | 0 | 0 | 0 | 0 | 0 | 0 | 0 |
| Greenland Sea | 603,416 | 280,810 | -322,606 | -129,470 | -71,727 | -5,698 | -3,902 | 772 |
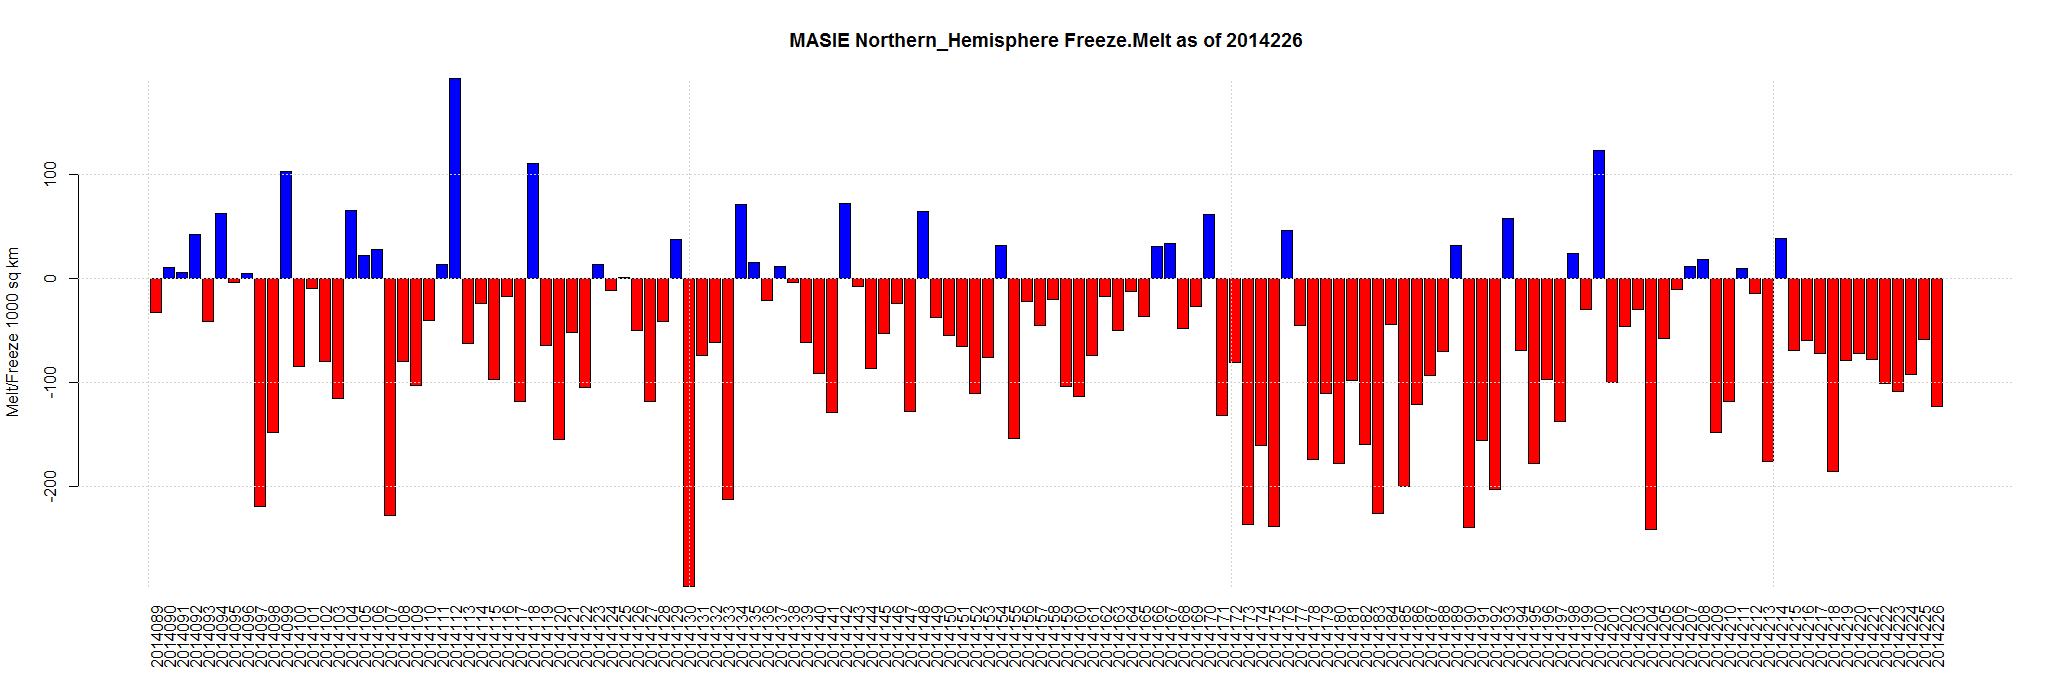
| Northern Hemisphere (Total) | 14,805,115 | 6,332,381 | -8,472,733 | -1,869,915 | -1,237,982 | -633,738 | -274,305 | -123,033 |
| NH (Average Loss per Day) | -60,955 | -66,783 | -88,427 | -90,534 | -91,435 | -123,033 |
Global Sea Ice Extent is 290,000 sq km above the 1981-2010 mean. 2,200,000 sq km than 2012.


Arctic Sea Ice Extent is -1,064,000 sq km below the 1981-2010 mean.

Aug 14 2014 MASIE Update – Steady Melting … Central Arctic is melting … but only 100,000 sq km in last 2 weeks.
Data here. Click for bigger.


| Region | 138 days ago | End | Last 137 | Last 28 | Last 14 | Last 7 | Last 3 | Last 1 |
| Hudson Bay | 1,260,903 | 93,135 | -1,167,768 | -212,462 | -72,244 | -47,013 | -23,652 | -14,010 |
| Canadian Archipelago | 853,214 | 553,342 | -299,872 | -152,299 | -141,531 | -79,302 | -42,486 | -12,697 |
| Laptev Sea | 897,845 | 78,681 | -819,164 | -294,331 | -182,708 | -99,376 | -59,238 | -11,640 |
| East Siberian Sea | 1,087,137 | 696,329 | -390,809 | -272,269 | -238,866 | -161,125 | -70,468 | -7,593 |
| Kara Sea | 933,859 | 206,942 | -726,917 | -350,088 | -141,195 | -27,938 | -10,238 | -4,571 |
| Central Arctic | 3,221,921 | 3,118,059 | -103,863 | -67,052 | -92,180 | -62,156 | -16,679 | -4,069 |
| Greenland Sea | 603,416 | 280,038 | -323,378 | -130,531 | -76,783 | -6,463 | -8,932 | -2,927 |
| Barents Sea | 645,917 | 112,155 | -533,763 | 24,265 | 28,218 | 14,438 | 12,564 | -1,277 |
| Baffin Bay Gulf of St. Lawrence | 1,688,530 | 20,706 | -1,667,825 | -104,861 | -55,746 | -29,193 | -6,862 | -218 |
| Beaufort Sea | 1,070,445 | 789,465 | -280,980 | -23,046 | -48,778 | -41,510 | -16,482 | 0 |
| Chukchi Sea | 966,006 | 505,421 | -460,585 | -132,801 | -107,525 | -50,382 | -17,135 | 0 |
| Bering Sea | 697,324 | 0 | -697,324 | -7,345 | 0 | 0 | 0 | 0 |
| Baltic Sea | 15,337 | 0 | -15,337 | 0 | 0 | 0 | 0 | 0 |
| Sea of Okhotsk | 853,240 | 0 | -853,240 | 0 | 0 | 0 | 0 | 0 |
| Yellow Sea | 0 | 0 | 0 | 0 | 0 | 0 | 0 | 0 |
| Northern Hemisphere (Total) | 14,805,115 | 6,455,414 | -8,349,701 | -1,722,821 | -1,129,338 | -590,019 | -259,610 | -59,002 |
| NH (Average Loss per Day) | -60,505 | -61,529 | -80,667 | -84,288 | -86,537 | -59,002 |
Global Sea Ice Extent is 144,000 sq km above the 1981-2010 mean. 2,100,000 sq km than 2012.
Arctic Sea Ice Extent is -1,043,000 sq km below the 1981-2010 mean.
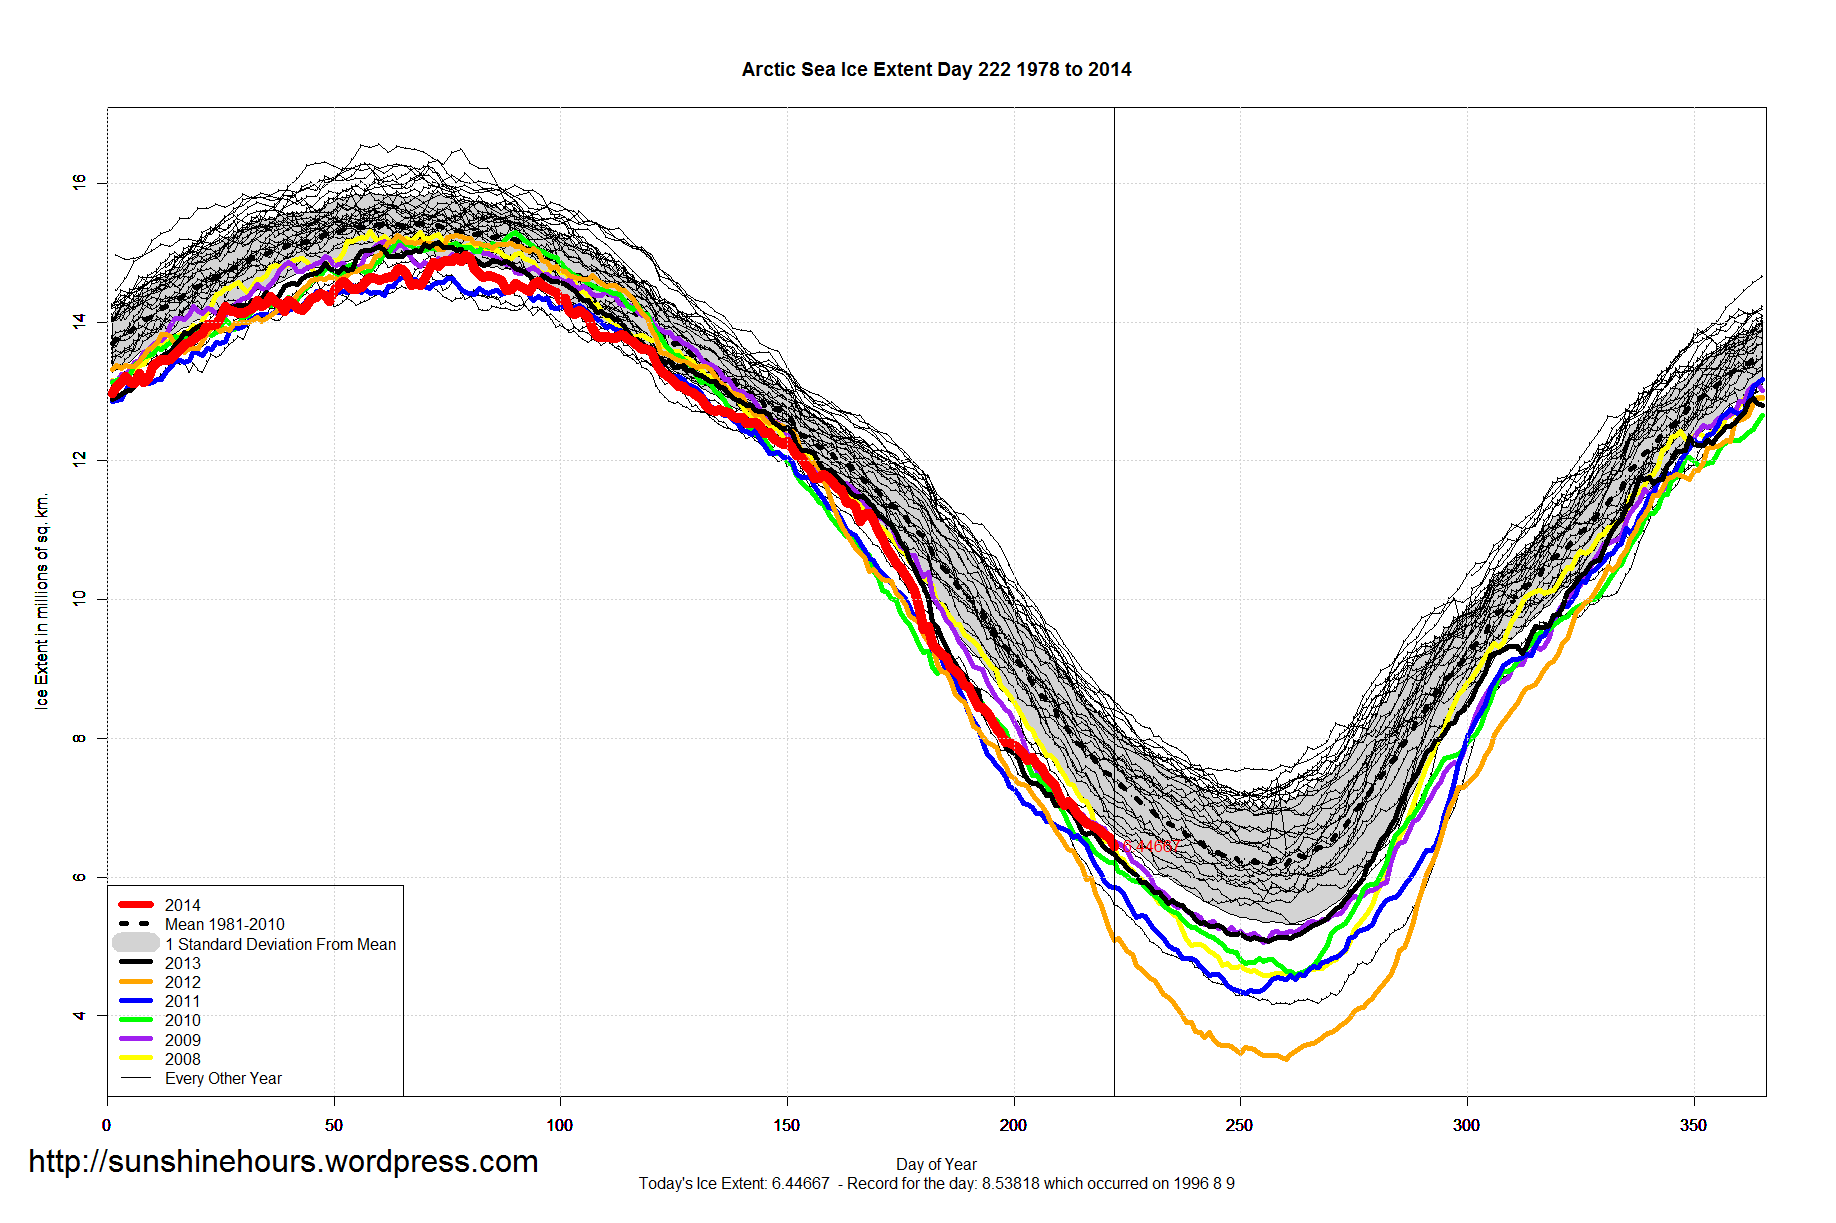
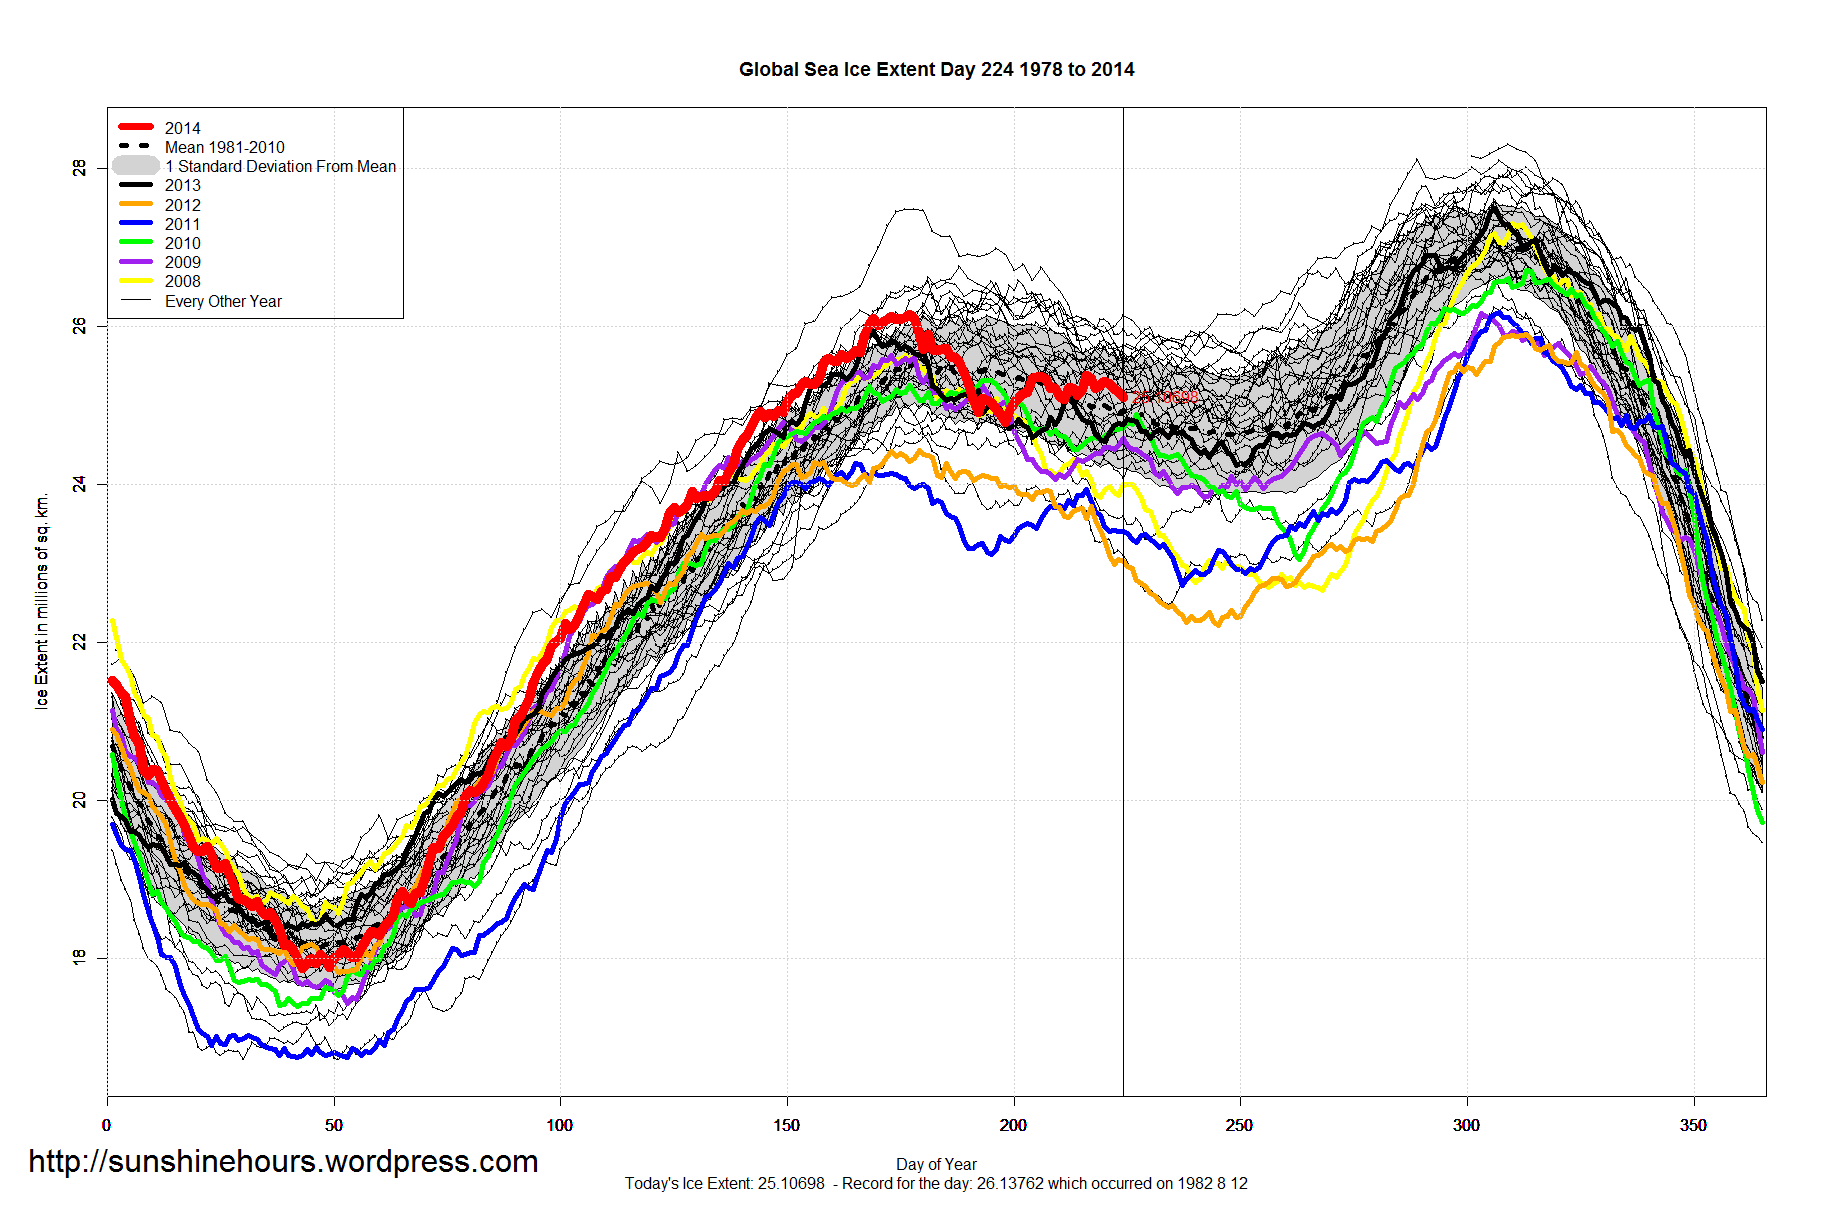
Drifting very slowly away from the standard deviation mark. It is now 300,000 sq km below. A few days ago it was 220,000. But, to be fair, 2 weeks ago it was 500,000 below.
The data is for day 224. Day 245 was the earliest minimum ever. Day 265 was the latest. So 3 to 6 weeks more melting.

Arctic Sea Ice Extent is -1,017,000 sq km below the 1981-2010 mean.

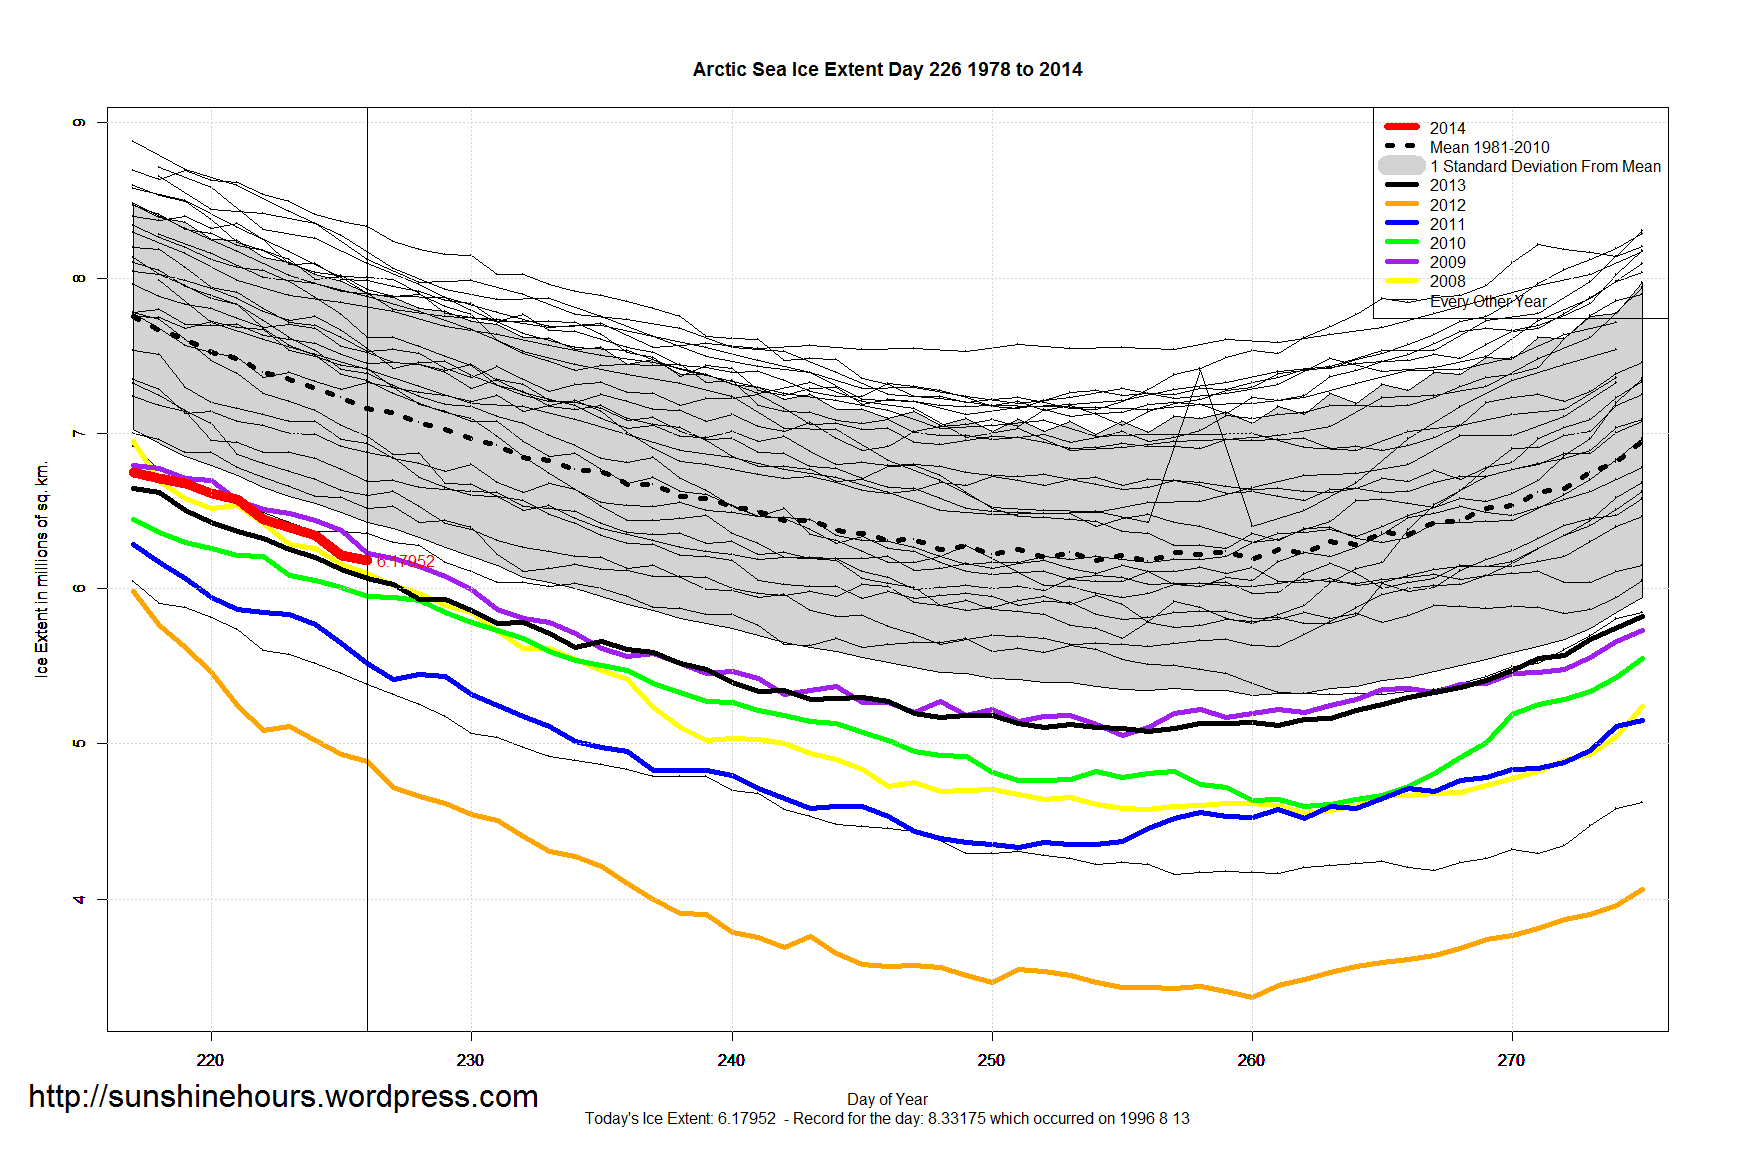
Global Sea Ice Extent is 216,000 sq km above the 1981-2010 mean. Notice how much closer it is to the highest for the day than the lowest.

Arctic Sea Ice Extent is -1,025,000 sq km below the 1981-2010 mean.