Global Sea Ice Extent Aug 20 2014 – 72,000 sq km above the 1981-2010 mean. Data for Day 231. Data here.
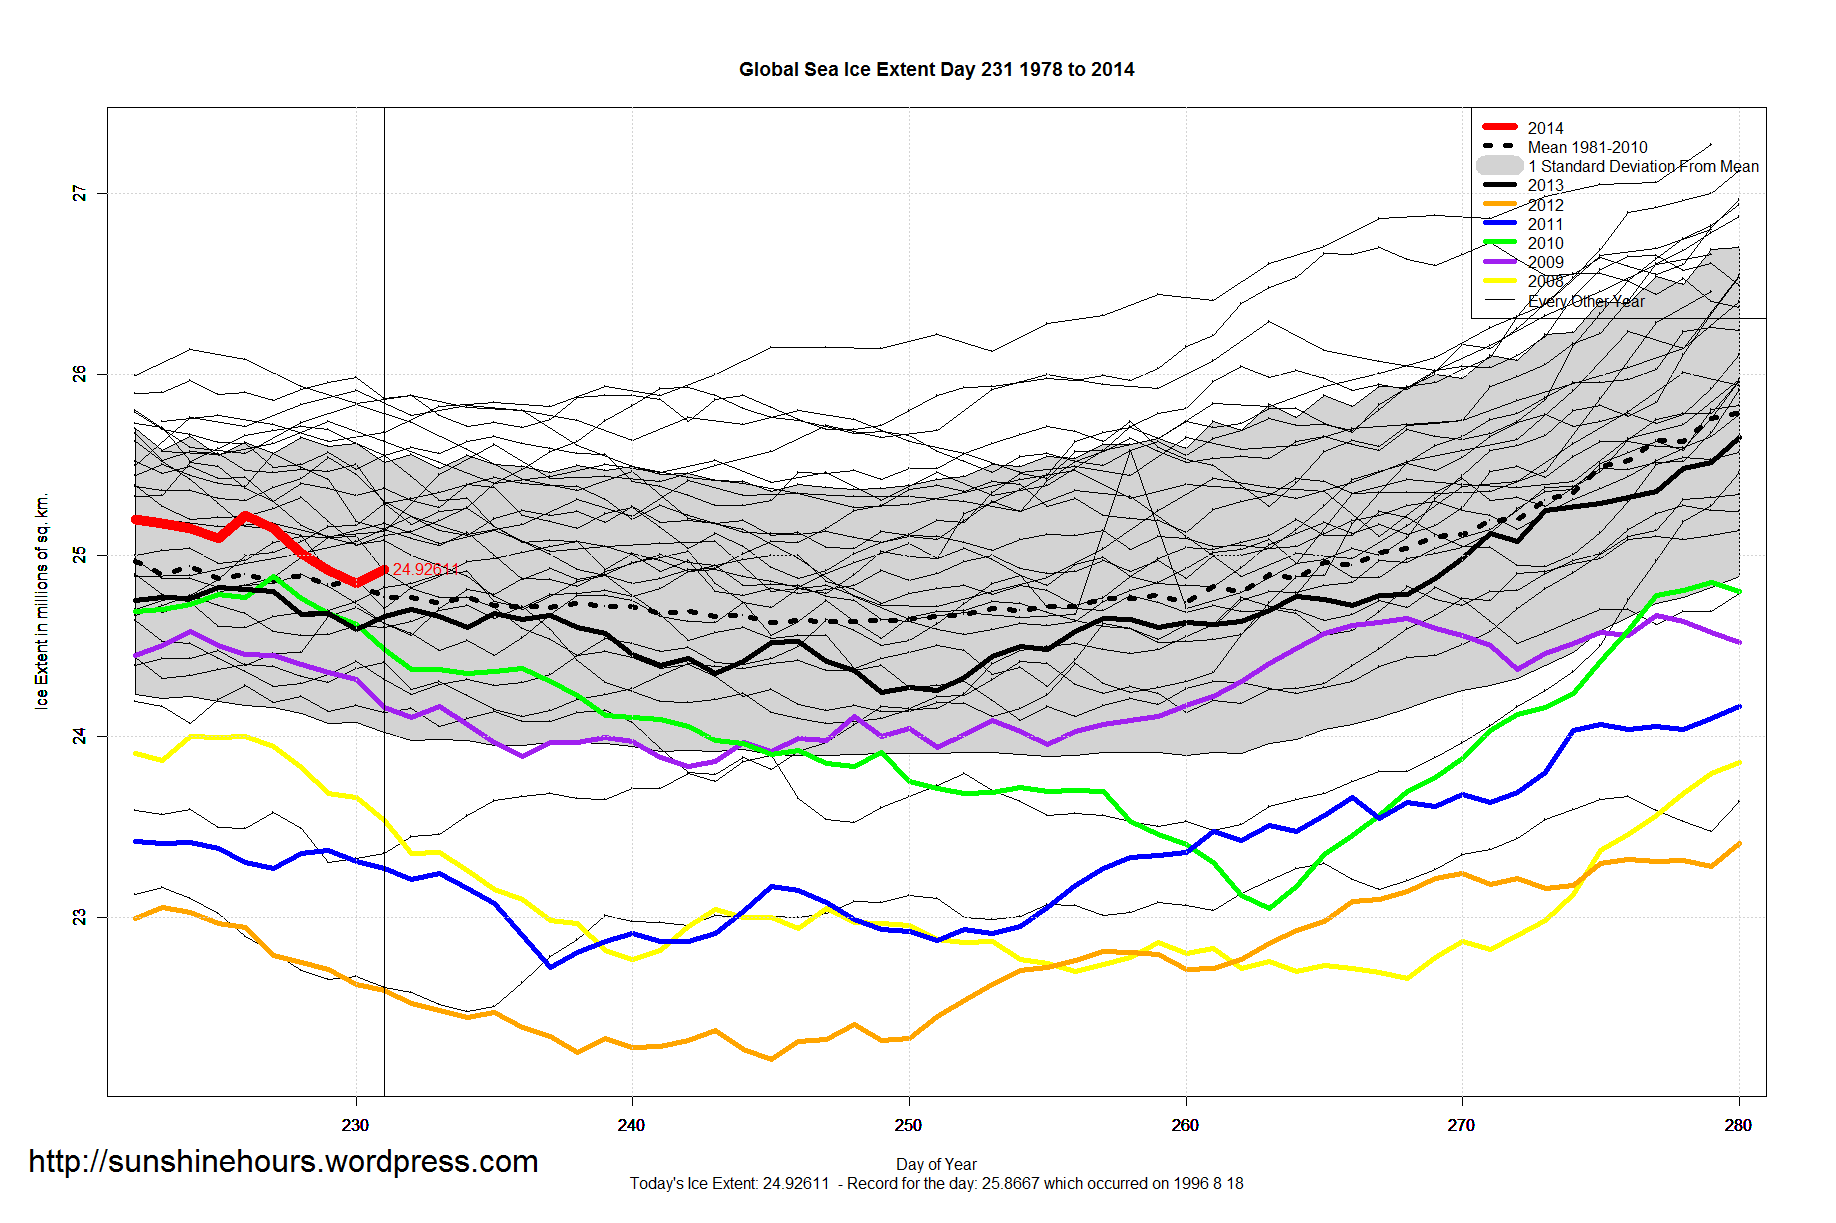

Global Sea Ice Extent Aug 20 2014 – 72,000 sq km above the 1981-2010 mean. Data for Day 231. Data here.
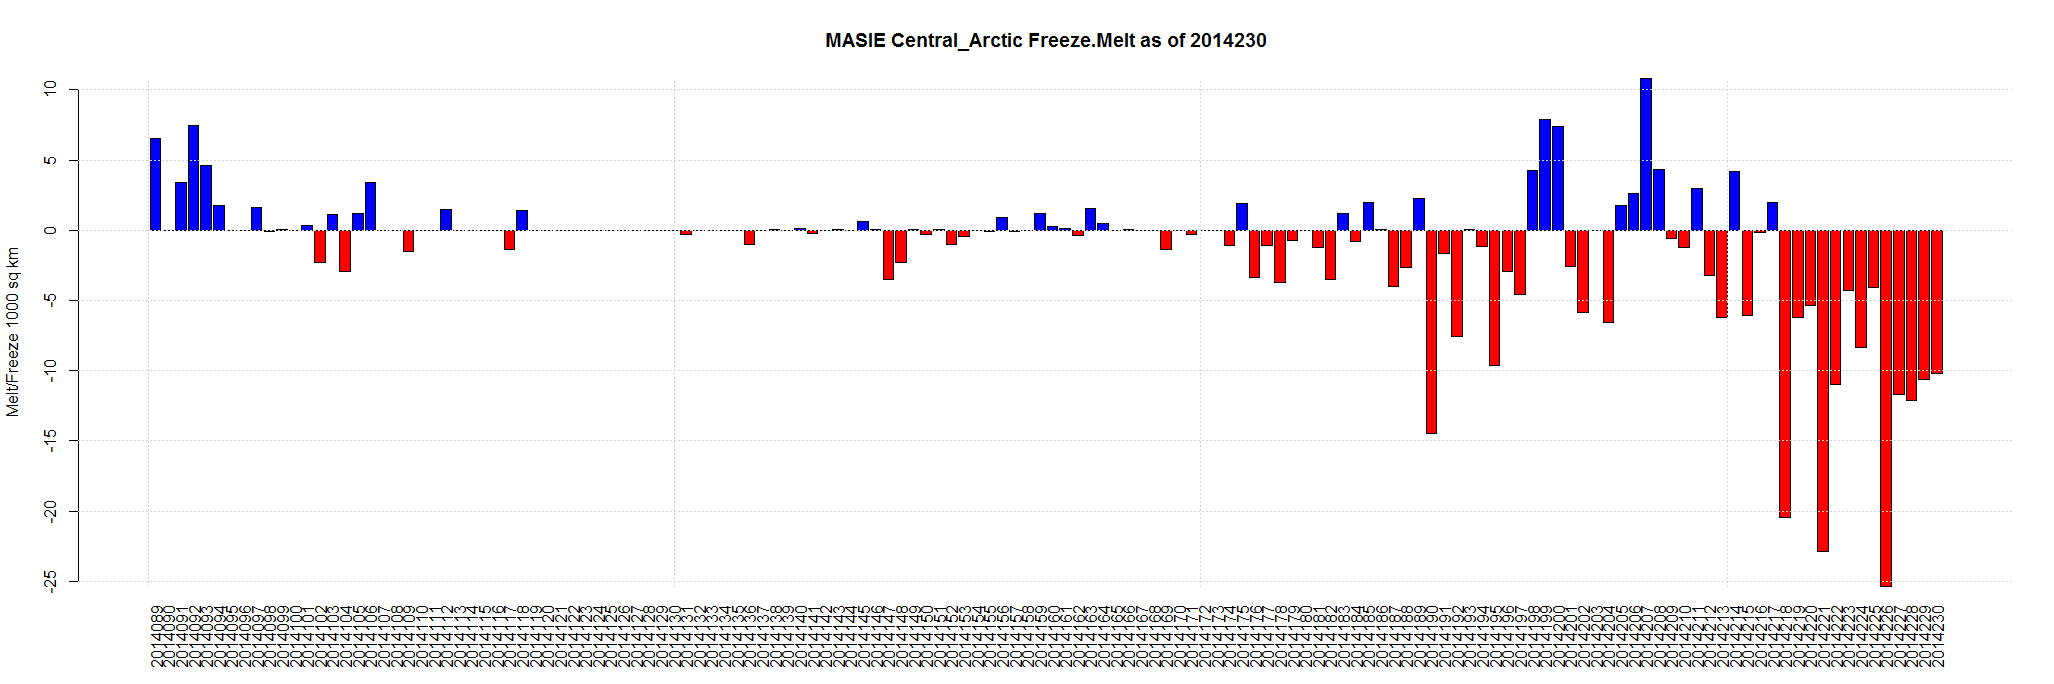
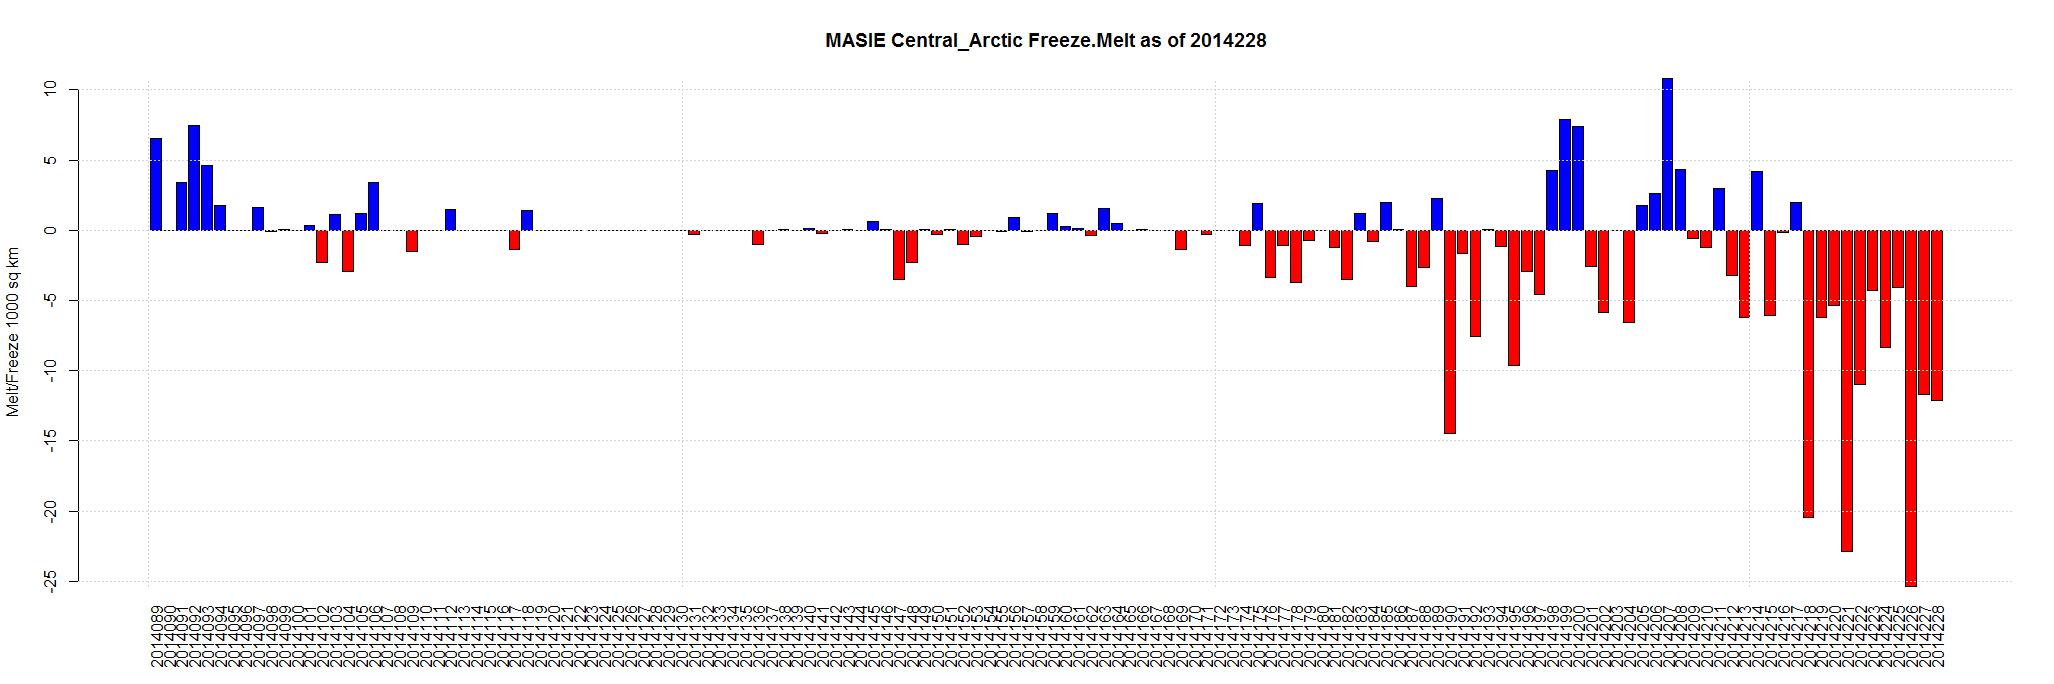
Aug 19 2014 MASIE Update – Steady Melting of 50-90,000 per day… Central Arctic is melting about 10,000 sq km a day.
Barents Sea and Hudson Bay gained a little. The others melted.
Data here. Click for bigger.


| Region | 143 days ago | End | Last 142 | Last 28 | Last 14 | Last 7 | Last 3 | Last 1 |
| Chukchi Sea | 966,006 | 451,054 | -514,952 | -196,322 | -132,562 | -60,477 | -38,712 | -25,174 |
| Kara Sea | 933,859 | 176,941 | -756,918 | -325,620 | -105,927 | -41,654 | -24,720 | -23,662 |
| East Siberian Sea | 1,087,137 | 614,618 | -472,519 | -393,816 | -271,650 | -114,642 | -36,467 | -18,278 |
| Beaufort Sea | 1,070,445 | 740,617 | -329,828 | -85,801 | -110,392 | -49,325 | -31,369 | -12,317 |
| Central Arctic | 3,221,921 | 3,048,063 | -173,859 | -148,166 | -150,667 | -82,382 | -32,976 | -10,189 |
| Laptev Sea | 897,845 | 38,226 | -859,618 | -339,295 | -160,087 | -88,108 | -13,869 | -4,904 |
| Canadian Archipelago | 853,214 | 520,280 | -332,934 | -188,066 | -139,484 | -54,230 | -18,578 | -3,264 |
| Baffin Bay Gulf of St. Lawrence | 1,688,530 | 9,776 | -1,678,754 | -113,716 | -49,006 | -15,600 | -4,171 | -2,031 |
| Greenland Sea | 603,416 | 251,200 | -352,215 | -145,190 | -94,814 | -33,511 | -29,644 | -1,374 |
| Bering Sea | 697,324 | 0 | -697,324 | -1,339 | 0 | 0 | 0 | 0 |
| Baltic Sea | 15,337 | 0 | -15,337 | 0 | 0 | 0 | 0 | 0 |
| Sea of Okhotsk | 853,240 | 0 | -853,240 | 0 | 0 | 0 | 0 | 0 |
| Yellow Sea | 0 | 0 | 0 | 0 | 0 | 0 | 0 | 0 |
| Barents Sea | 645,917 | 113,727 | -532,190 | 23,174 | 23,436 | 6,082 | 2,118 | 3,782 |
| Hudson Bay | 1,260,903 | 75,979 | -1,184,924 | -194,952 | -70,293 | -31,215 | -12,886 | 6,714 |
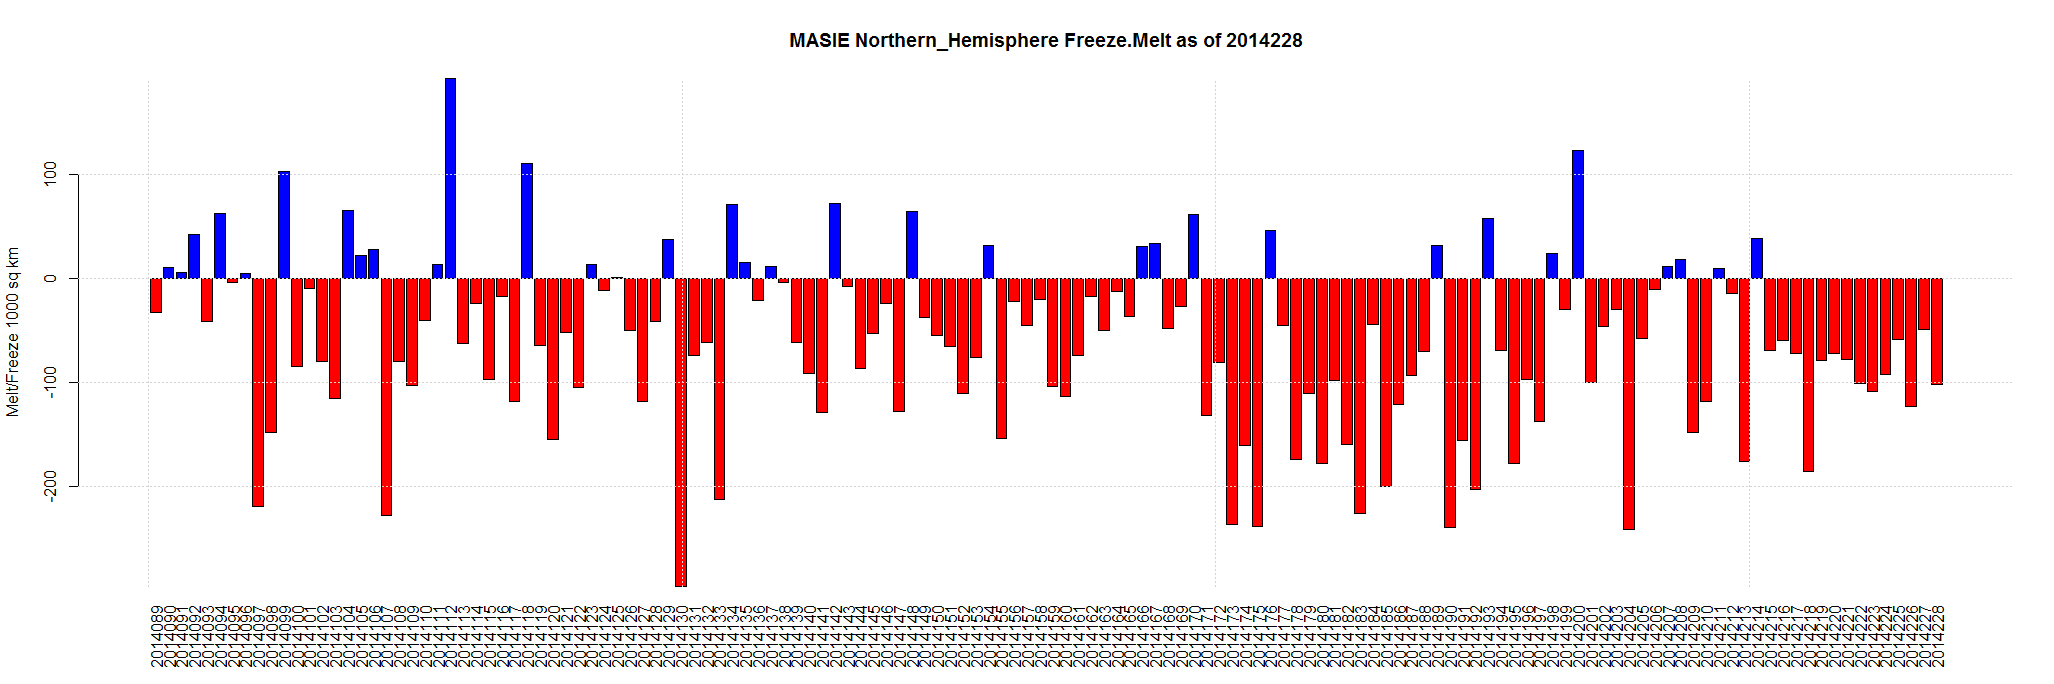
| Northern Hemisphere (Total) | 14,805,115 | 6,041,625 | -8,763,490 | -2,109,108 | -1,261,447 | -565,062 | -241,273 | -90,697 |
| NH (Average Loss per Day) | -61,283 | -75,325 | -90,103 | -80,723 | -80,424 | -90,697 |
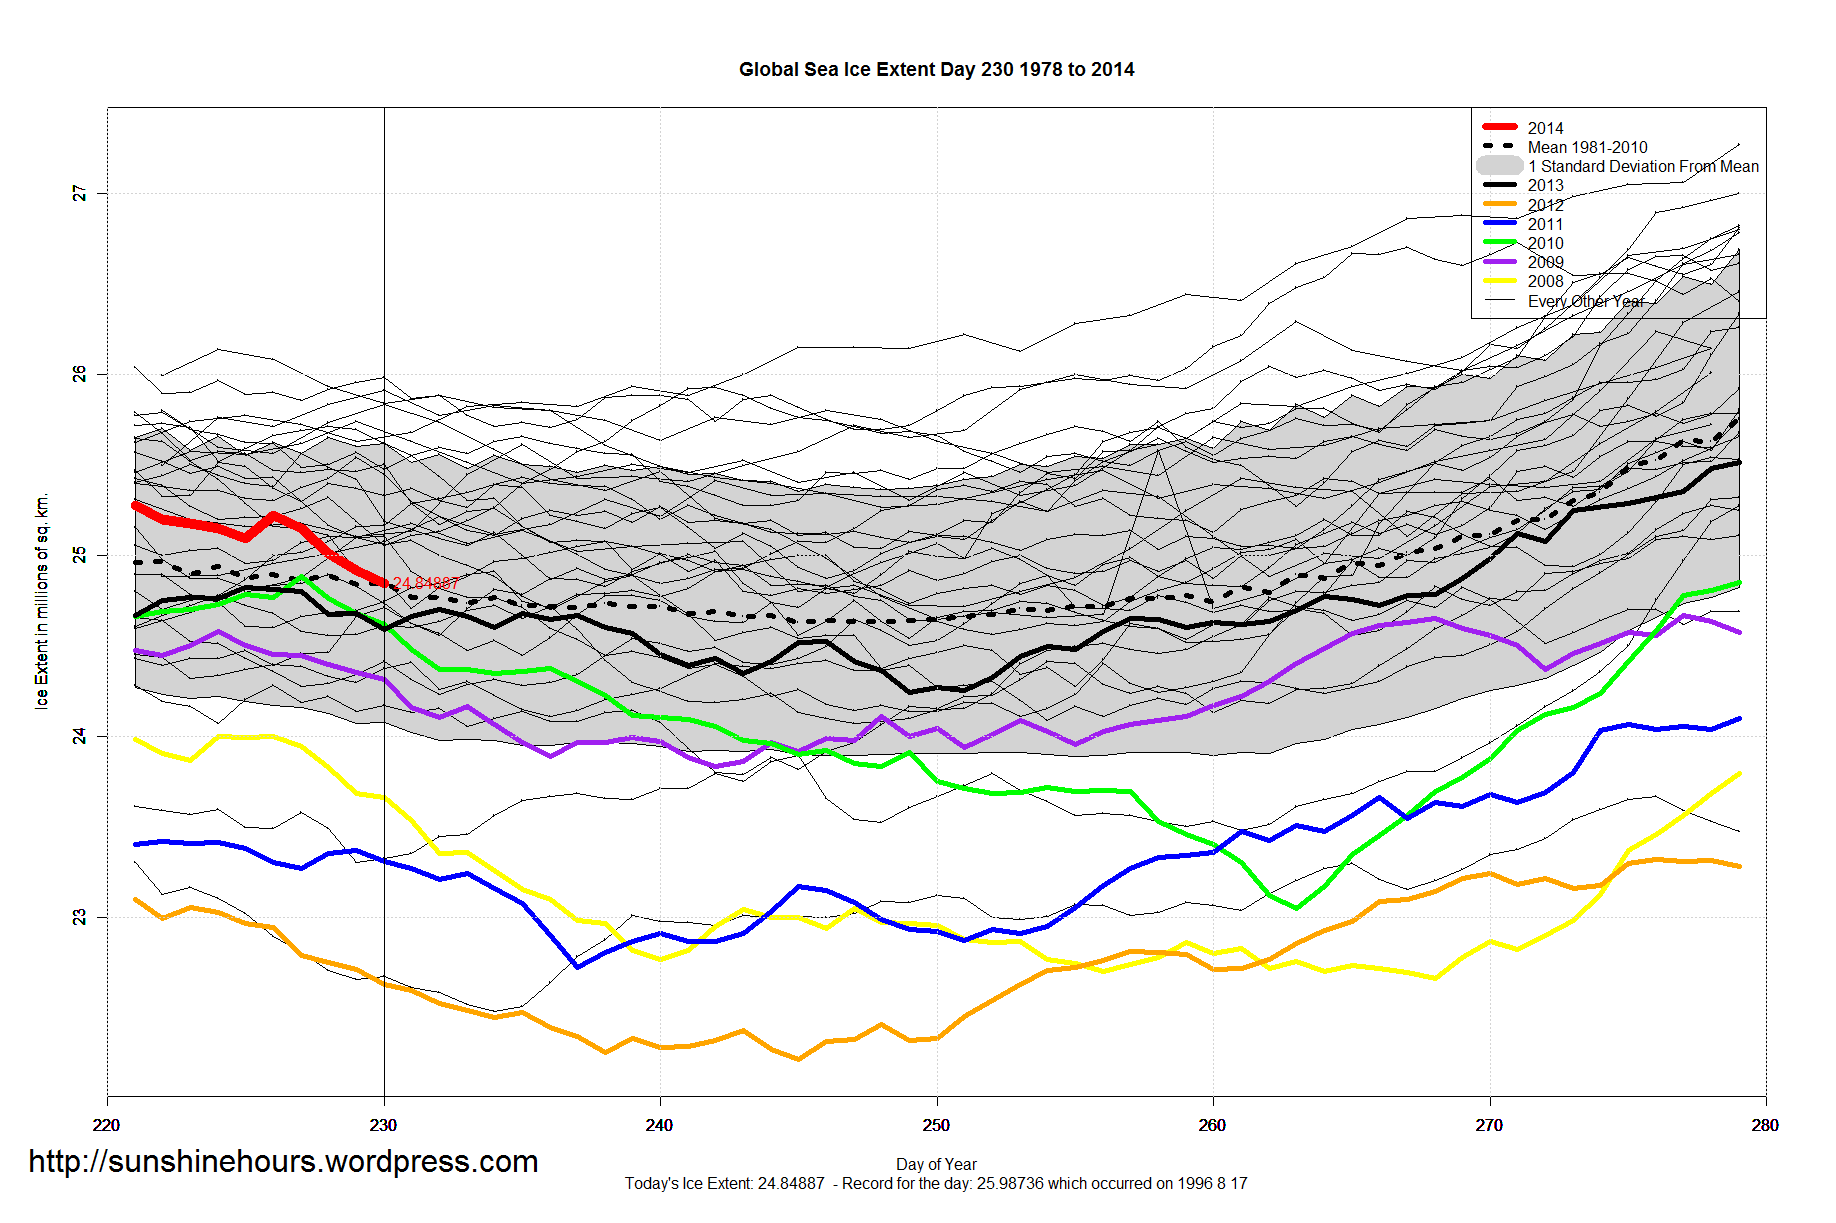
Arctic Sea Ice Extent Aug 19 2014 – -1,156,000 sq km below the 1981-2010 mean. Data for Day 230. Data here.


Global Sea Ice Extent Aug 19 2014 – -48,000 sq km below the 1981-2010 mean. Data for Day 230. Data here.

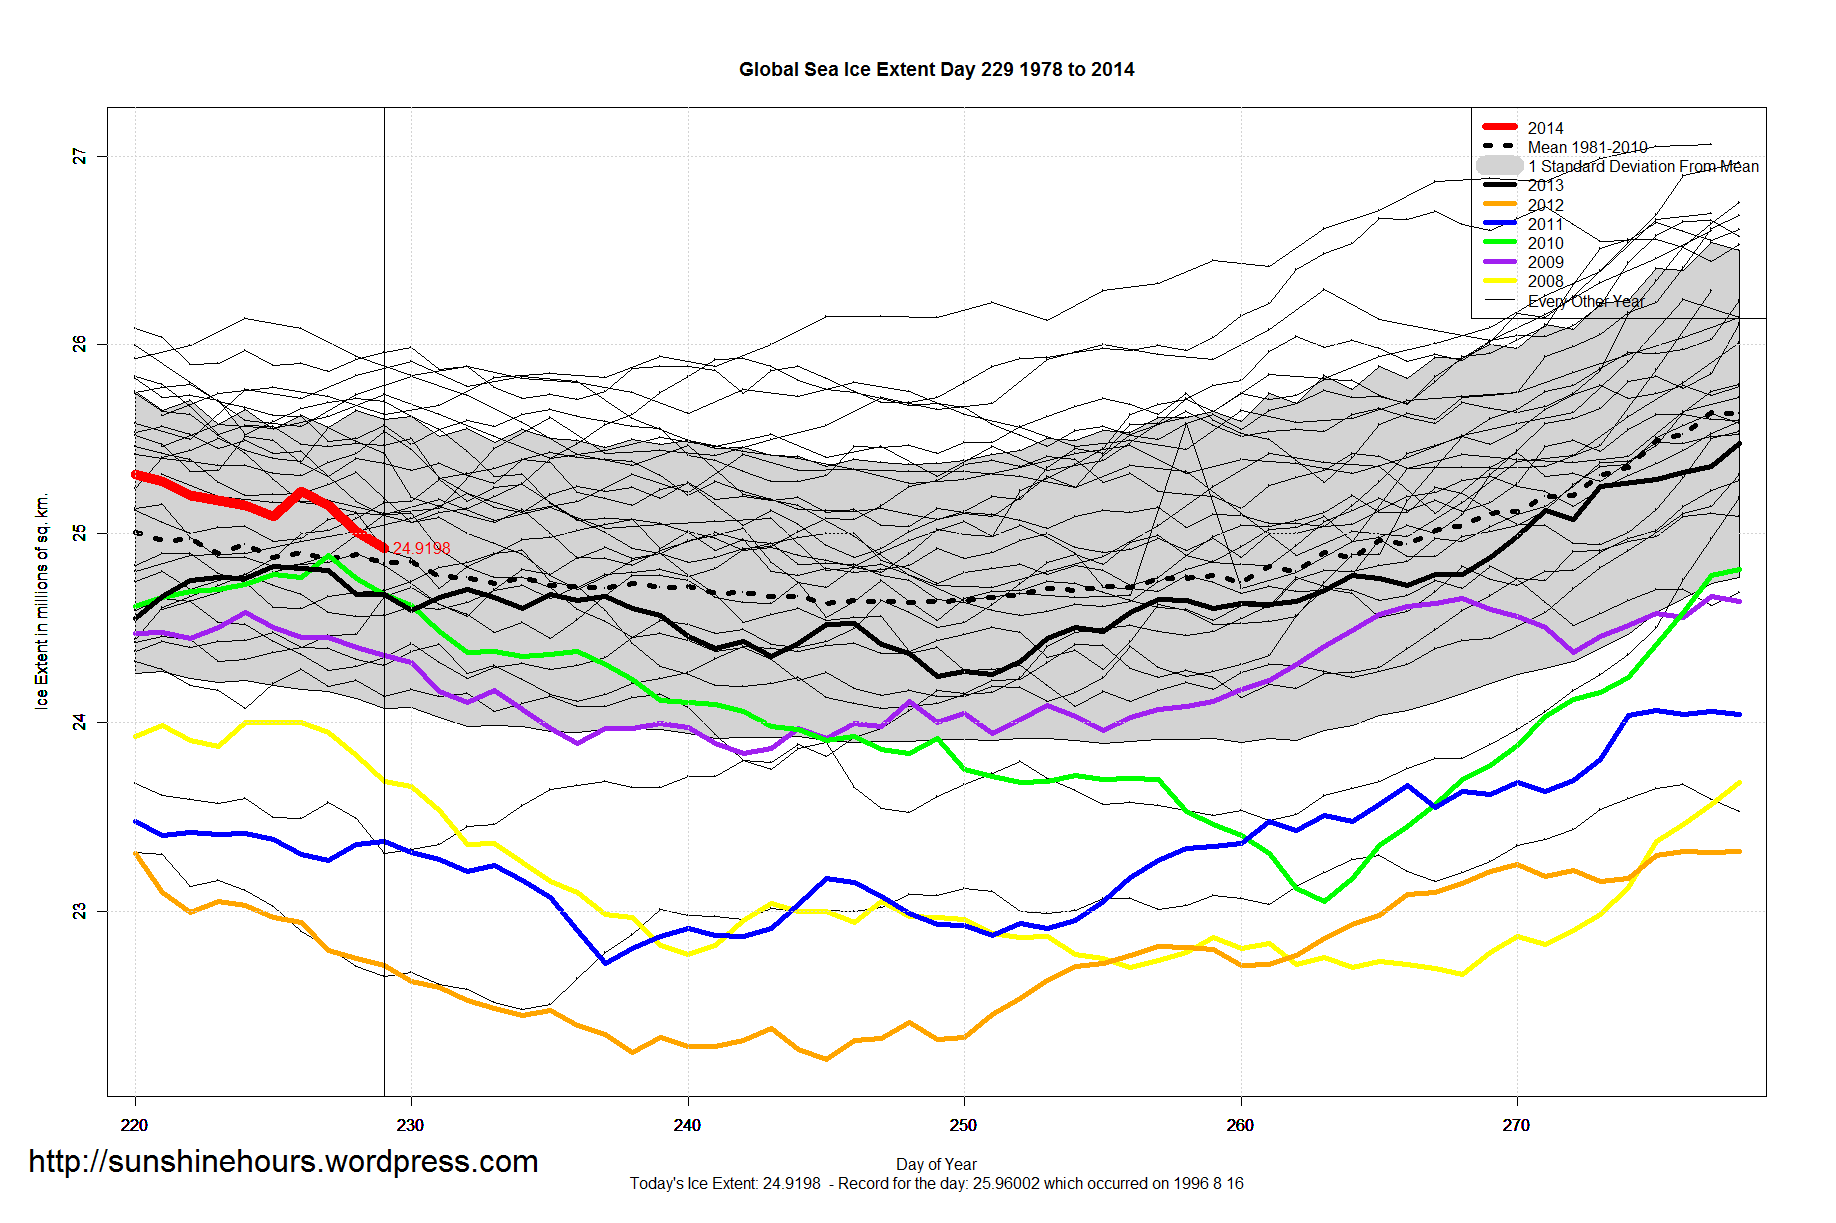
Arctic Sea Ice Extent Aug 18 2014 – -1,126,000 sq km below the 1981-2010 mean. Data for Day 229. Data here.


Global Sea Ice Extent Aug 18 2014 – 7,000 sq km above the 1981-2010 mean. Data for Day 229. Data here.

Aug 17 2014 MASIE Update – Steady Melting … Central Arctic is melting … But it has slowed from 25,000 sq km a day to 12,000 sq km over last two days
Barents Sea Has Been Gaining Ice For 4 Weeks
Data here. Click for bigger.

| Region | 141 days ago | End | Last 140 | Last 28 | Last 14 | Last 7 | Last 3 | Last 1 |
| East Siberian Sea | 1,087,137 | 628,671 | -458,466 | -384,338 | -266,834 | -162,919 | -67,657 | -22,414 |
| Chukchi Sea | 966,006 | 474,901 | -491,105 | -173,659 | -120,625 | -50,114 | -30,520 | -14,865 |
| Kara Sea | 933,859 | 187,131 | -746,729 | -340,810 | -128,957 | -37,596 | -19,812 | -14,531 |
| Greenland Sea | 603,416 | 266,843 | -336,573 | -152,927 | -85,187 | -29,463 | -13,195 | -14,002 |
| Central Arctic | 3,221,921 | 3,068,880 | -153,041 | -135,772 | -136,108 | -76,857 | -49,178 | -12,159 |
| Canadian Archipelago | 853,214 | 527,779 | -325,436 | -182,407 | -150,443 | -77,063 | -25,564 | -11,079 |
| Beaufort Sea | 1,070,445 | 763,810 | -306,635 | -72,831 | -89,839 | -40,159 | -25,655 | -8,176 |
| Laptev Sea | 897,845 | 48,385 | -849,459 | -342,570 | -164,653 | -103,114 | -30,296 | -3,710 |
| Baffin Bay Gulf of St. Lawrence | 1,688,530 | 12,597 | -1,675,933 | -133,960 | -59,951 | -33,765 | -8,108 | -1,350 |
| Hudson Bay | 1,260,903 | 87,721 | -1,173,183 | -209,363 | -67,147 | -40,296 | -5,414 | -1,144 |
| Bering Sea | 697,324 | 0 | -697,324 | -787 | 0 | 0 | 0 | 0 |
| Baltic Sea | 15,337 | 0 | -15,337 | 0 | 0 | 0 | 0 | 0 |
| Sea of Okhotsk | 853,240 | 0 | -853,240 | 0 | 0 | 0 | 0 | 0 |
| Yellow Sea | 0 | 0 | 0 | 0 | 0 | 0 | 0 | 0 |
| Barents Sea | 645,917 | 112,870 | -533,047 | 13,781 | 18,252 | 16,257 | 716 | 1,261 |
| Northern Hemisphere (Total) | 14,805,115 | 6,180,730 | -8,624,384 | -2,115,642 | -1,251,492 | -635,089 | -274,684 | -102,168 |
| NH (Average Loss per Day) | -61,166 | -75,559 | -89,392 | -90,727 | -91,561 | -102,168 |
Arctic Sea Ice Extent Aug 17 2014 – -1,102,000 sq km below the 1981-2010 mean. Data for Day 228. Data here.


Global Sea Ice Extent Aug 17 2014 – 85,000 sq km above the 1981-2010 mean. Data for Day 228. Data here.


Arctic Sea Ice Extent Aug 16 2014 – -1,055,000 sq km above the 1981-2010 mean. Data for Day 227. Data here.


