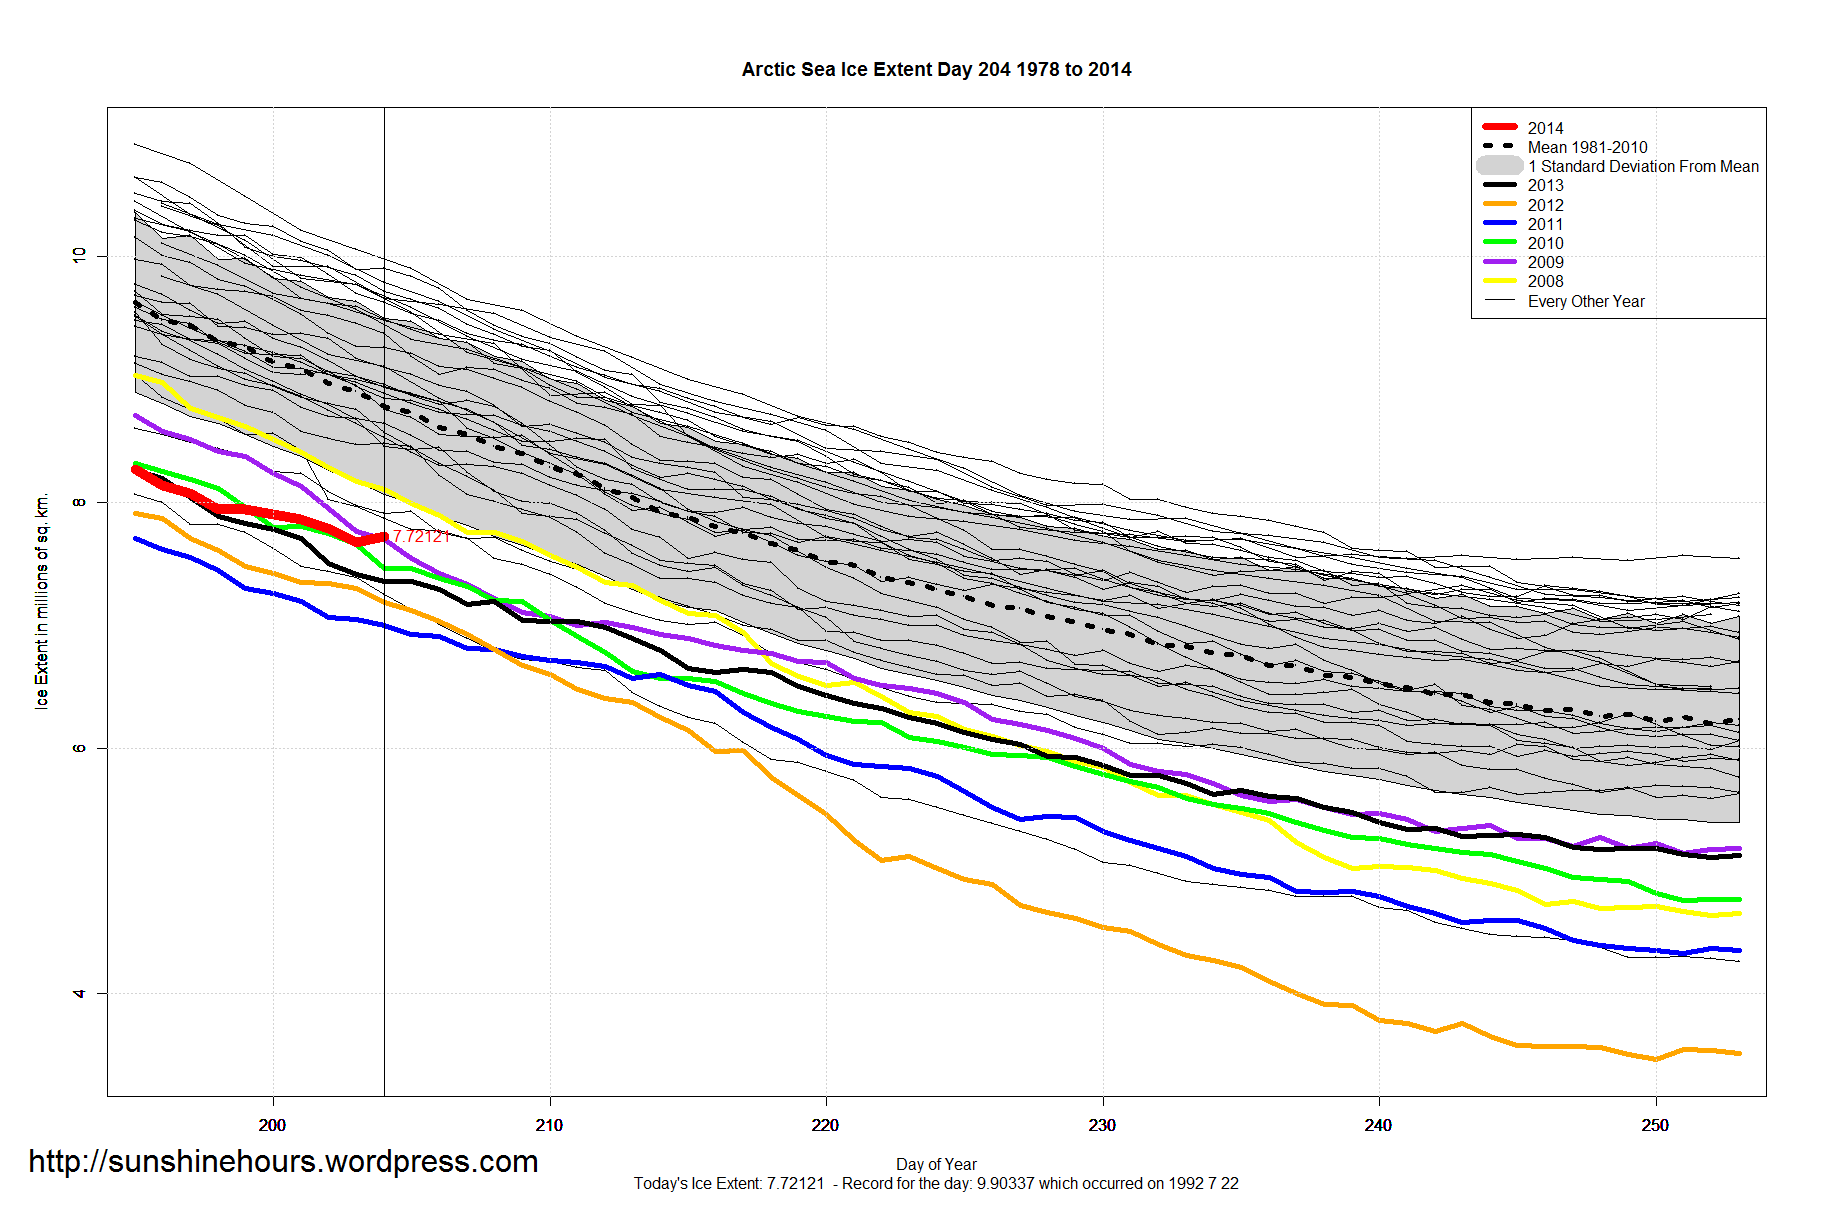
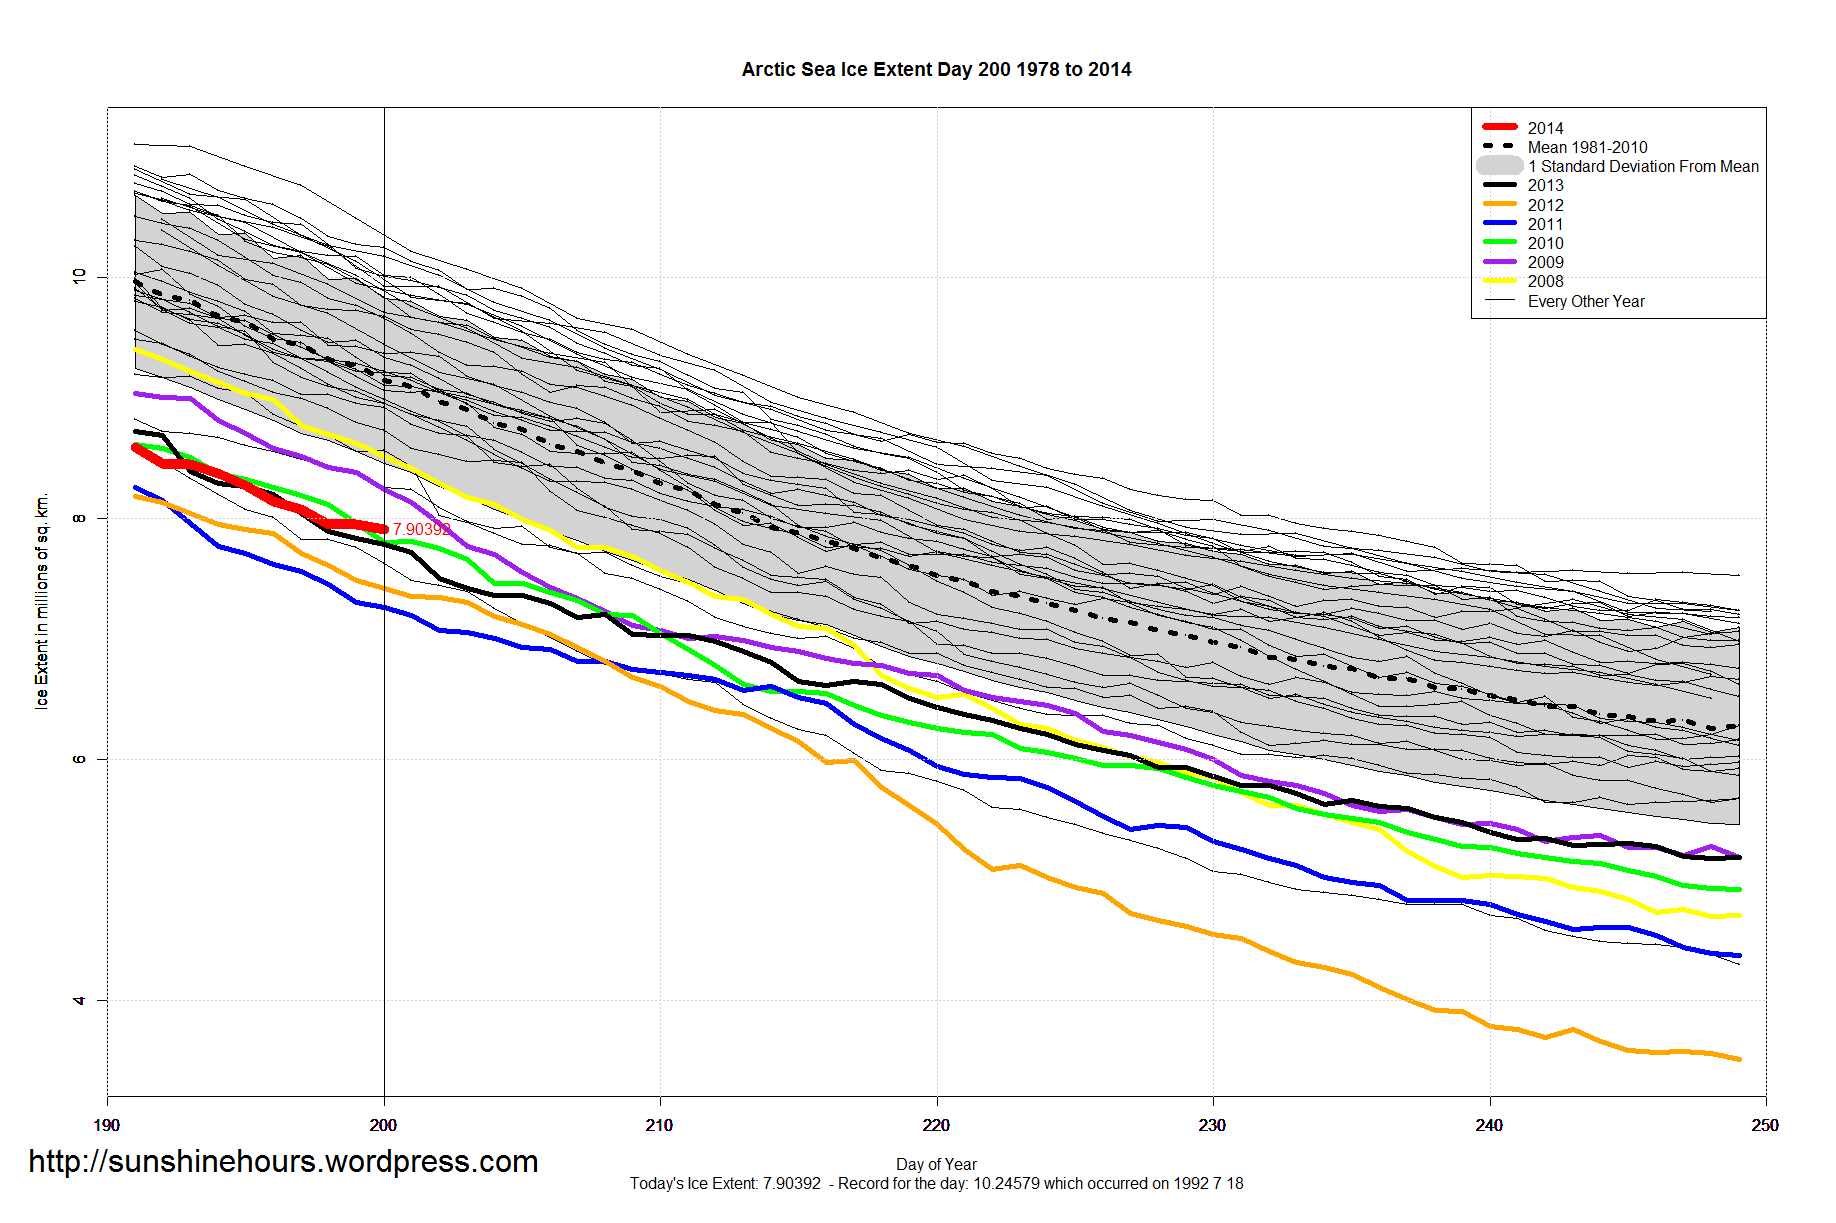
In 2011 Arctic Sea Ice Extent on day 205 was 6.9 million sq km. In 2014, on the same day, it is 7.7 million sq km. That is 800,000 sq km higher.

In 2011 Arctic Sea Ice Extent on day 205 was 6.9 million sq km. In 2014, on the same day, it is 7.7 million sq km. That is 800,000 sq km higher.
Arctic Sea Ice Extent rose 50,000 sq km. Not unprecedented. But not normal this time of year.
July 22 2014 MASIE Update – It’s Melting … Slowly
Data here.
| Region | 115 days ago | End | Last 114 | Last 28 | Last 14 | Last 7 | Last 3 | Last 1 |
| Baffin Bay Gulf of St. Lawrence | 1,688,530 | 123,492 | -1,565,038 | -652,978 | -127,245 | -26,848 | -3,535 | -17,394 |
| Greenland Sea | 603,416 | 396,390 | -207,026 | -164,696 | -47,450 | -22,904 | -13,055 | -13,648 |
| Hudson Bay | 1,260,903 | 270,931 | -989,972 | -766,723 | -339,427 | -88,068 | -19,081 | -8,476 |
| Central Arctic | 3,221,921 | 3,196,228 | -25,693 | -44,670 | -28,590 | 3,595 | -1,055 | -5,836 |
| Canadian Archipelago | 853,214 | 708,346 | -144,868 | -52,022 | -28,522 | -20,550 | 2,704 | -625 |
| Beaufort Sea | 1,070,445 | 826,418 | -244,027 | -144,617 | -51,017 | 14,100 | 13,907 | 0 |
| Chukchi Sea | 966,006 | 647,376 | -318,630 | -103,683 | -62,339 | 2,558 | 9,154 | 0 |
| East Siberian Sea | 1,087,137 | 1,008,434 | -78,703 | -29,672 | -4,512 | 31,517 | 24,168 | 0 |
| Laptev Sea | 897,845 | 377,521 | -520,324 | -297,742 | -111,211 | -35,448 | 17,560 | 0 |
| Kara Sea | 933,859 | 502,562 | -431,298 | -354,916 | -190,871 | -113,700 | -43,426 | 0 |
| Barents Sea | 645,917 | 90,553 | -555,364 | -87,952 | -19,557 | -14 | -3,460 | 0 |
| Bering Sea | 697,324 | 1,339 | -695,985 | -31,750 | -8,073 | -6,560 | -6,006 | 0 |
| Baltic Sea | 15,337 | 0 | -15,337 | 0 | 0 | 0 | 0 | 0 |
| Sea of Okhotsk | 853,240 | 0 | -853,240 | -32 | 0 | 0 | 0 | 0 |
| Yellow Sea | 0 | 0 | 0 | 0 | 0 | 0 | 0 | 0 |
| Northern Hemisphere (Total) | 14,805,115 | 8,150,732 | -6,654,382 | -2,731,837 | -1,019,182 | -262,323 | -22,124 | -45,979 |
| NH (Average Loss per Day) | -57,864 | -97,566 | -72,799 | -37,475 | -7,375 | -45,979 |

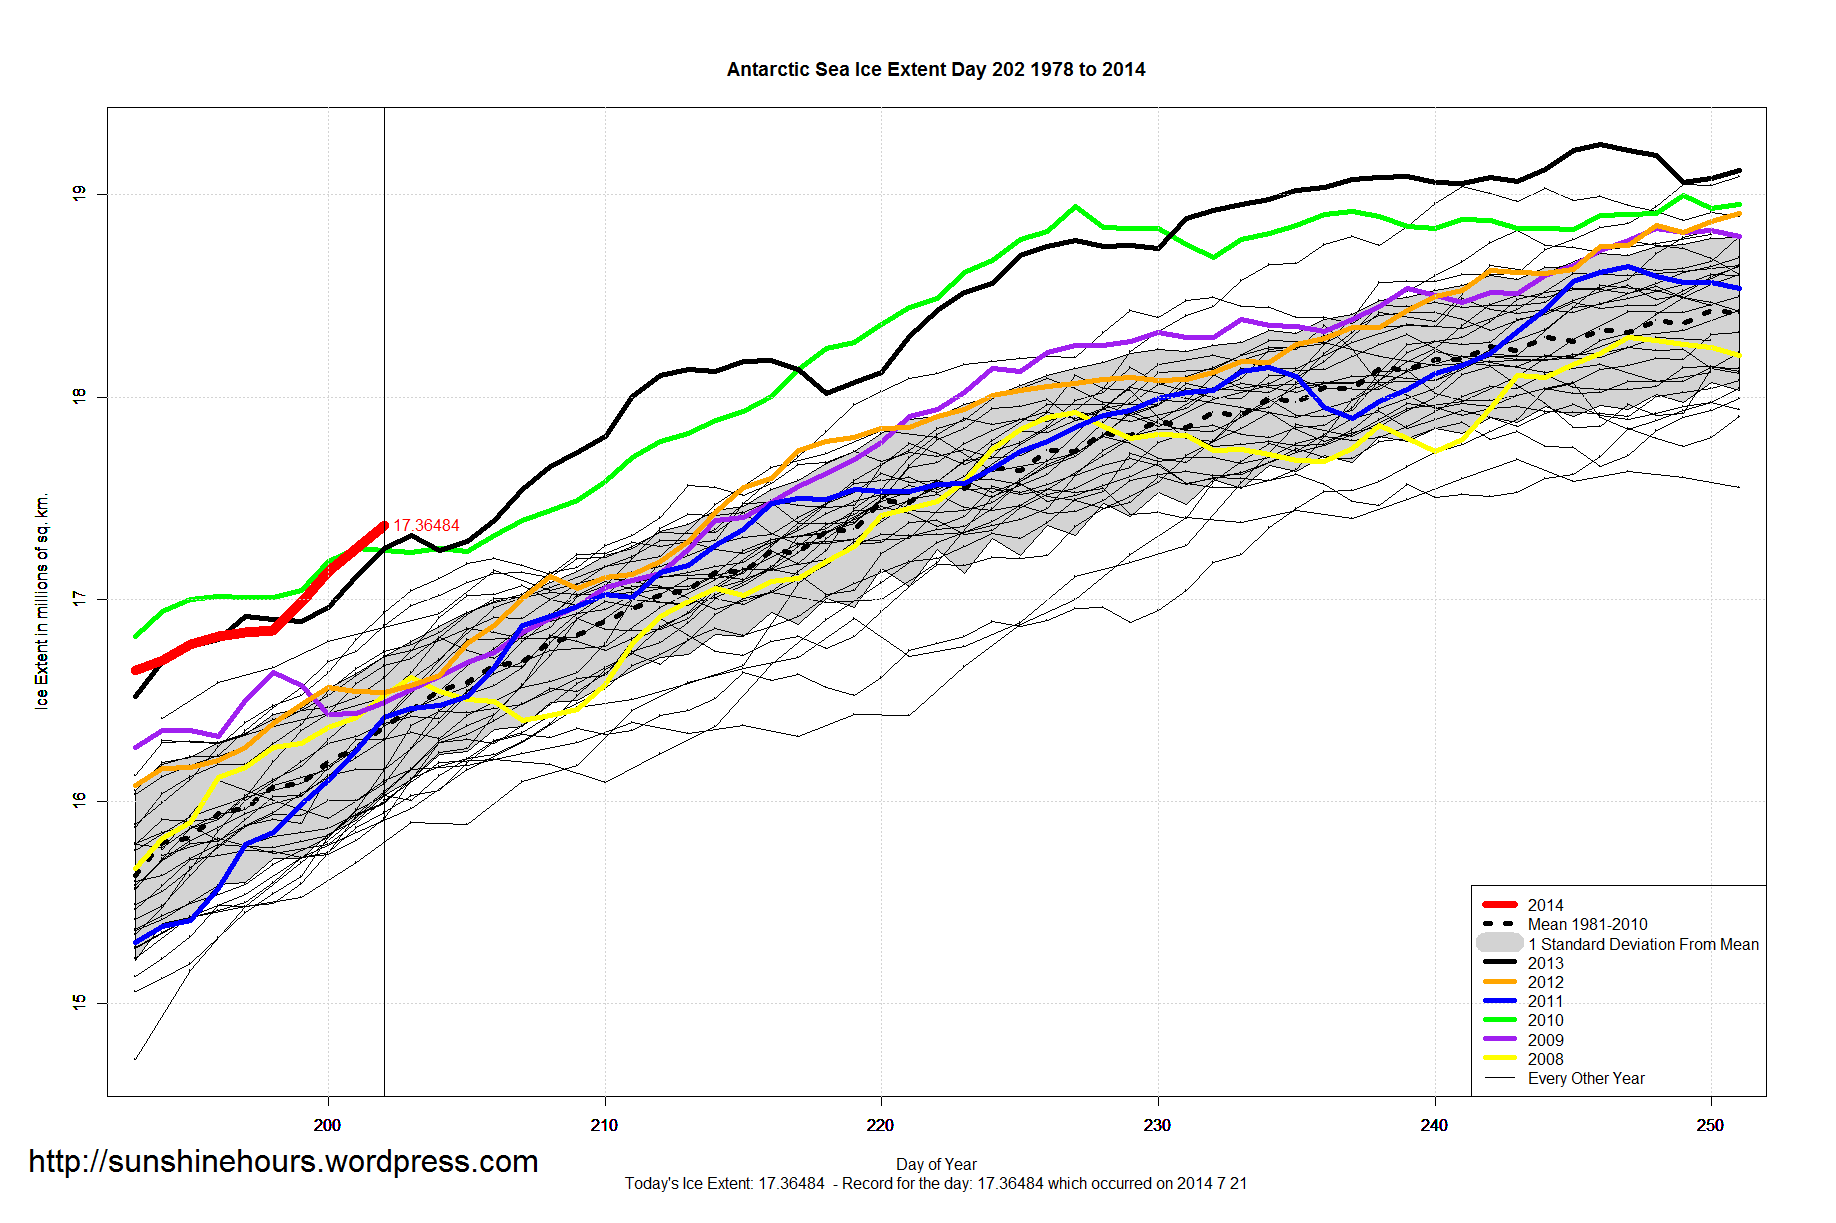
After 11 days of 2nds and 3rds, Antarctica Sets Another Daily Record
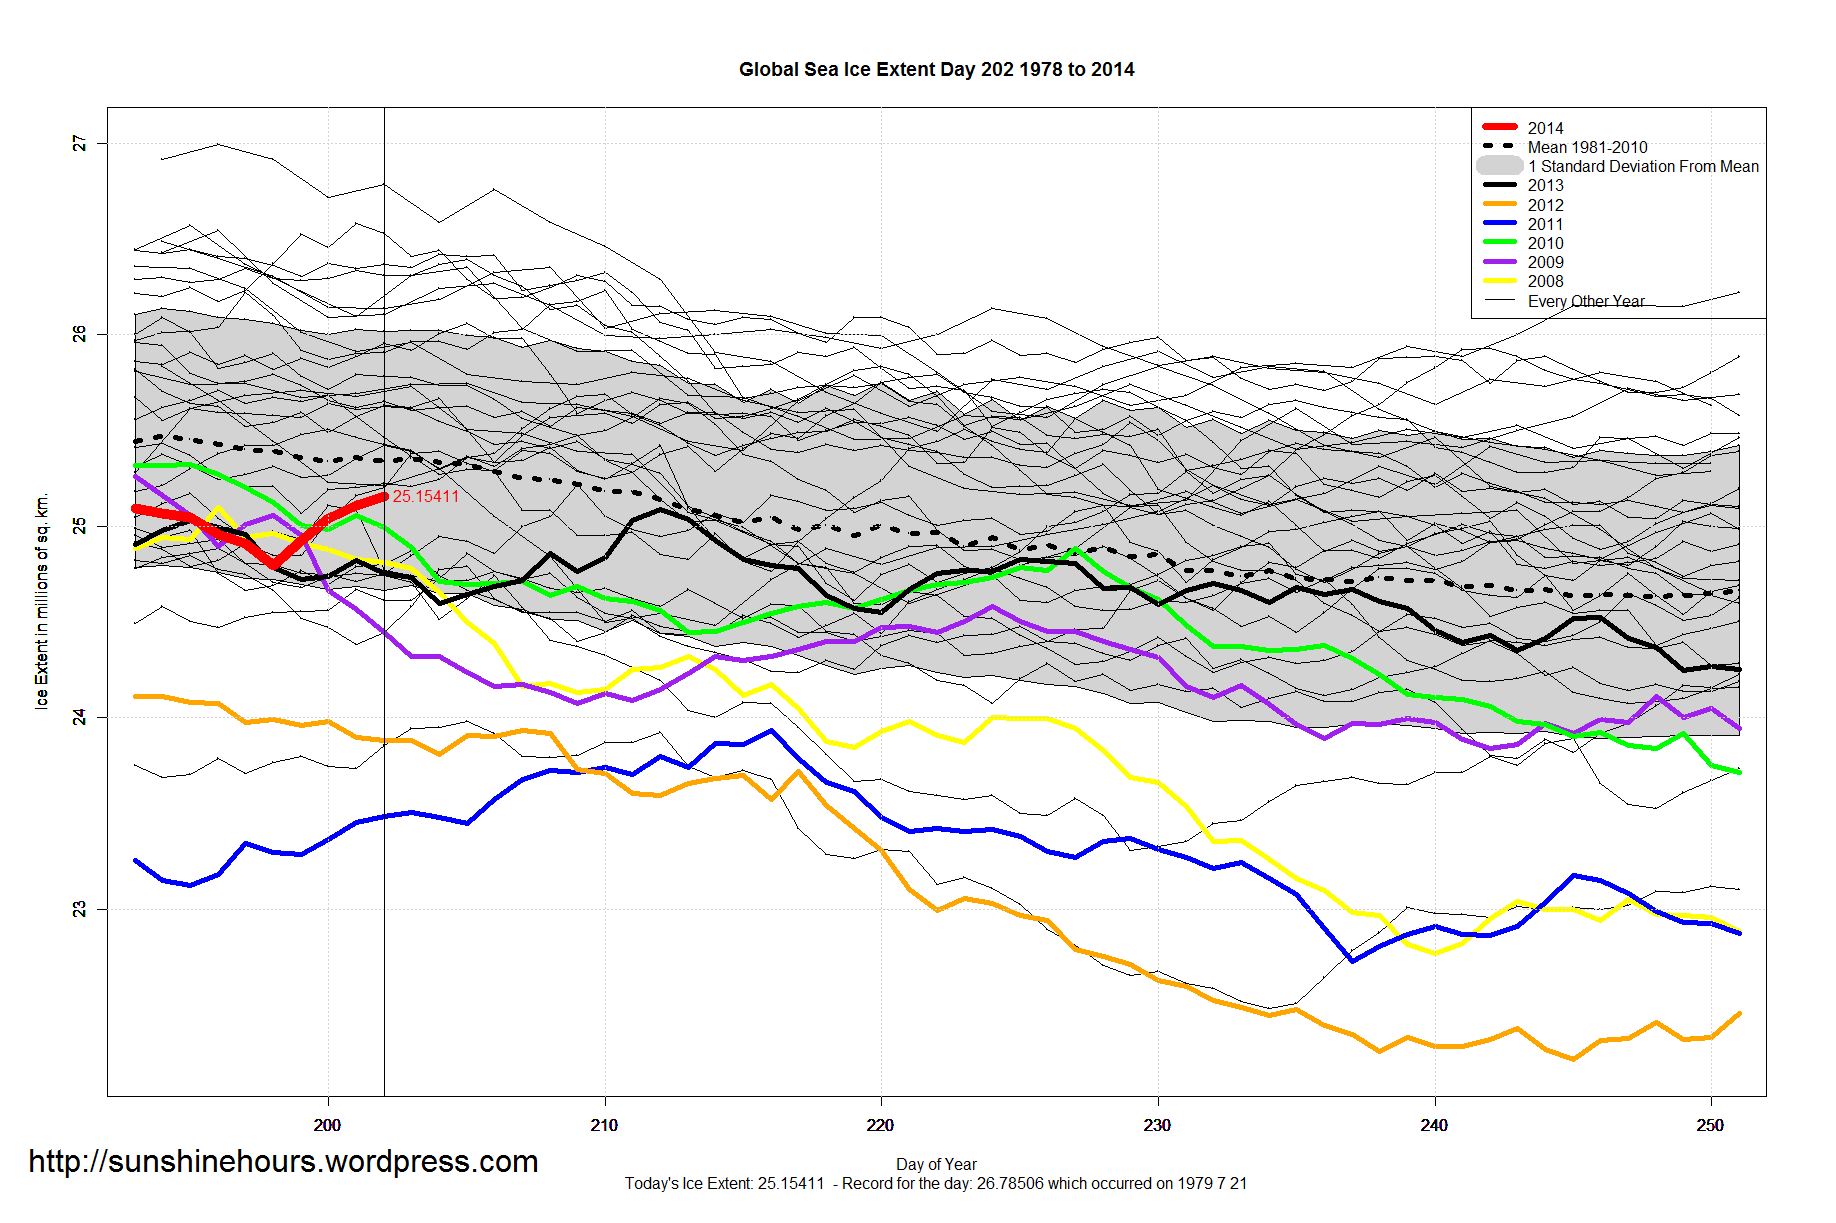
A quick update for sea ice extent for day 202 of 2014
NOAA Data here and here here. Graphs below. Click for bigger.

July 21 2014 MASIE Update – Melting Resumed (But 3 day total is only -5,585 sq km)
Data here.
| Region | 114 days ago | End | Last 113 | Last 28 | Last 14 | Last 7 | Last 3 | Last 1 |
| Kara Sea | 933,859 | 502,562 | -431,298 | -352,550 | -200,441 | -152,850 | -67,062 | -25,379 |
| Hudson Bay | 1,260,903 | 279,408 | -981,496 | -777,711 | -337,130 | -127,556 | -14,200 | -17,676 |
| Laptev Sea | 897,845 | 377,521 | -520,324 | -312,976 | -120,793 | -46,262 | 2,948 | -13,434 |
| Beaufort Sea | 1,070,445 | 826,418 | -244,027 | -145,567 | -53,173 | -14,172 | 13,907 | -10,223 |
| Greenland Sea | 603,416 | 410,038 | -193,378 | -214,522 | -39,589 | -27,864 | -241 | -9,732 |
| Barents Sea | 645,917 | 90,553 | -555,364 | -82,539 | -24,342 | -8,021 | -2,214 | -8,536 |
| Baffin Bay Gulf of St. Lawrence | 1,688,530 | 140,886 | -1,547,645 | -658,801 | -148,154 | -22,022 | 18,536 | -5,671 |
| East Siberian Sea | 1,087,137 | 1,008,434 | -78,703 | -37,704 | -2,112 | 34,777 | 23,571 | -4,575 |
| Central Arctic | 3,221,921 | 3,202,064 | -19,857 | -39,954 | -25,419 | -186 | 12,693 | -2,588 |
| Canadian Archipelago | 853,214 | 708,971 | -144,243 | -54,767 | -29,084 | -19,808 | 3,329 | -1,214 |
| Chukchi Sea | 966,006 | 647,376 | -318,630 | -133,789 | -55,037 | -3,477 | 9,154 | -1,183 |
| Baltic Sea | 15,337 | 0 | -15,337 | 0 | 0 | 0 | 0 | 0 |
| Sea of Okhotsk | 853,240 | 0 | -853,240 | -32 | 0 | 0 | 0 | 0 |
| Yellow Sea | 0 | 0 | 0 | 0 | 0 | 0 | 0 | 0 |
| Bering Sea | 697,324 | 1,339 | -695,985 | -35,479 | -8,073 | -7,320 | -6,006 | 552 |
| Northern Hemisphere (Total) | 14,805,115 | 8,196,711 | -6,608,403 | -2,846,777 | -1,043,714 | -394,760 | -5,585 | -99,660 |
| NH (Average Loss per Day) | -57,968 | -101,671 | -74,551 | -56,394 | -1,862 | -99,660 |
Antarctica only 2180 sq km Below Record for the Day.
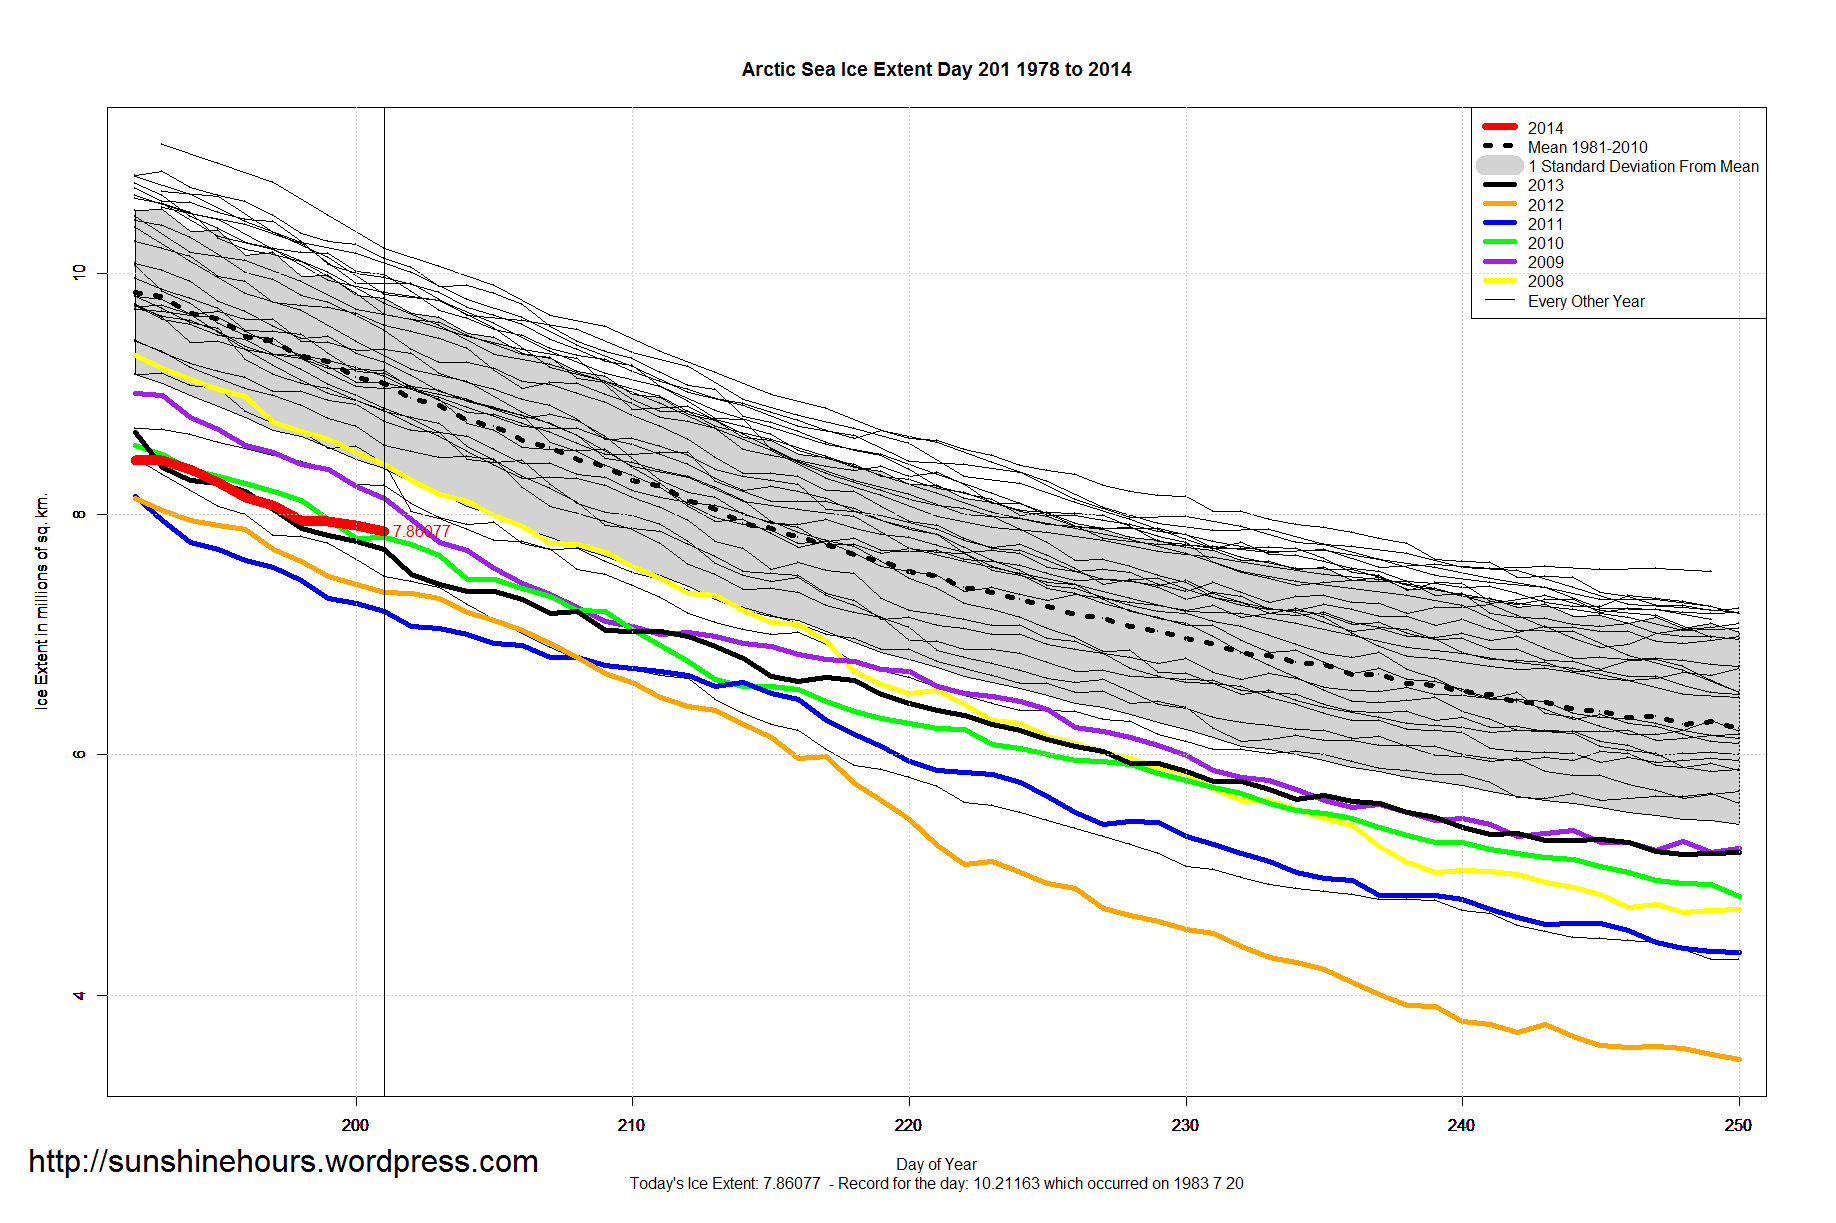
Arctic 660,000 sq km above the lowest extent for the day — 2011.
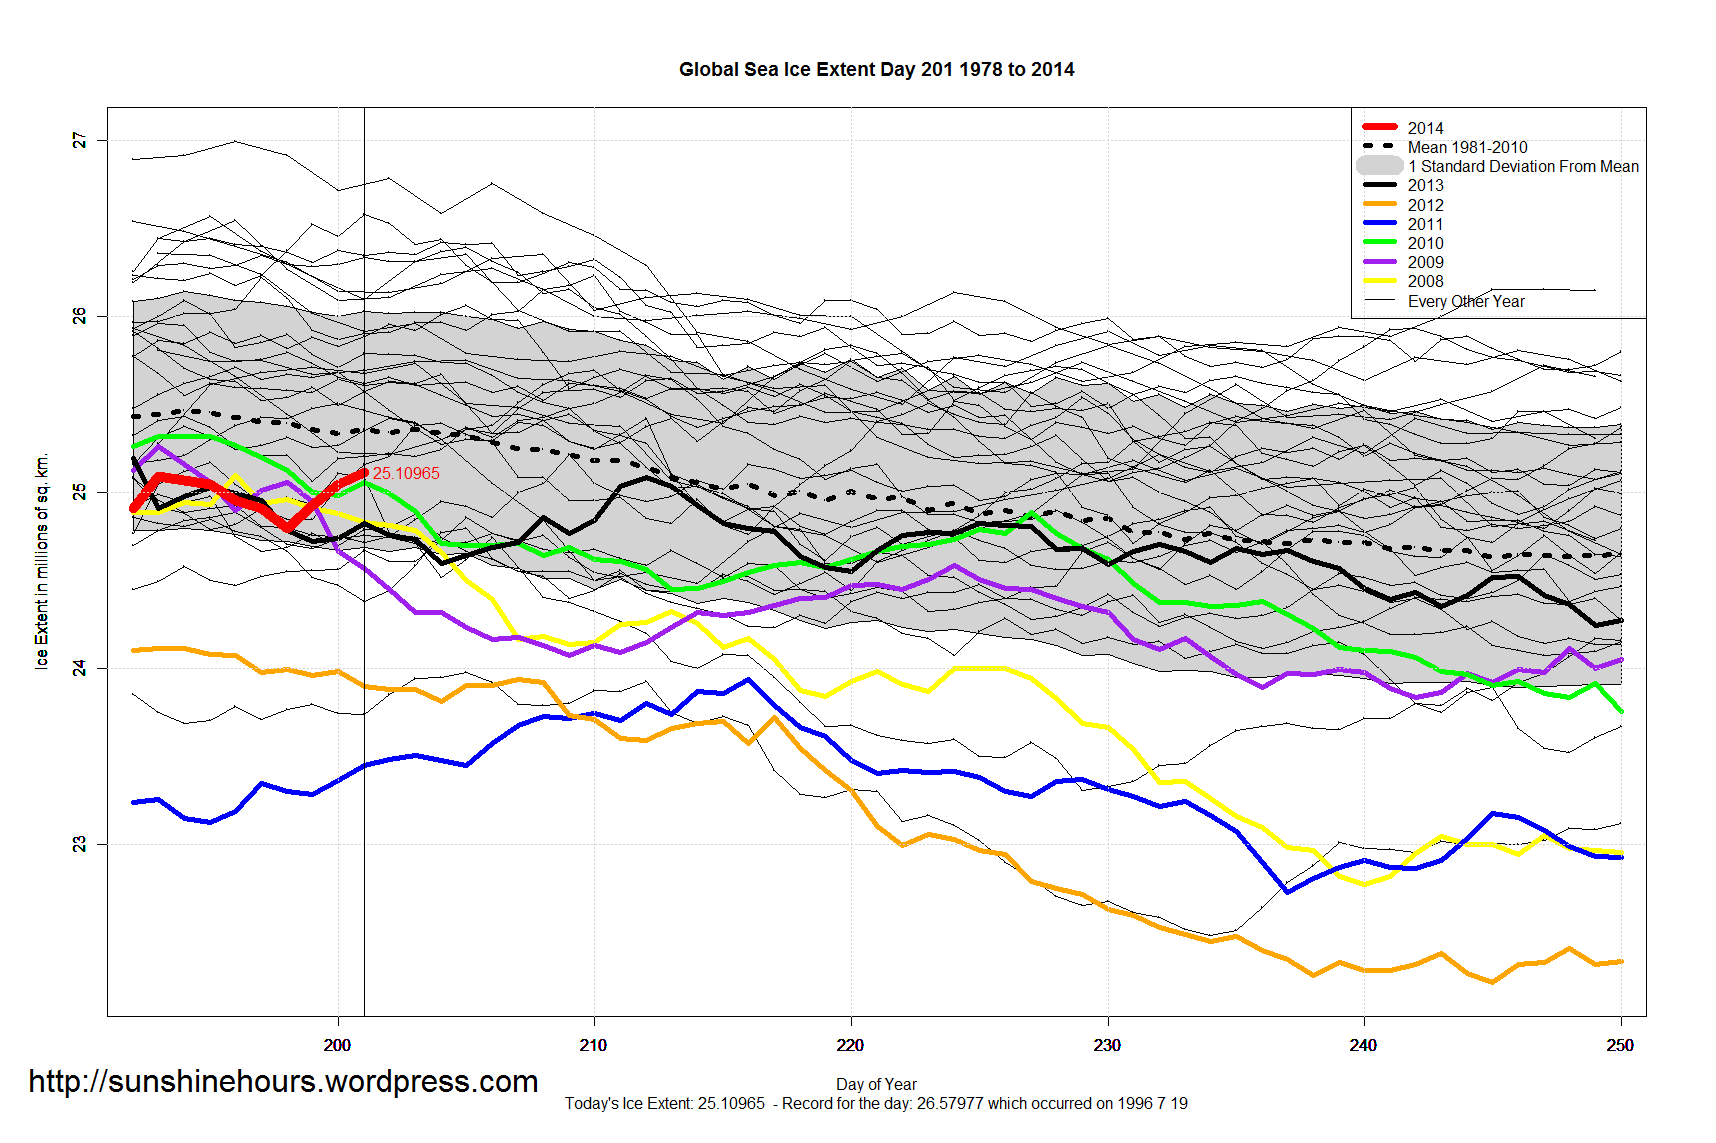
A quick update for sea ice extent for day 201 of 2014
NOAA Data here and here here. Graphs below. Click for bigger.

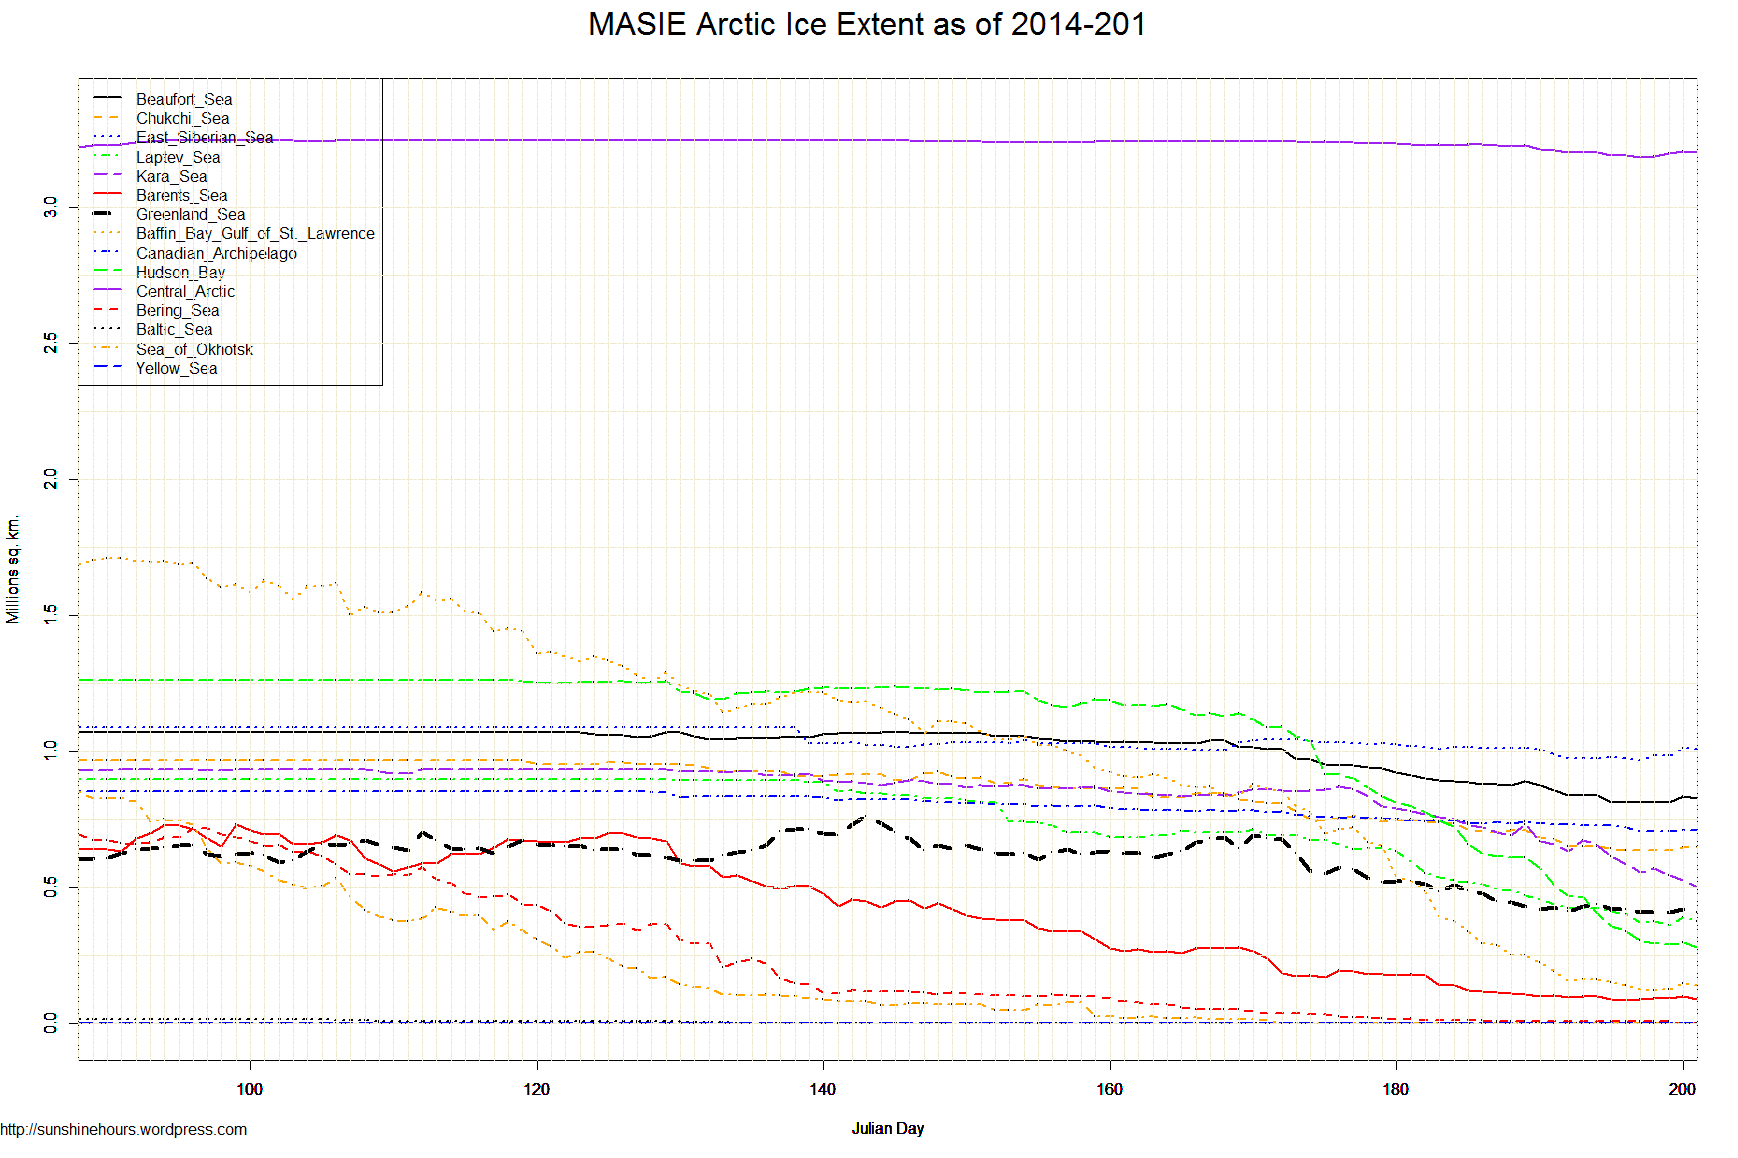
July 20 2014 MASIE Update – Big Freeze in most regions.
Data here.
| Region | 113 days ago | End | Last 112 | Last 28 | Last 14 | Last 7 | Last 3 | Last 1 |
| Kara Sea | 933,859 | 527,941 | -405,918 | -328,098 | -193,817 | -143,836 | -29,090 | -18,047 |
| Bering Sea | 697,324 | 787 | -696,537 | -36,031 | -12,618 | -7,871 | -6,558 | -6,558 |
| Baltic Sea | 15,337 | 0 | -15,337 | 0 | 0 | 0 | 0 | 0 |
| Sea of Okhotsk | 853,240 | 0 | -853,240 | -32 | 0 | 0 | 0 | 0 |
| Yellow Sea | 0 | 0 | 0 | 0 | 0 | 0 | 0 | 0 |
| Canadian Archipelago | 853,214 | 710,185 | -143,029 | -68,268 | -27,093 | -18,593 | 4,544 | 4,544 |
| Barents Sea | 645,917 | 99,089 | -546,829 | -86,102 | -17,843 | 515 | 11,199 | 5,076 |
| Hudson Bay | 1,260,903 | 297,084 | -963,819 | -795,217 | -328,611 | -168,738 | -8,513 | 7,072 |
| Central Arctic | 3,221,921 | 3,204,653 | -17,269 | -37,366 | -26,806 | 1,238 | 19,542 | 7,369 |
| Greenland Sea | 603,416 | 419,770 | -183,646 | -258,697 | -60,595 | -12,947 | 9,202 | 10,325 |
| Chukchi Sea | 966,006 | 648,560 | -317,447 | -161,028 | -56,774 | -2,294 | 10,338 | 10,338 |
| Baffin Bay Gulf of St. Lawrence | 1,688,530 | 146,557 | -1,541,974 | -707,908 | -148,017 | -16,358 | 20,990 | 19,529 |
| Beaufort Sea | 1,070,445 | 836,641 | -233,804 | -172,446 | -43,052 | -3,948 | 24,130 | 24,130 |
| East Siberian Sea | 1,087,137 | 1,013,009 | -74,128 | -33,129 | -20 | 39,352 | 44,411 | 28,743 |
| Laptev Sea | 897,845 | 390,955 | -506,890 | -299,542 | -121,412 | -30,799 | 17,943 | 30,994 |
| Northern Hemisphere (Total) | 14,805,115 | 8,296,372 | -6,508,743 | -2,984,249 | -1,037,027 | -364,281 | 118,137 | 123,515 |
| NH (Average Loss per Day) | -57,599 | -106,580 | -74,073 | -52,040 | 39,379 | 123,515 |
Antarctica is only 50,000 sq km from the record for the day. And the Arctic is melting slowly.
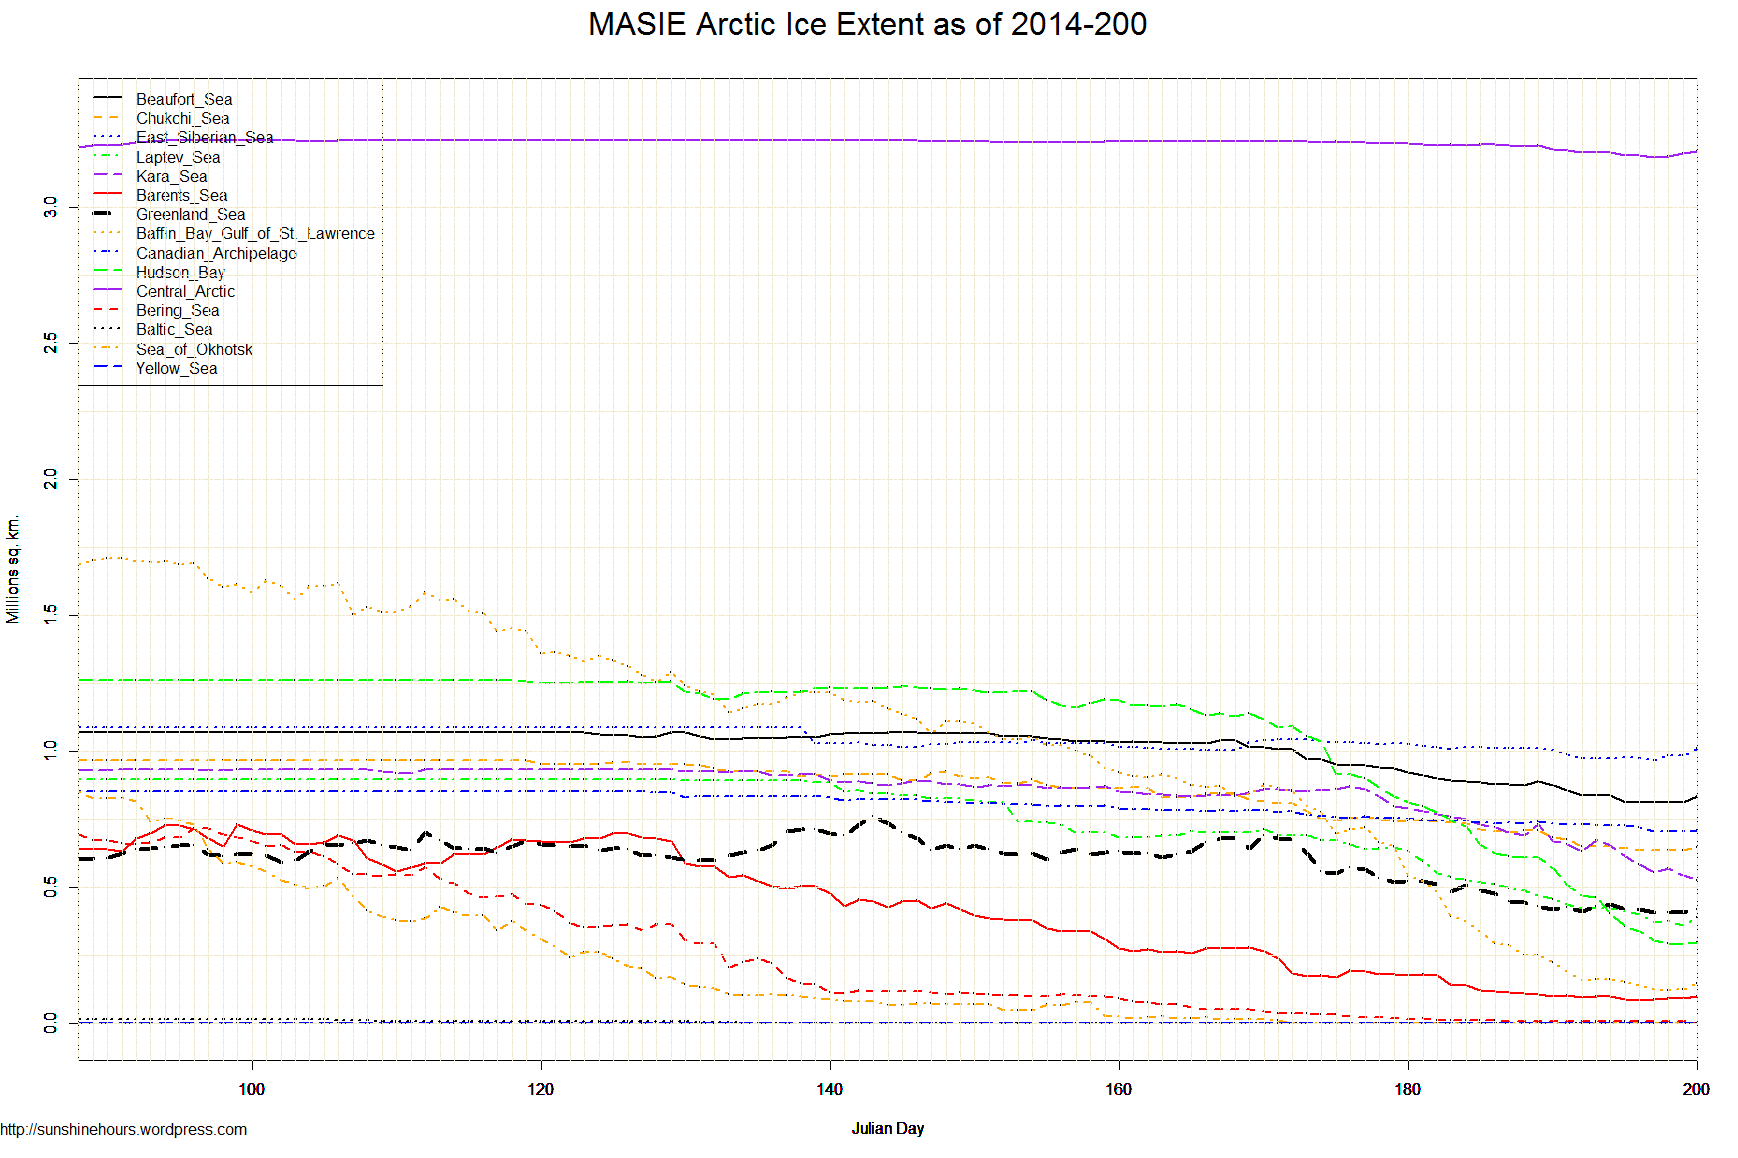
A quick update for sea ice extent for day 200 of 2014
NOAA Data here and here here. Graphs below. Click for bigger.


July 19 2014 MASIE Update – Not Much Melting … 3 regions added ice.
Data here.
| Region | 112 days ago | End | Last 111 | Last 28 | Last 14 | Last 7 | Last 3 | Last 1 |
| Kara Sea | 933,859 | 545,988 | -387,872 | -315,637 | -185,489 | -87,997 | -37,705 | -23,636 |
| Laptev Sea | 897,845 | 359,961 | -537,884 | -331,130 | -157,539 | -61,793 | -40,874 | -14,612 |
| Hudson Bay | 1,260,903 | 290,012 | -970,891 | -800,678 | -367,416 | -179,505 | -50,742 | -3,596 |
| Greenland Sea | 603,416 | 409,445 | -193,971 | -272,399 | -81,551 | -3,931 | -9,411 | -834 |
| East Siberian Sea | 1,087,137 | 984,266 | -102,871 | -61,872 | -29,512 | 10,609 | 7,715 | -598 |
| Beaufort Sea | 1,070,445 | 812,511 | -257,934 | -195,443 | -73,603 | -28,078 | 1,050 | 0 |
| Chukchi Sea | 966,006 | 638,222 | -327,784 | -171,366 | -73,953 | -12,632 | 101 | 0 |
| Canadian Archipelago | 853,214 | 705,642 | -147,573 | -70,982 | -35,270 | -25,068 | -15,948 | 0 |
| Bering Sea | 697,324 | 7,345 | -689,979 | -29,473 | -5,025 | -1,314 | 98 | 0 |
| Baltic Sea | 15,337 | 0 | -15,337 | 0 | 0 | 0 | 0 | 0 |
| Sea of Okhotsk | 853,240 | 0 | -853,240 | -11,157 | 0 | 0 | 0 | 0 |
| Yellow Sea | 0 | 0 | 0 | 0 | 0 | 0 | 0 | 0 |
| Barents Sea | 645,917 | 94,013 | -551,904 | -144,311 | -26,712 | -2,292 | 7,065 | 1,246 |
| Baffin Bay Gulf of St. Lawrence | 1,688,530 | 127,027 | -1,561,503 | -738,540 | -210,699 | -31,901 | -12,347 | 4,678 |
| Central Arctic | 3,221,921 | 3,197,284 | -24,638 | -44,735 | -34,227 | -6,095 | 7,604 | 7,912 |
| Northern Hemisphere (Total) | 14,805,115 | 8,172,856 | -6,632,258 | -3,188,108 | -1,281,365 | -429,996 | -143,394 | -29,440 |
| NH (Average Loss per Day) | -59,217 | -113,861 | -91,526 | -61,428 | -47,798 | -29,440 |
The Central Arctic is the highest in many years.
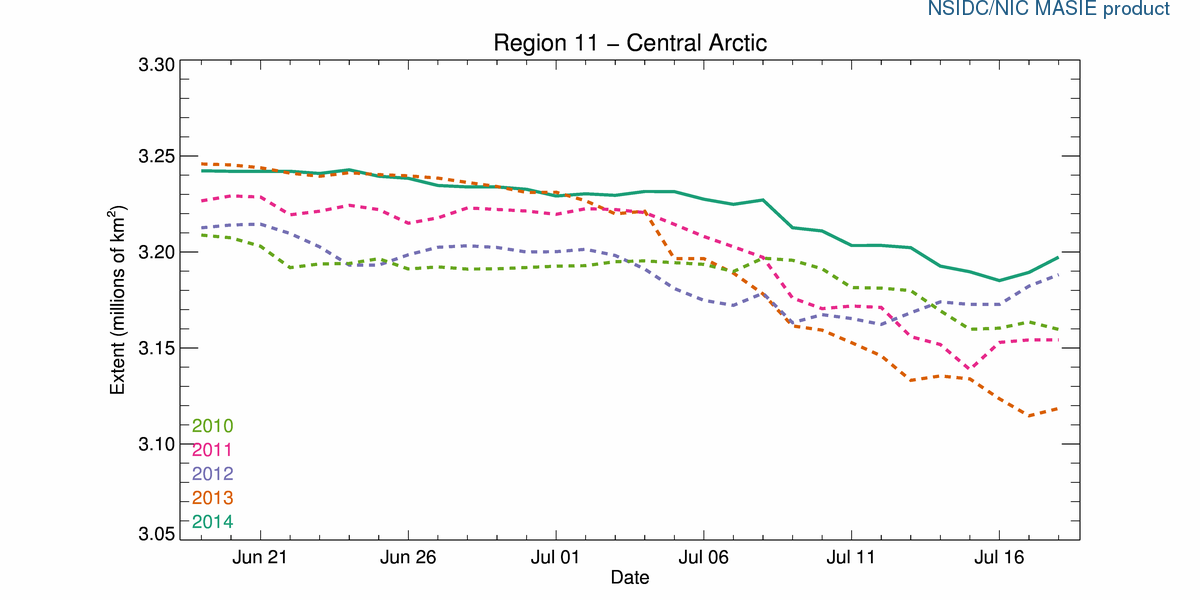
Despite a big drop a few days ago Antarctica is still trying to set a new record. And the Arctic didn’t melt for 1 day … again.
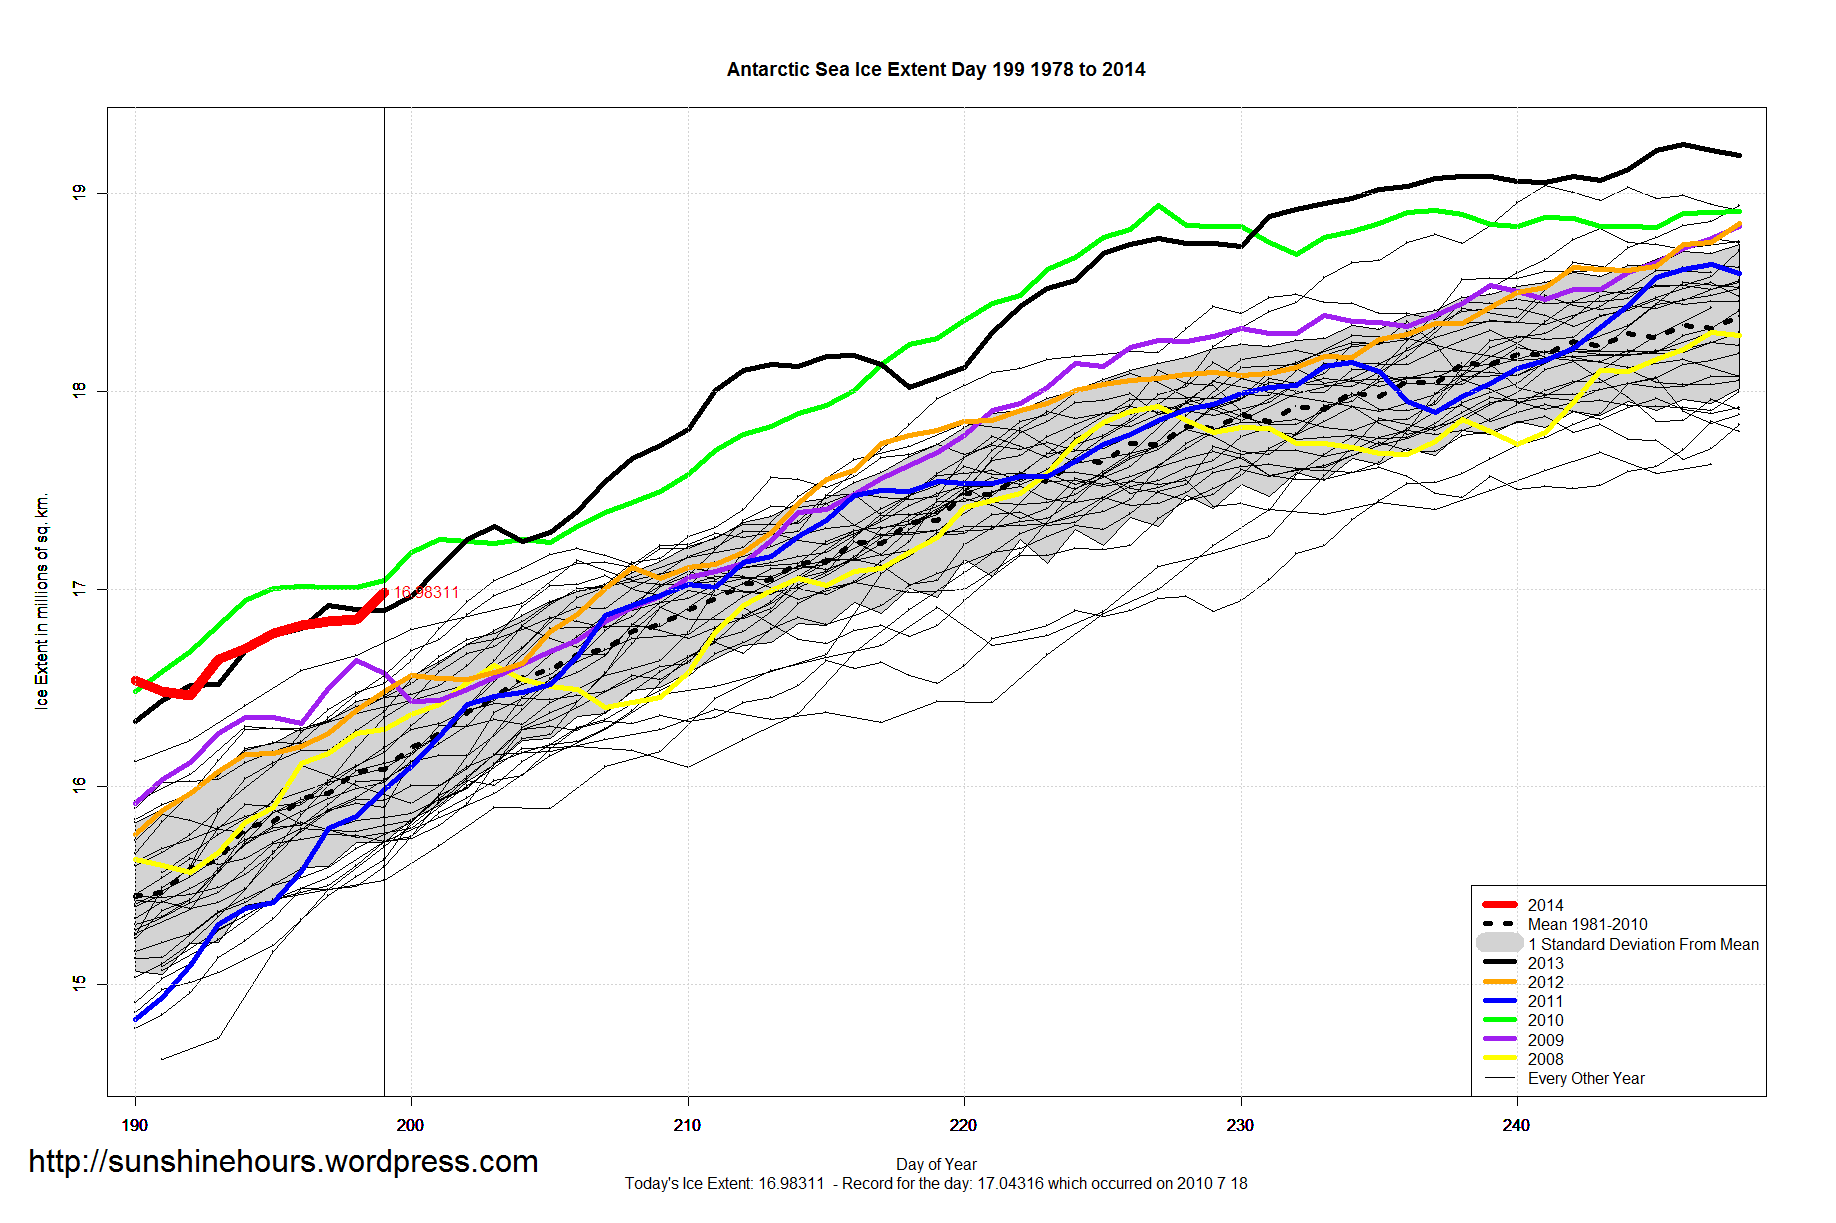
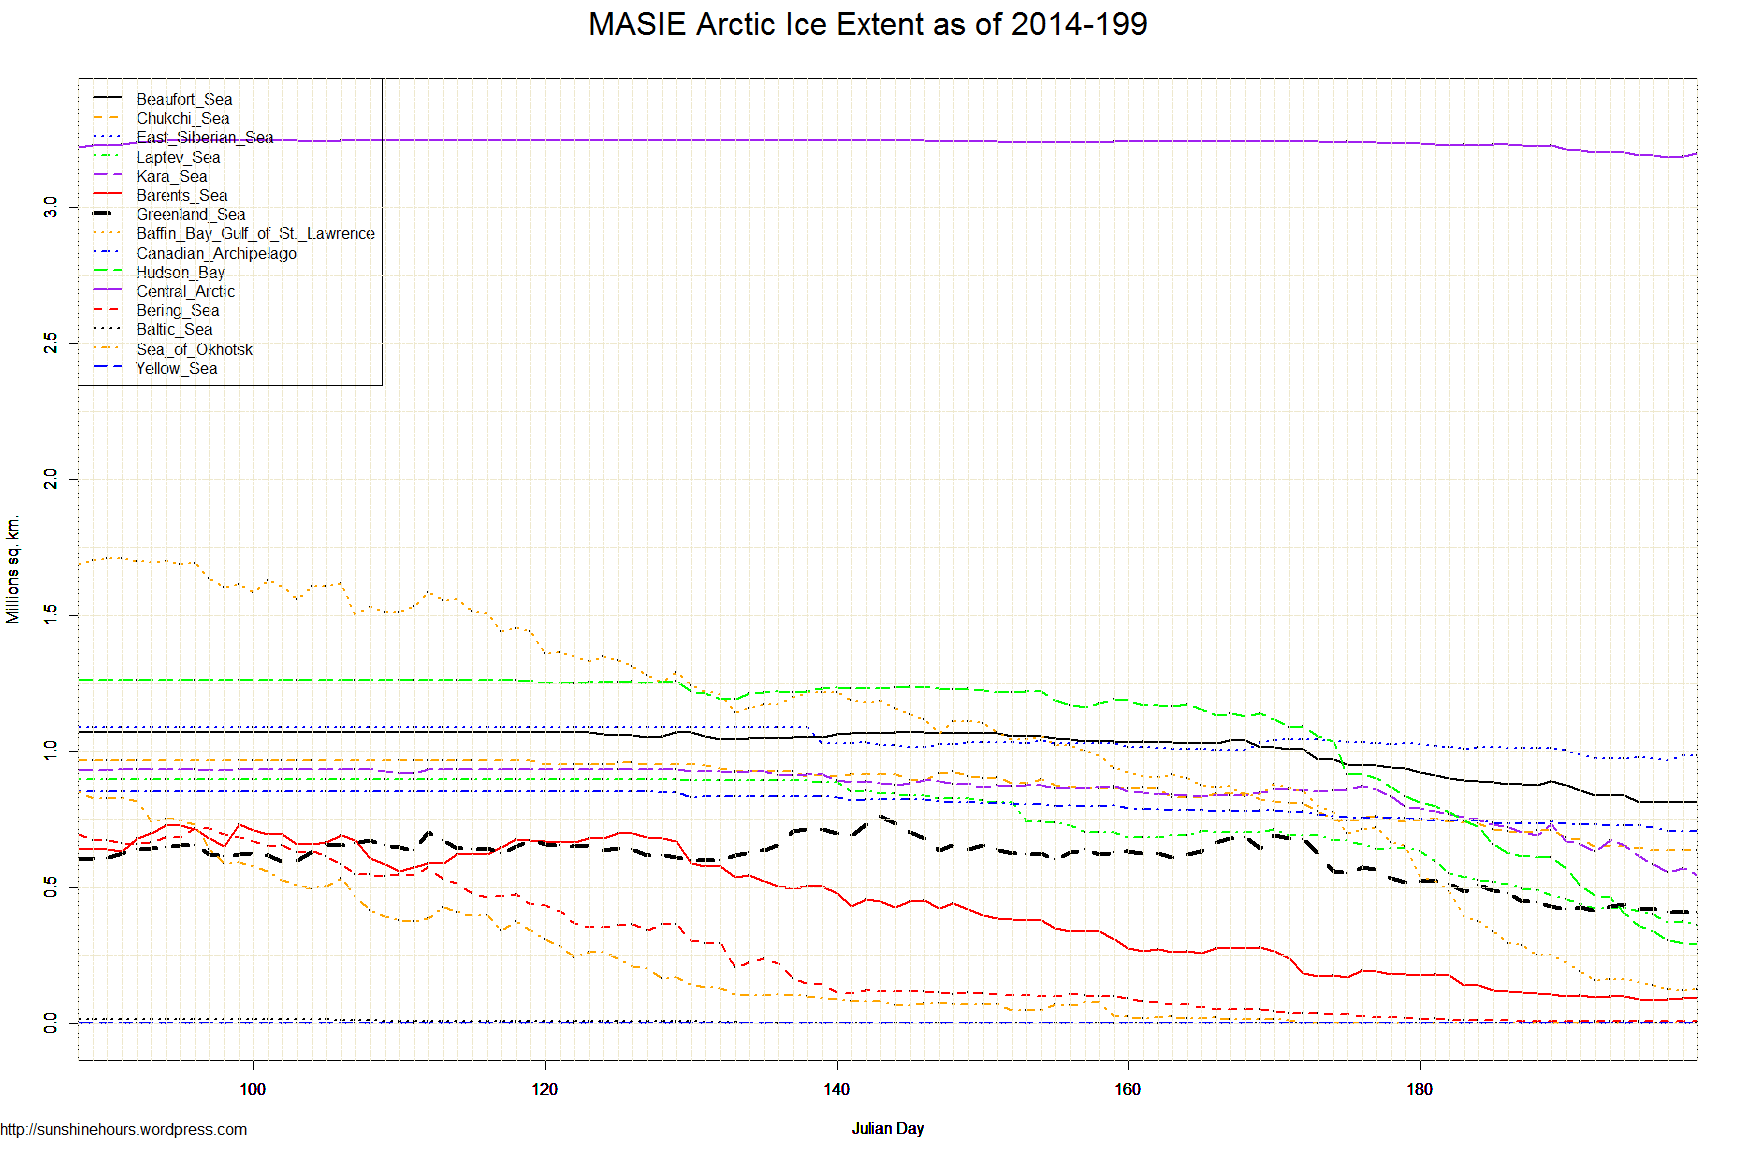
A quick update for sea ice extent for day 199 of 2014
NOAA Data here and here here. Graphs below. Click for bigger.