Sea Ice Update June 14 2014 – Global Sea Ice 1.9 million sq km Higher Than 2002 On This Day

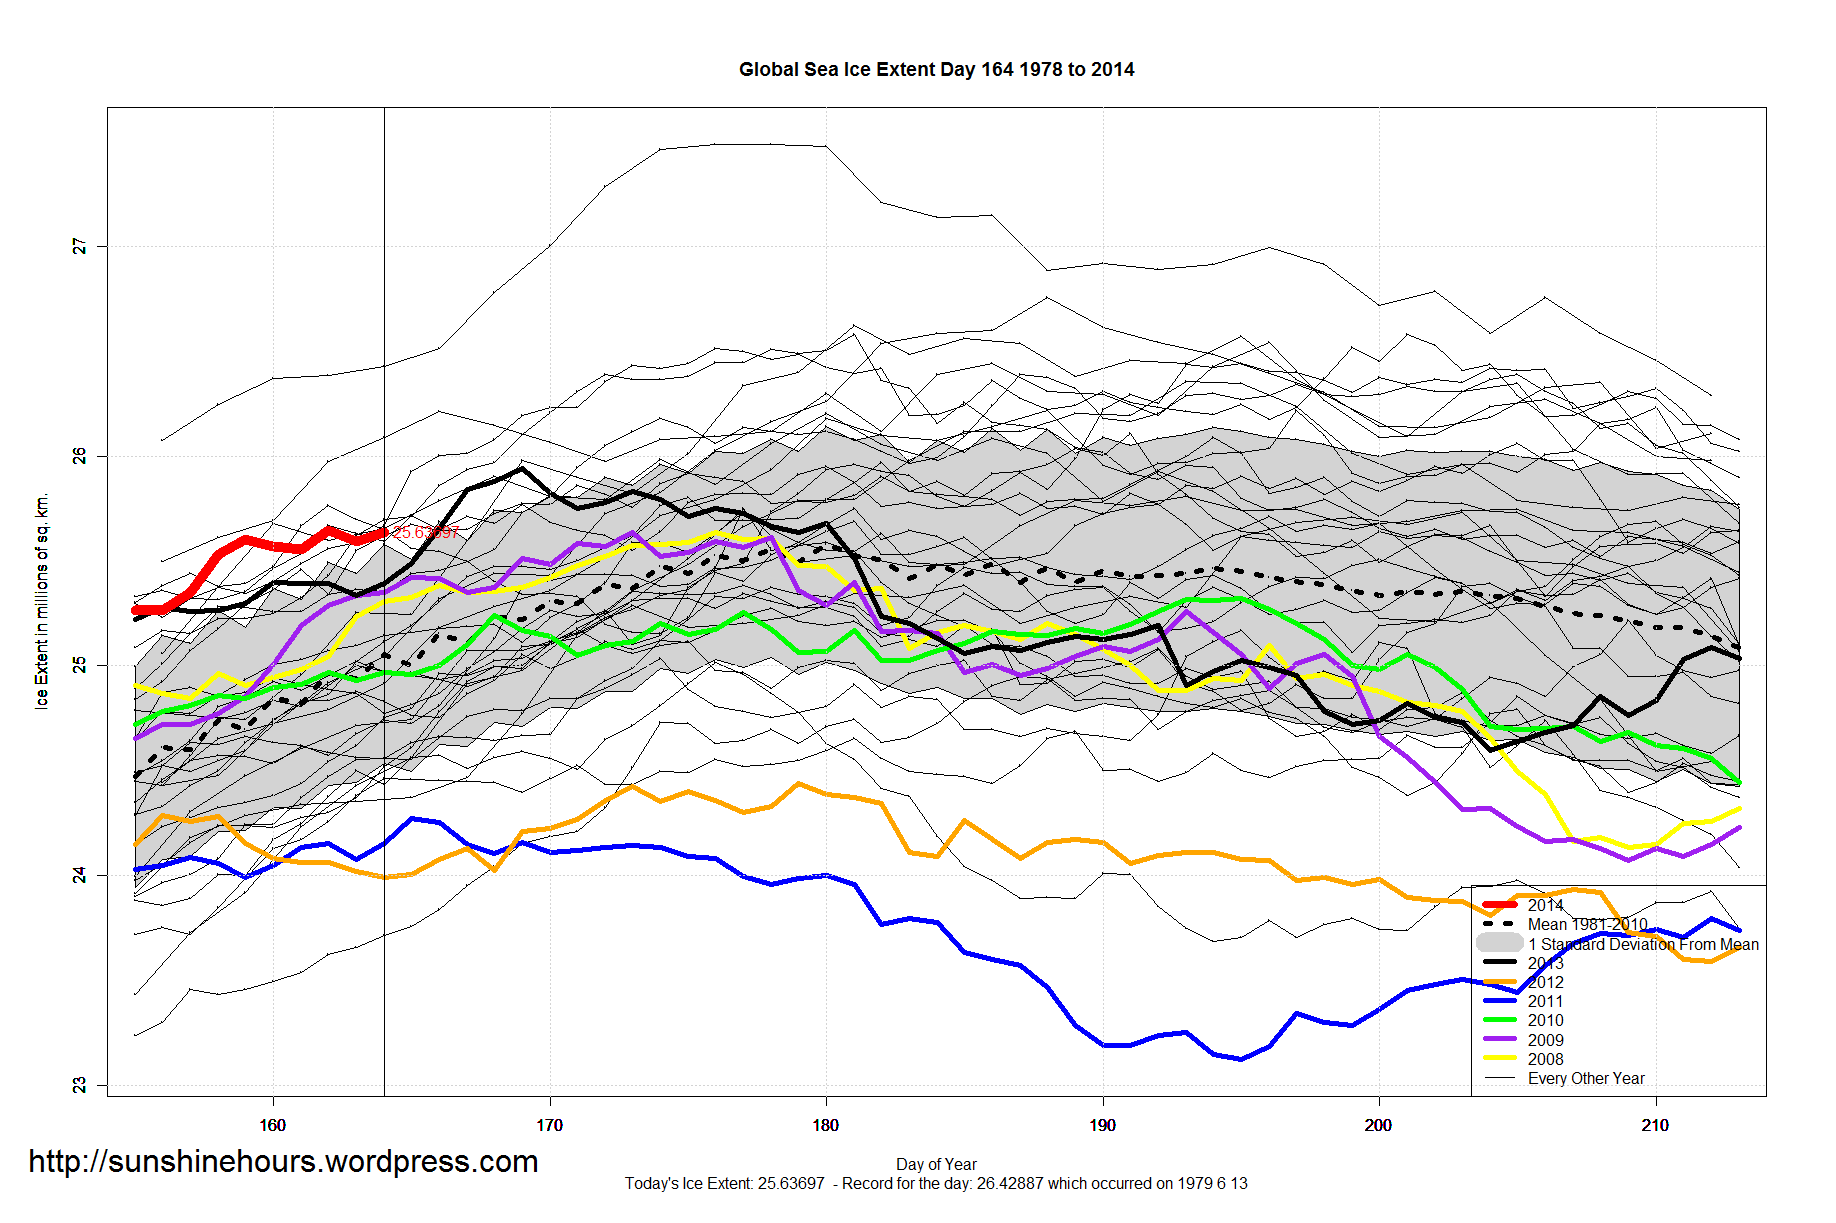
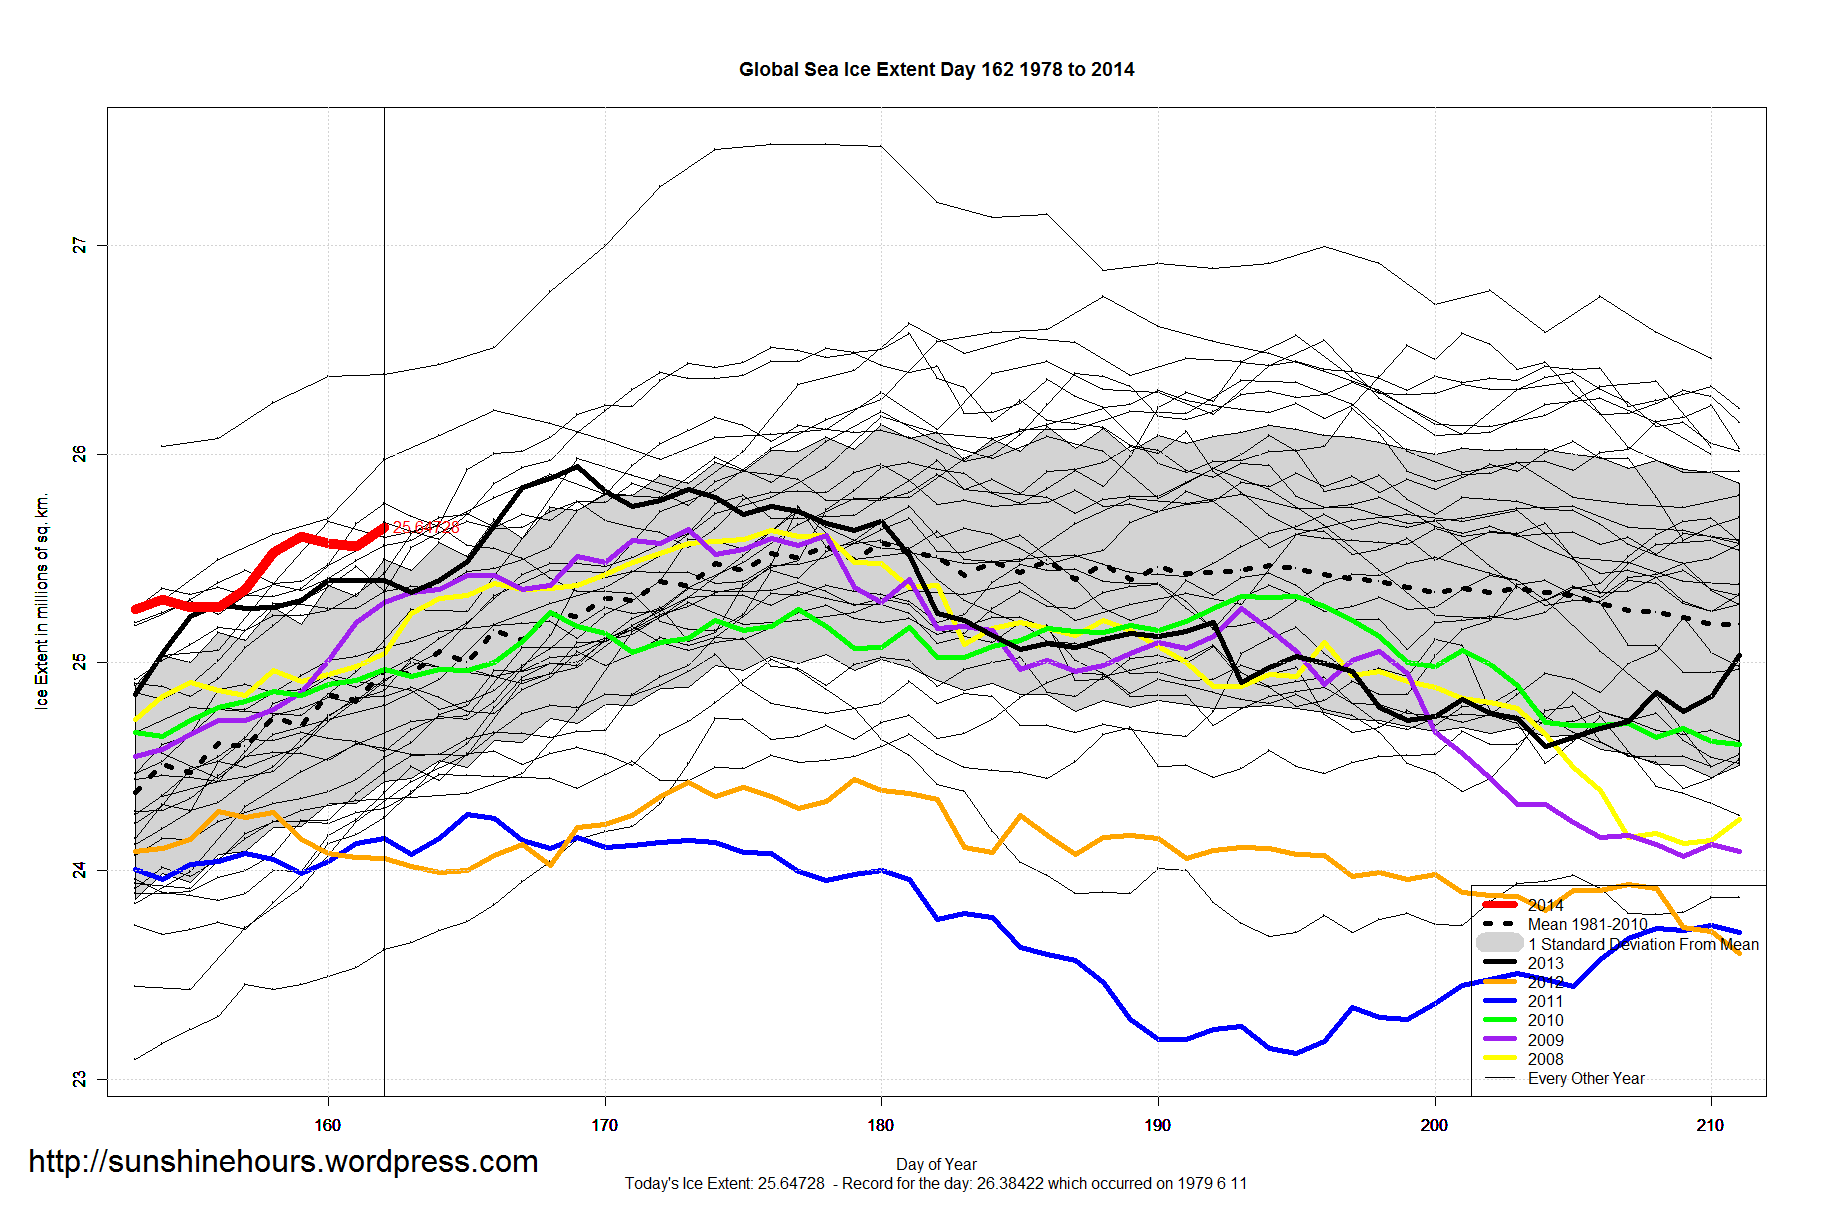
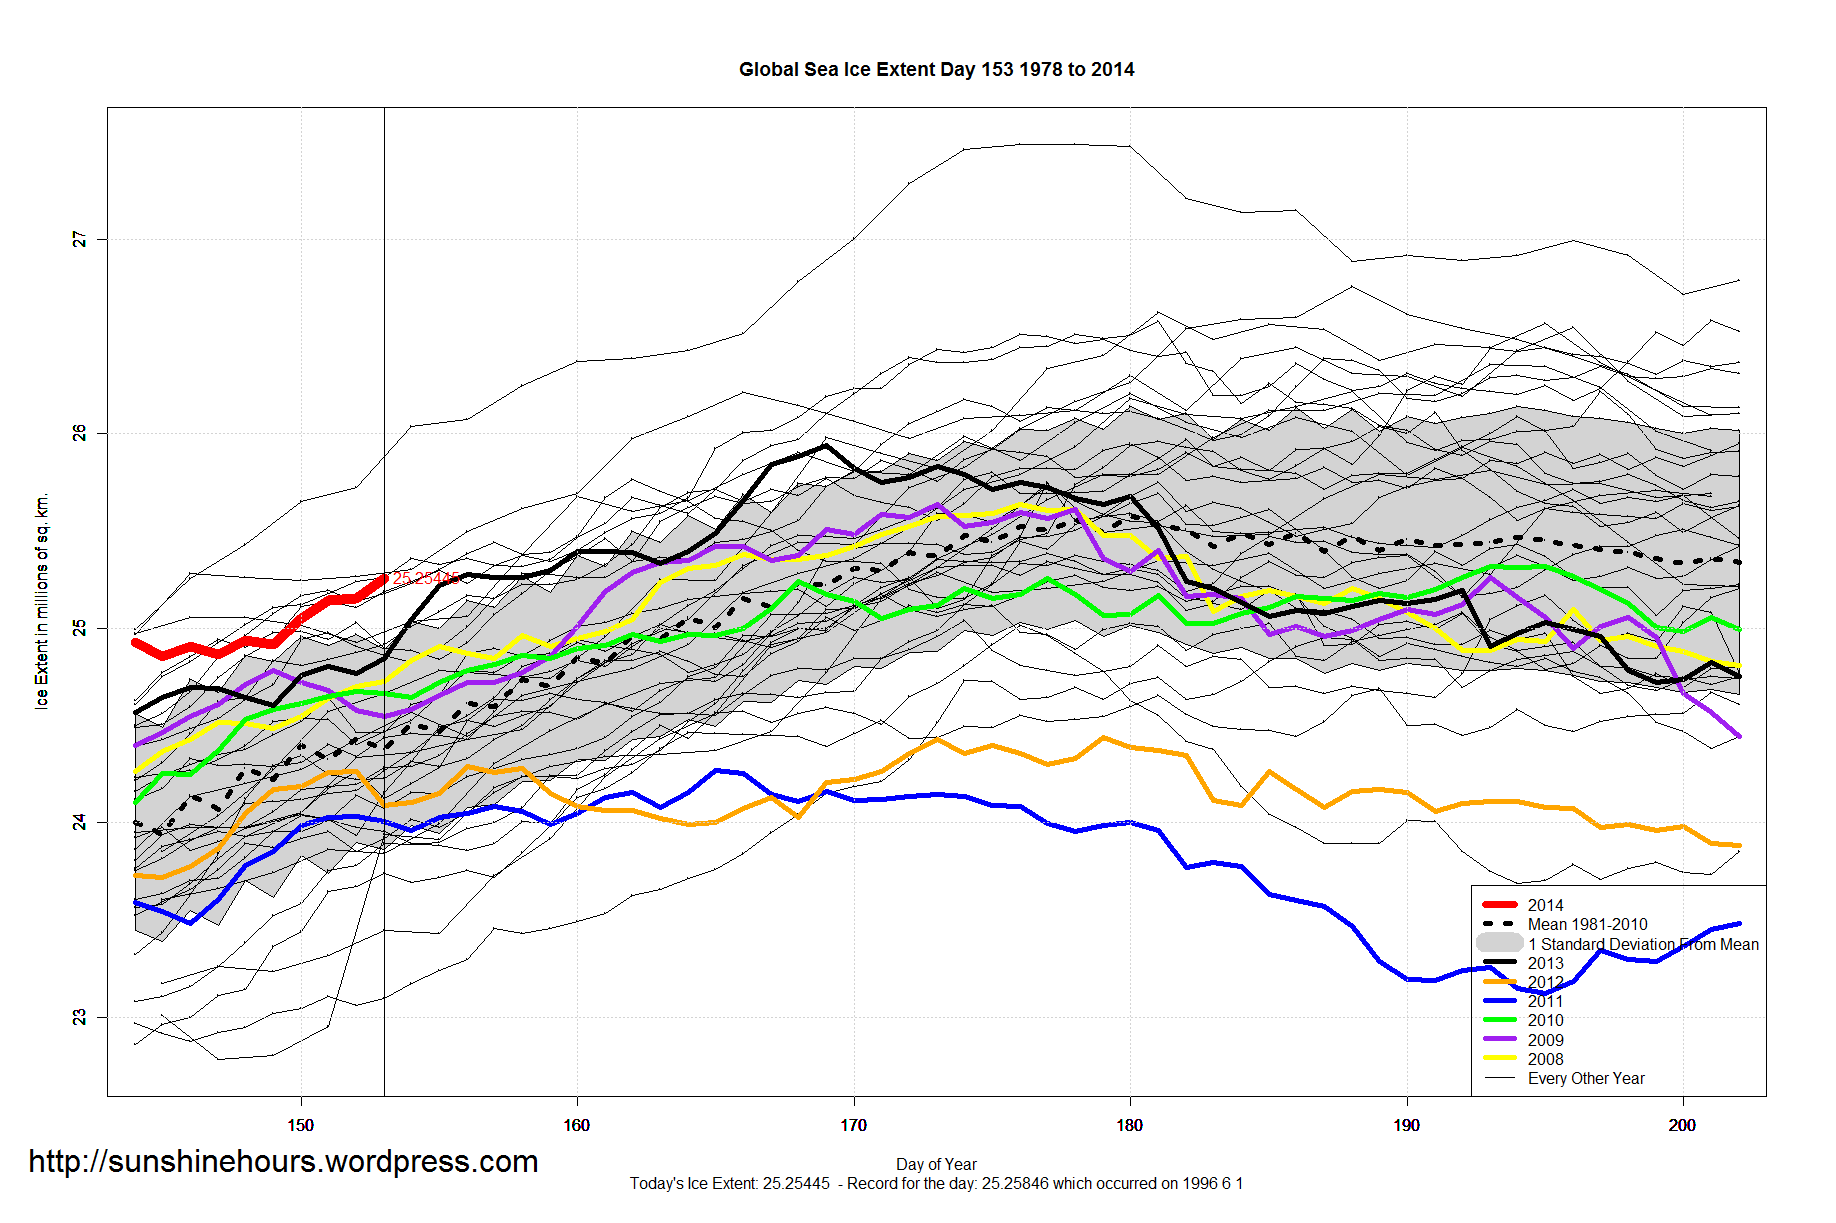
On this day in 2002 global sea ice was at 23.7 million sq km. In 2014 on the same day global sea ice is at 25.6 million sq km. That is a 1.9 million sq km increase.

You have to go back to 1999 to have more global sea ice than in 2014 on this day.

A quick update for sea ice extent for day 164 of 2014

  • Global Sea Ice Extent is 609,000 sq km above the 1981-2010 mean. That is ranked 7 for the day.
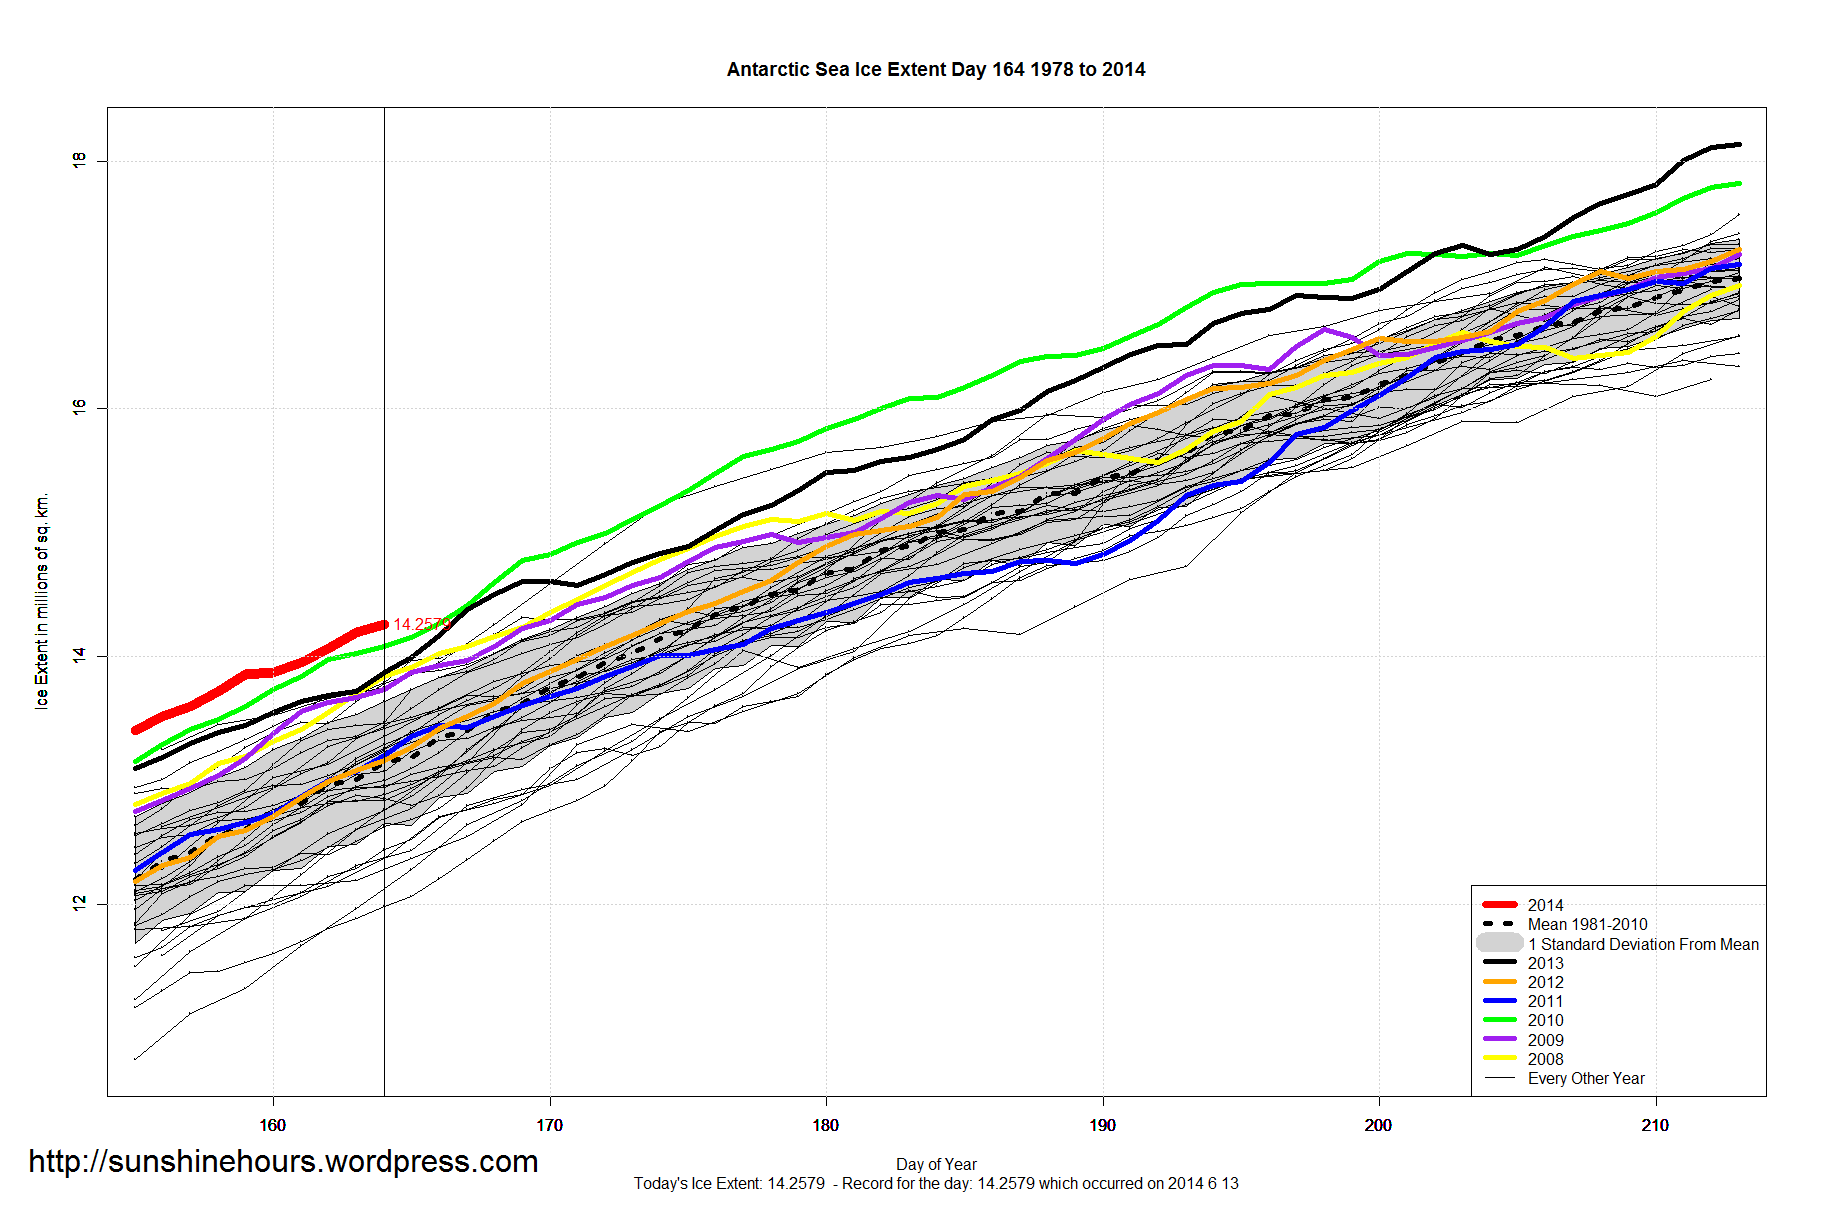
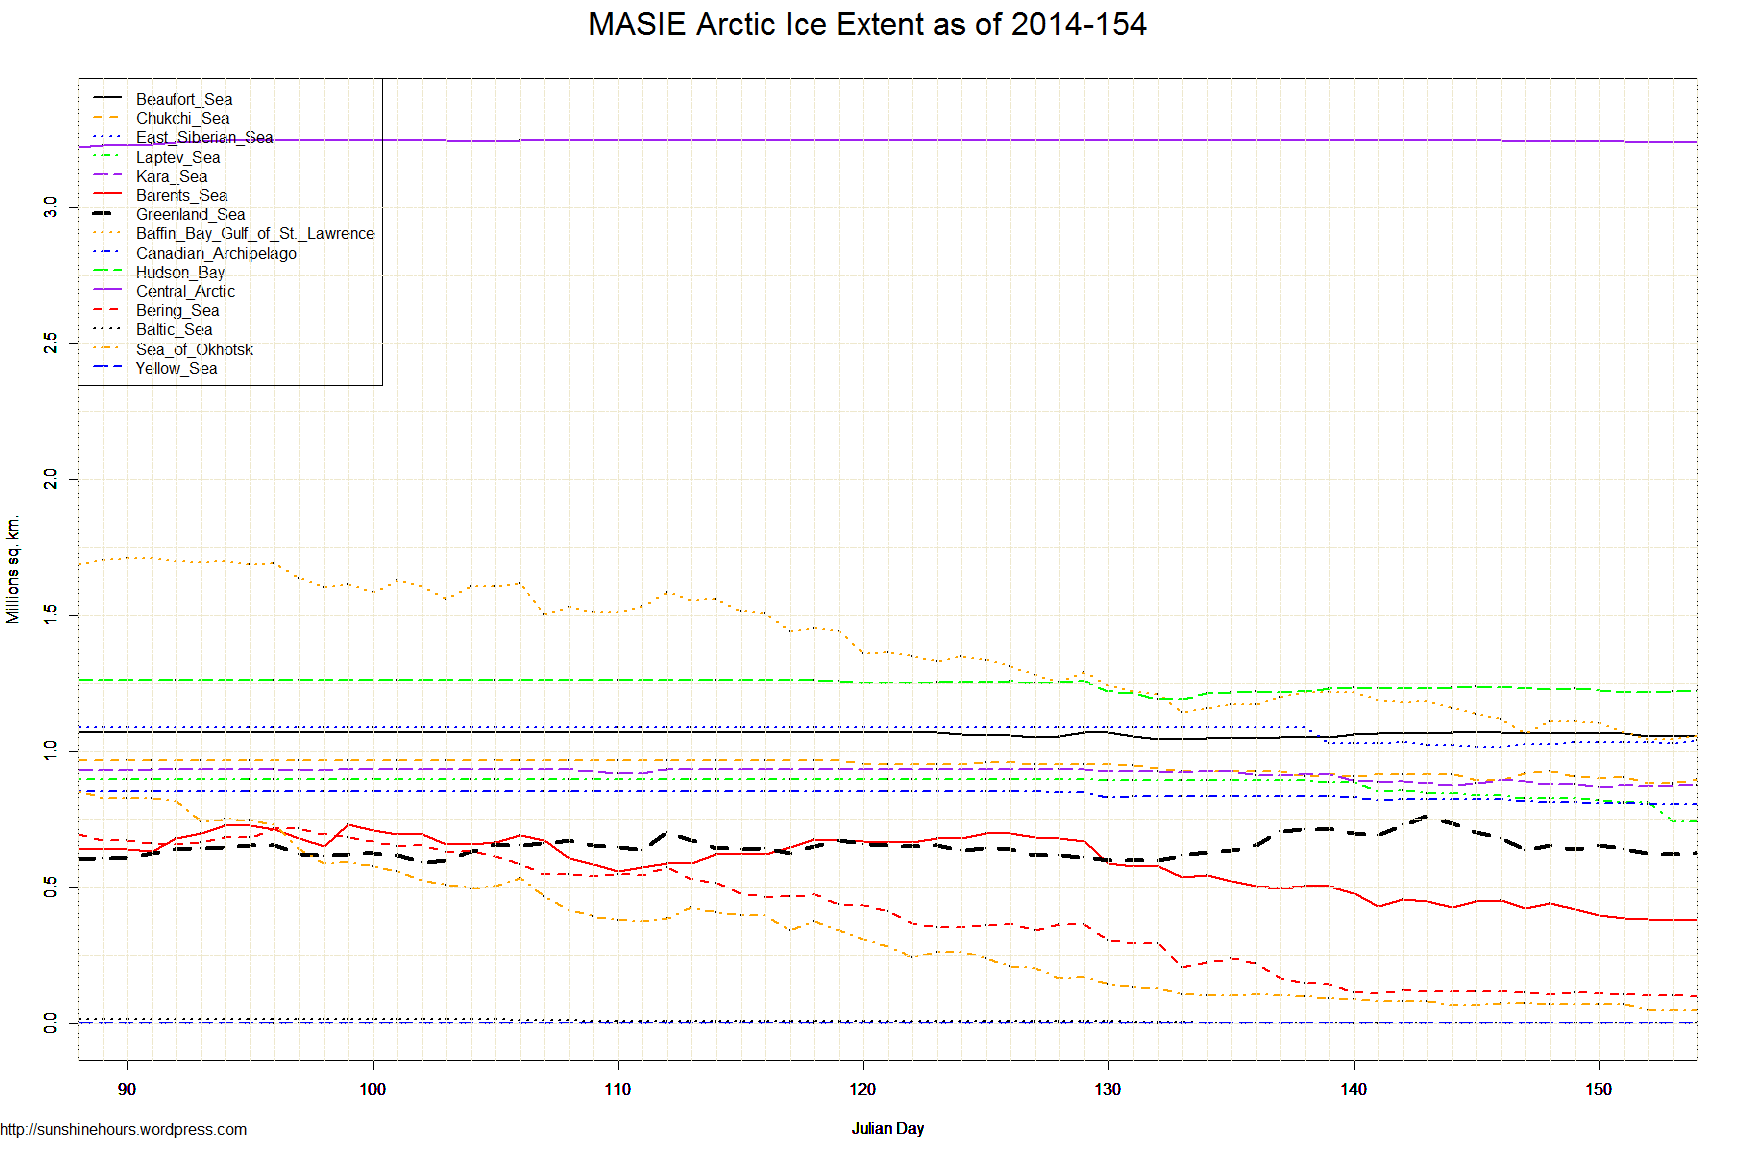
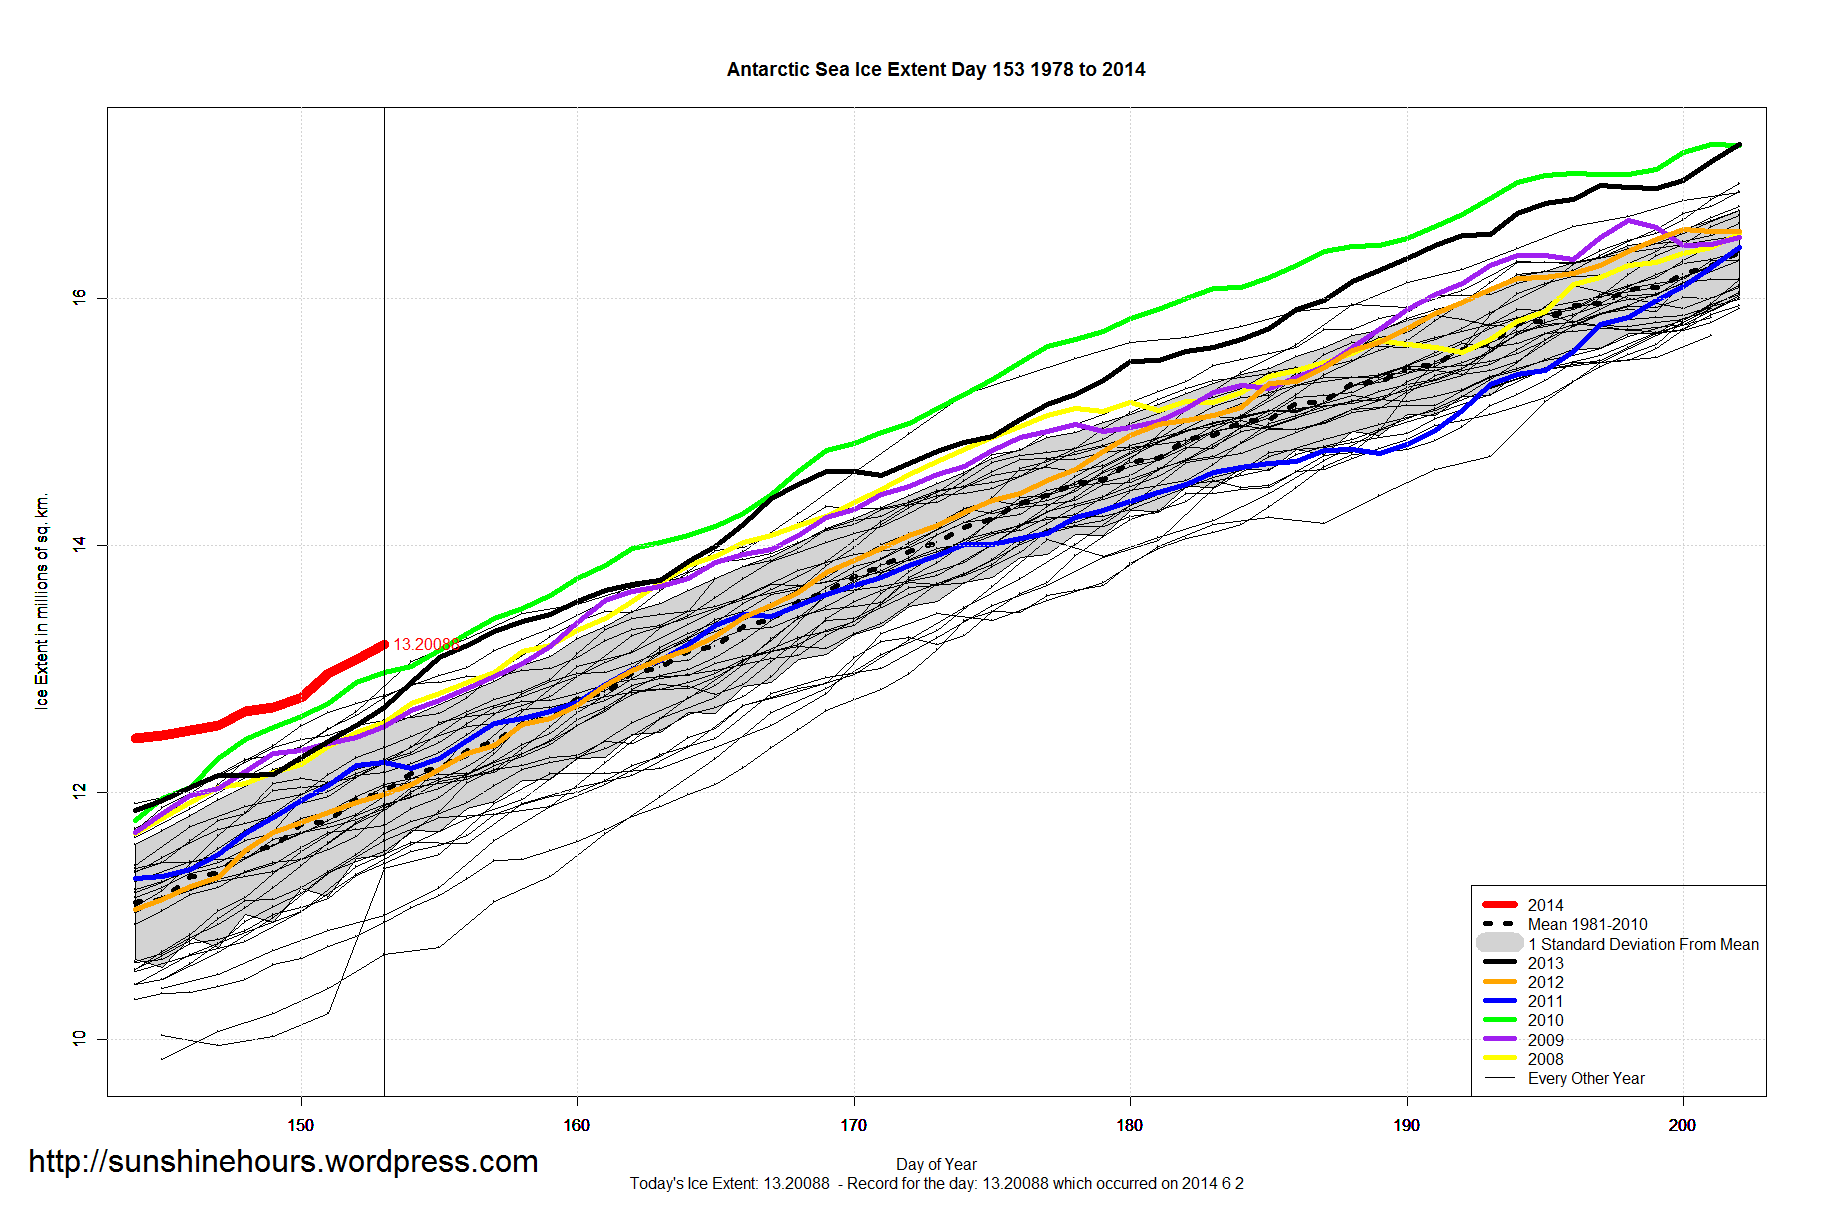
  • Antarctic Sea Ice Extent is 1,184,000 sq km above the 1981-2010 mean. That is ranked 1 for the day.
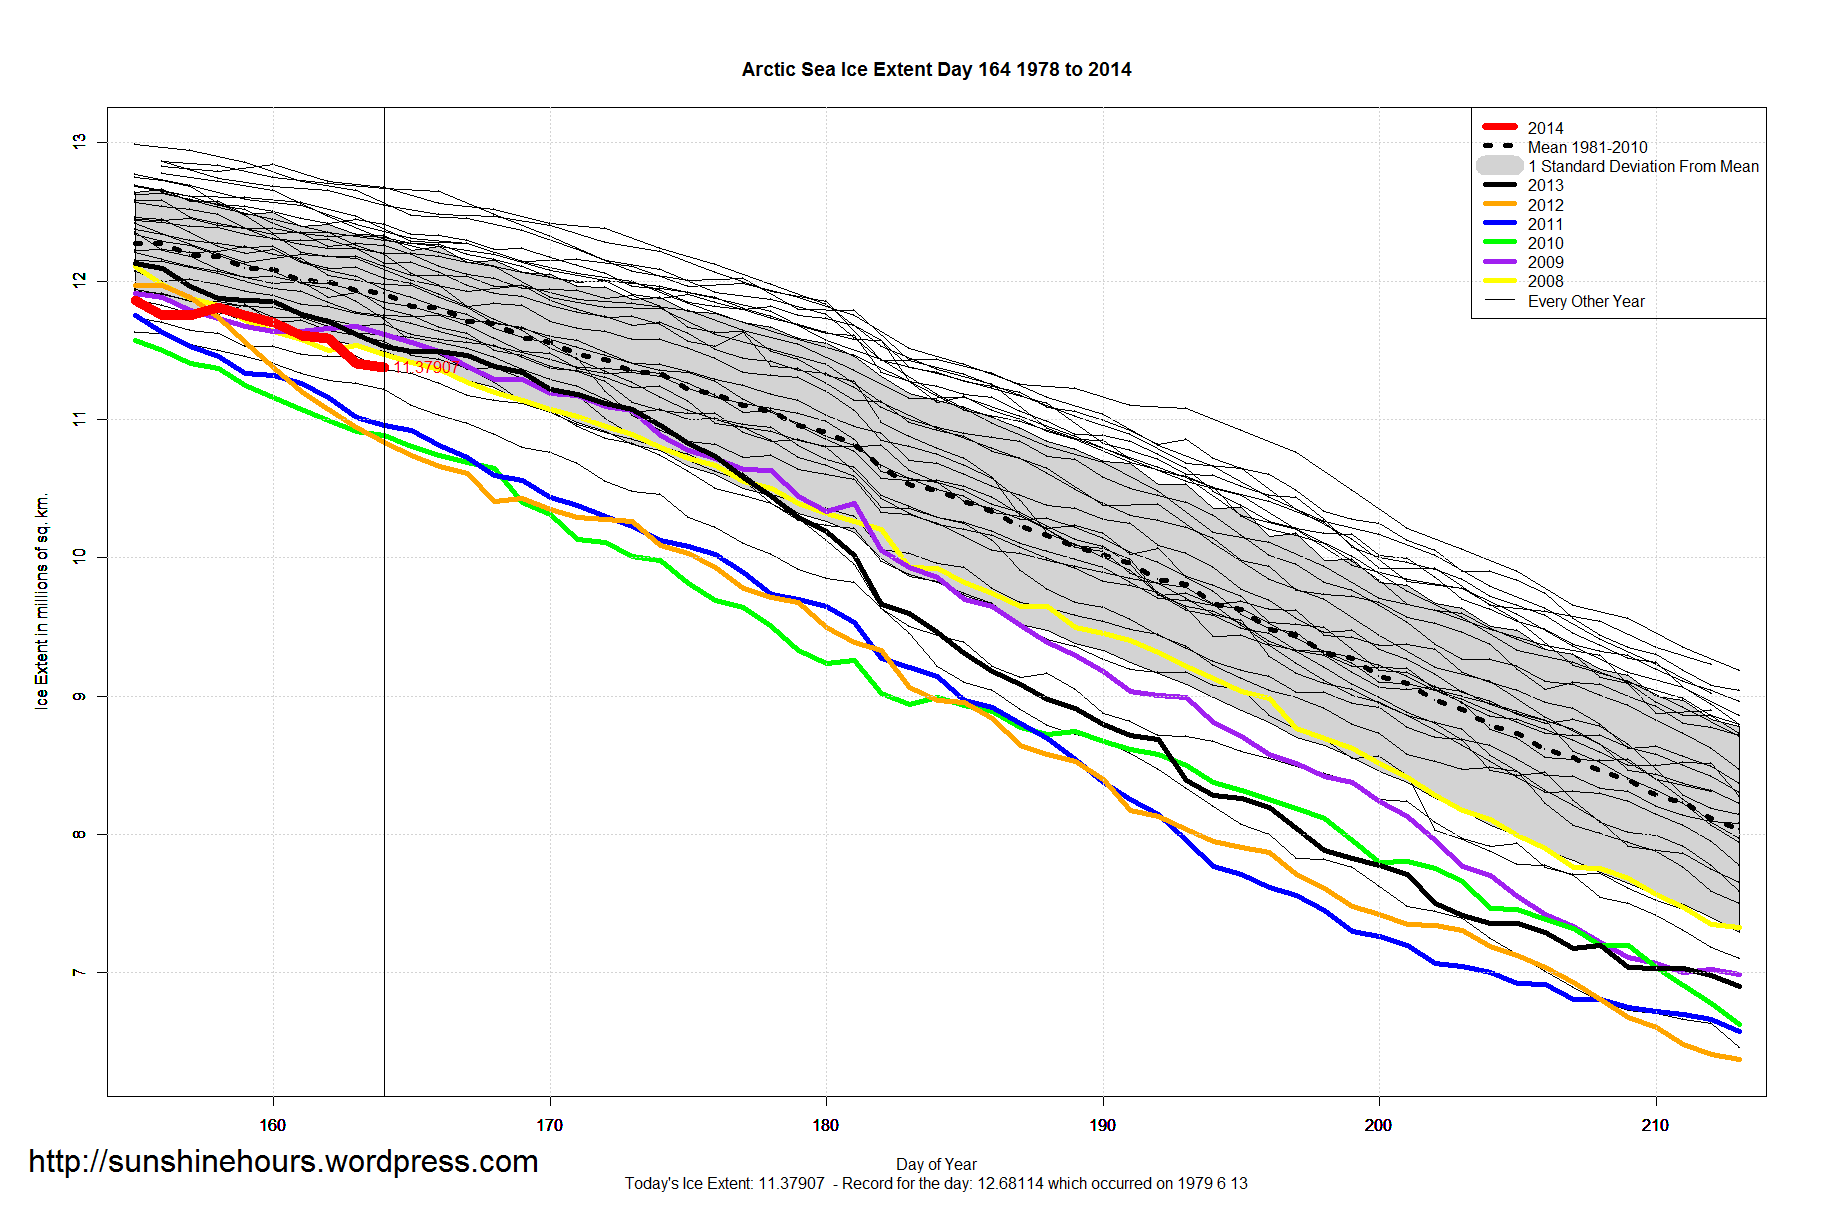
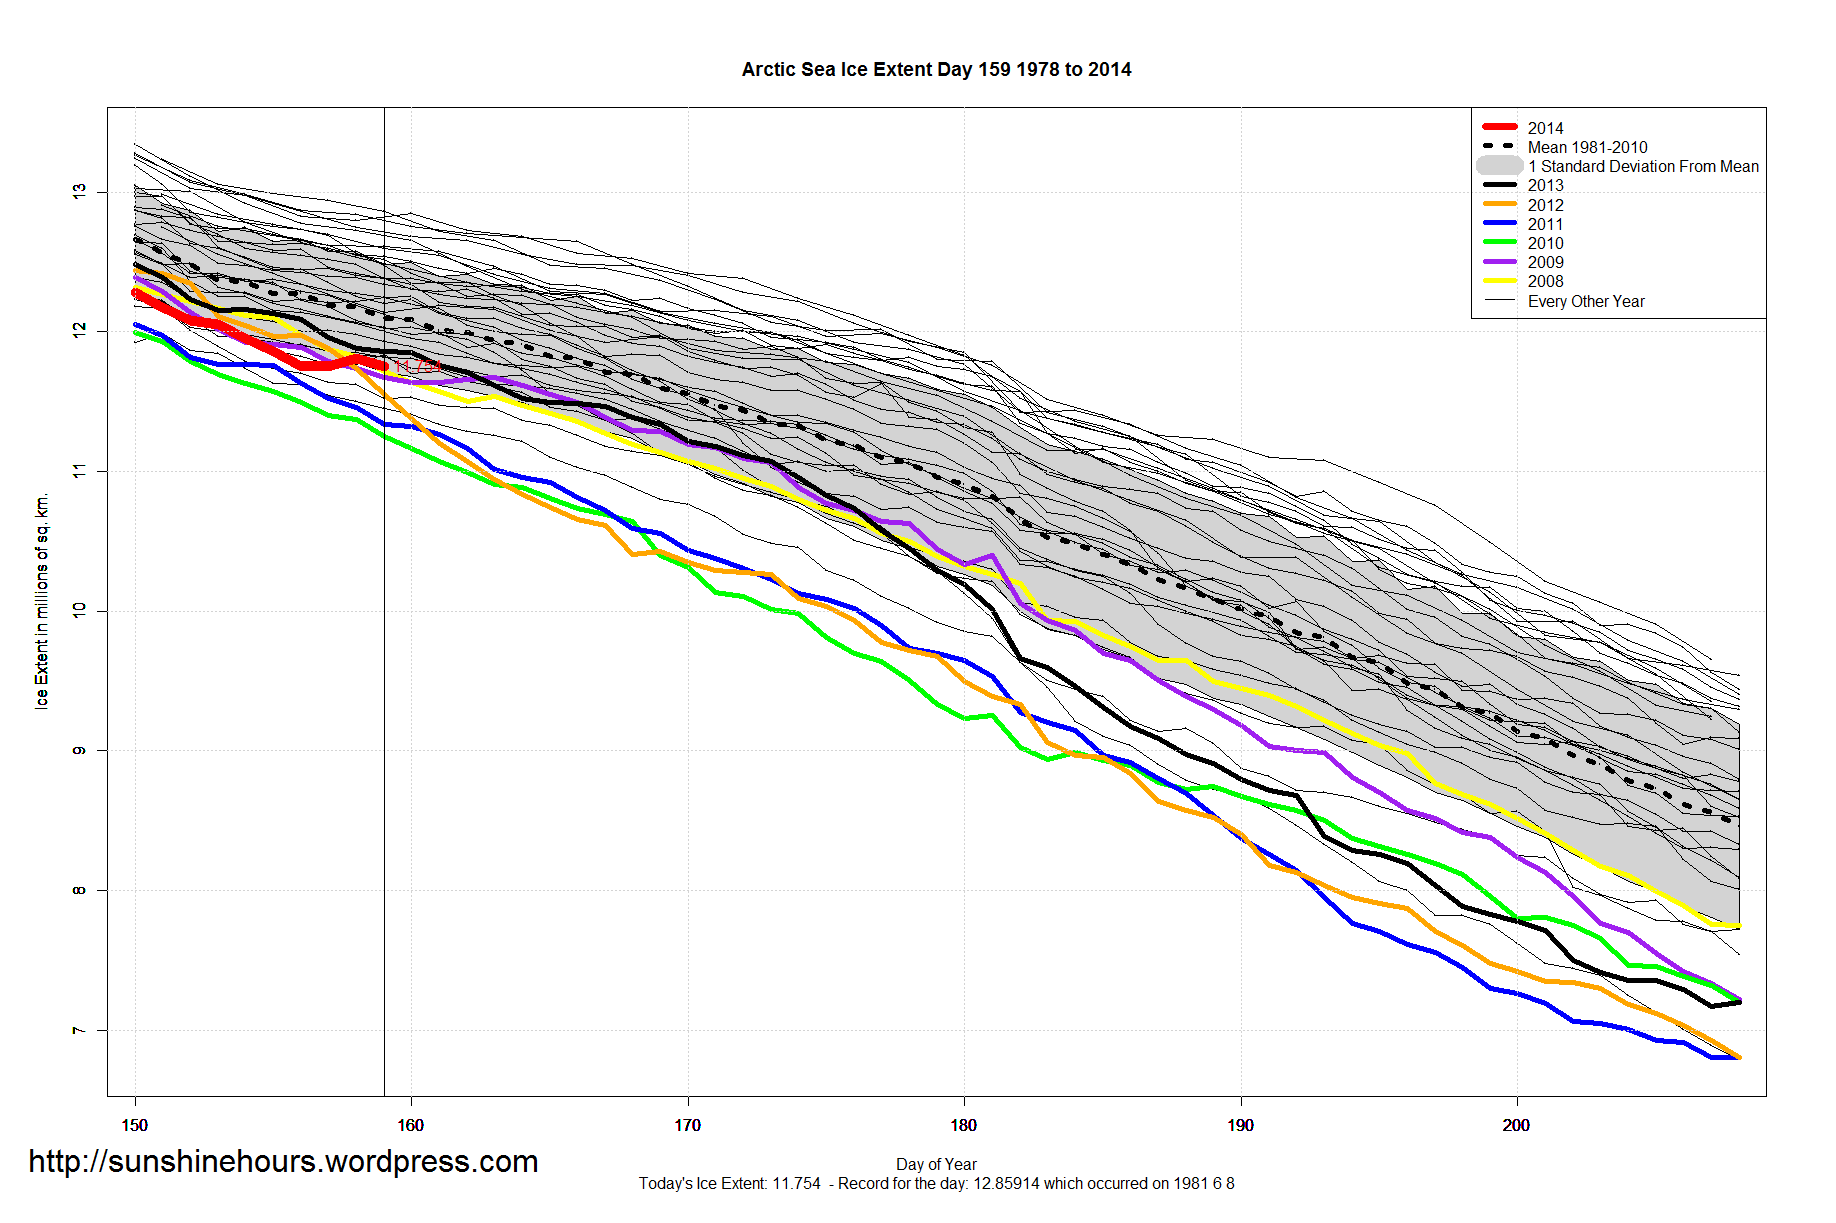
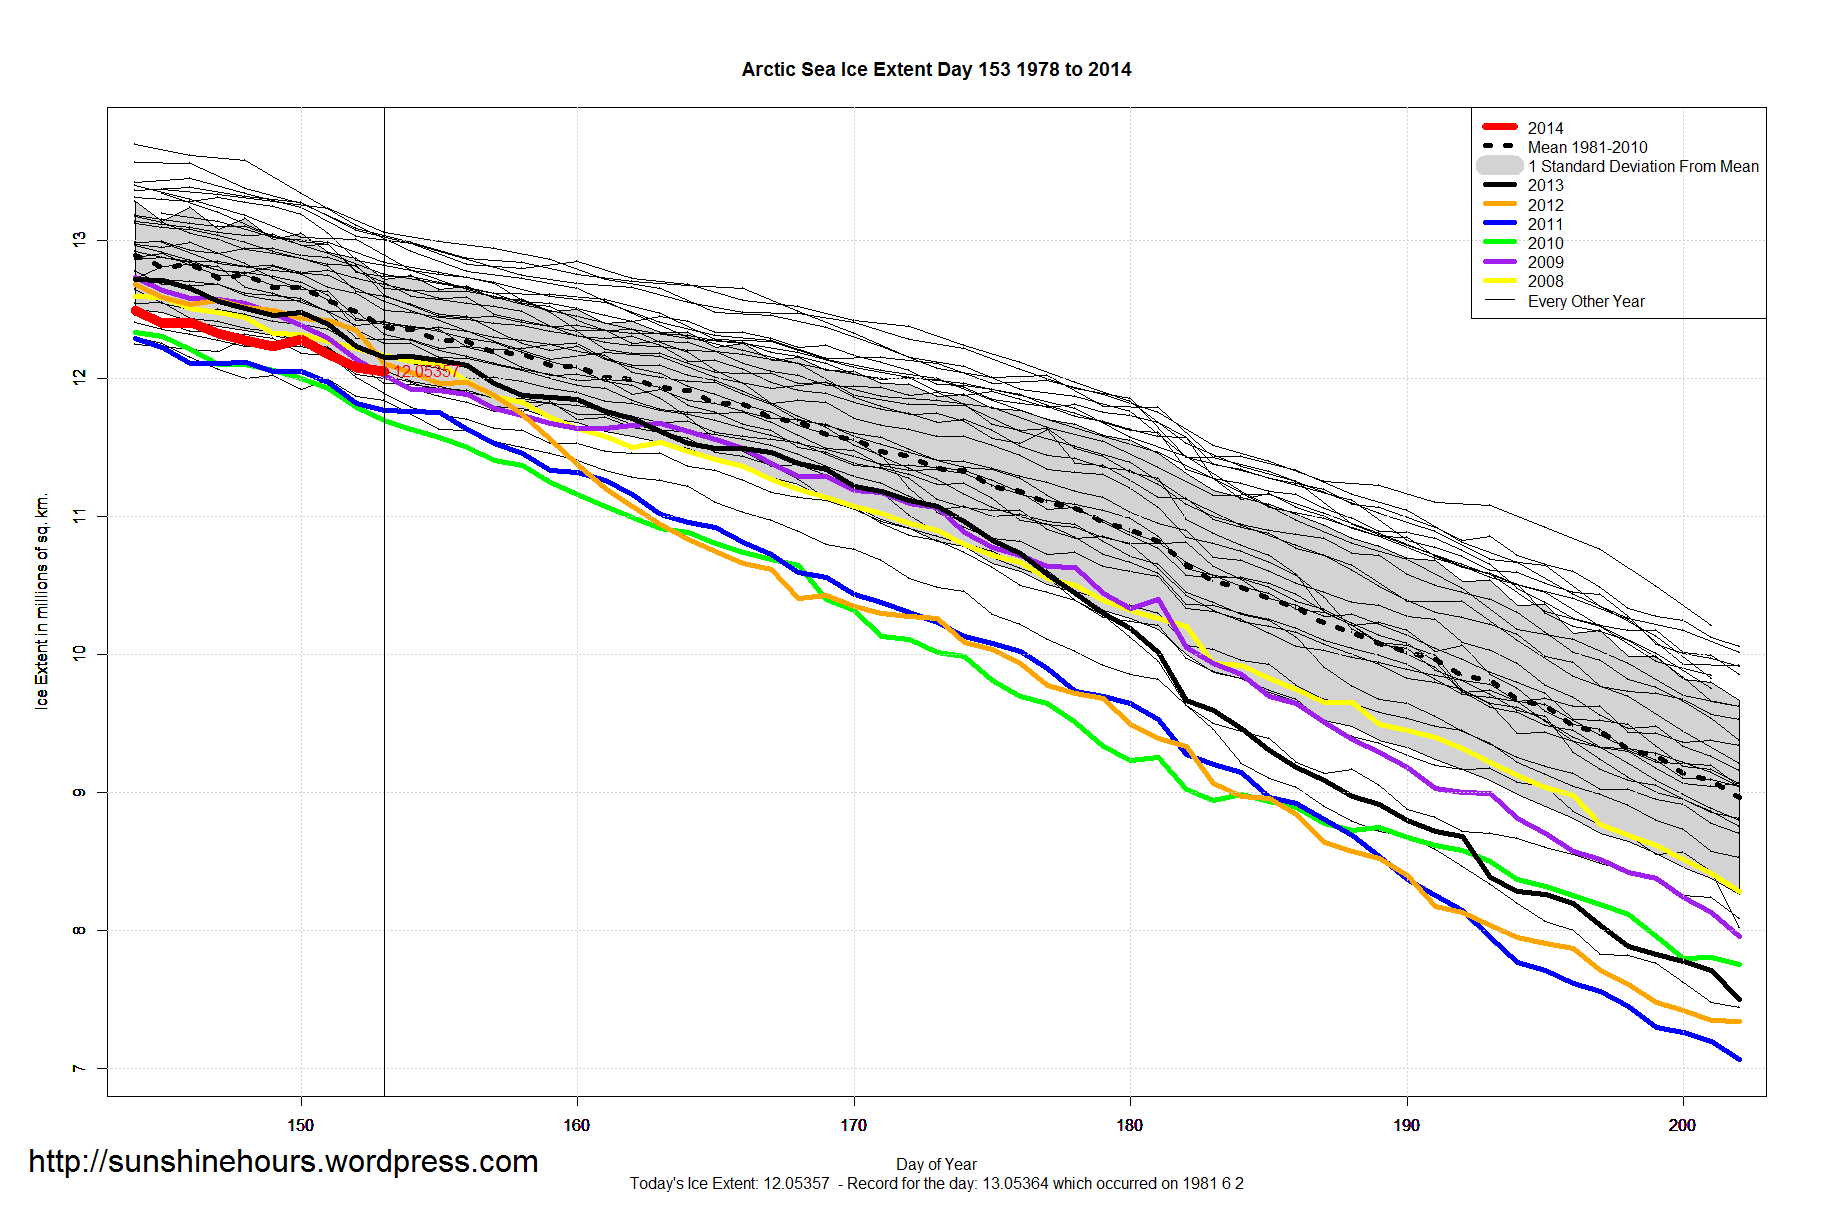
  • Arctic Sea Ice Extent is -576,000 sq km below the 1981-2010 mean. That is ranked 31 for the day.

NOAA Data here and here here. Graphs below. Click for bigger.


Global_Sea_Ice_Extent_Zoomed_2014_Day_164_1981-2010

Antarctic_Sea_Ice_Extent_Zoomed_2014_Day_164_1981-2010

Arctic_Sea_Ice_Extent_Zoomed_2014_Day_164_1981-2010

MASIE June 12 2014 – Central Arctic and Greenland Sea last two regions with more ice now than 74 days ago

June 12 2014  MASIE Update – Central Arctic and Greenland Sea last two regions with more ice now than 74 days ago

Also, a slight slowdown only in the last 1 day. Ice on dropped -17,601.

Region Start End Last 74 Last 28 Last 14 Last 7 Last 3 Last 1
Baffin Bay Gulf of St. Lawrence 1,688,530 904,040 -784,490 -253,963 -208,362 -120,139 -32,622 -5,302
Barents Sea 645,917 271,439 -374,478 -272,700 -168,751 -76,979 -38,919 6,909
Laptev Sea 897,845 685,213 -212,631 -208,129 -141,366 -54,414 -19,202 -817
Sea of Okhotsk 853,240 22,042 -831,197 -80,052 -49,182 -47,337 -4,905 1,504
Kara Sea 933,859 840,937 -92,922 -87,640 -37,900 -25,513 -29,354 -9,835
Bering Sea 697,324 77,030 -620,294 -146,473 -31,857 -24,151 -22,319 -4,679
Hudson Bay 1,260,903 1,170,147 -90,757 -43,330 -59,925 -18,886 -20,428 -231
East Siberian Sea 1,087,137 1,012,535 -74,602 -74,602 -14,726 -18,192 -18,724 -1,446
Beaufort Sea 1,070,445 1,035,169 -35,276 -13,379 -30,935 -13,864 -2,725 -1,235
Chukchi Sea 966,006 864,628 -101,379 -63,686 -63,816 -12,345 1,774 -2,176
Canadian Archipelago 853,214 786,656 -66,558 -47,527 -27,820 -11,191 -14,571 -1,060
Baltic Sea 15,337 0 -15,337 -2,673 0 0 0 0
Yellow Sea 0 0 0 0 0 0 0 0
Central Arctic 3,221,921 3,241,698 19,777 -6,044 7 2,003 6 -400
Greenland Sea 603,416 626,511 23,096 -3,170 -27,694 24,406 -3,669 781
Northern Hemisphere (Total) 14,805,115 11,539,574 -3,265,541 -1,303,336 -862,280 -396,216 -205,273 -17,601
NH (Average Loss per Day) -43,541 -46,548 -61,591 -56,602 -68,424 -17,601

MASIE Arctic Ice Extent as of 2014-162

Sea Ice Update June 12 2014 – Arctic Sea Ice Within One Standard Deviation of ‘Normal’

Arctic Sea Ice Within One Standard Deviation of ‘Normal’ and 600,000 sq km higher than 2010.

A quick update for sea ice extent for day 162 of 2014:

  • Global Sea Ice Extent is 711,000 sq km above the 1981-2010 mean. That is ranked 5 for the day.
  • Antarctic Sea Ice Extent is 1,168,000 sq km above the 1981-2010 mean. That is ranked 1 for the day.
  • Arctic Sea Ice Extent is -457,000 sq km below the 1981-2010 mean. That is ranked 30 for the day.

NOAA Data here and here here. Graphs below. Click for bigger.


Arctic_Sea_Ice_Extent_Zoomed_2014_Day_162_1981-2010

Global_Sea_Ice_Extent_Zoomed_2014_Day_162_1981-2010

Antarctic_Sea_Ice_Extent_Zoomed_2014_Day_162_1981-2010

Sea Ice Update June 11 2014 – Antarctic Sea Ice Extent is 1,157,000 sq km Above ‘Normal’

A quick update for sea ice extent for day 161 of 2014:

  • Global Sea Ice Extent is 678,000 sq km above the 1981-2010 mean. That is ranked 5 for the day.
  • Antarctic Sea Ice Extent is 1,157,000 sq km above the 1981-2010 mean. That is ranked 1 for the day.
  • Arctic Sea Ice Extent is -480,000 sq km below the 1981-2010 mean. That is ranked 30 for the day.

NOAA Data here and here here. Graphs below. Click for bigger.


Global_Sea_Ice_Extent_Zoomed_2014_Day_161_1981-2010

Antarctic_Sea_Ice_Extent_Zoomed_2014_Day_161_1981-2010

Arctic_Sea_Ice_Extent_Zoomed_2014_Day_161_1981-2010

Sea Ice Update June 9 2014 – Arctic Sea Ice Actually Increased – Global Sea Ice 3rd For The Day

Arctic Sea Ice actually rose from day 156 to 158 and it is still higher on day 159 than day 156. A strange turn of events that is not terribly common at this time of year.

A quick update for sea ice extent for day 159 of 2014:

  • Global Sea Ice Extent is 849,000 sq km above the 1981-2010 mean. That is ranked 3 for the day.
  • Antarctic Sea Ice Extent is 1,268,000 sq km above the 1981-2010 mean. That is ranked 1 for the day.
  • Arctic Sea Ice Extent is -419,000 sq km below the 1981-2010 mean. That is ranked 29 for the day.

NOAA Data here and here here. Graphs below. Click for bigger.

Global_Sea_Ice_Extent_Zoomed_2014_Day_159_1981-2010

Antarctic_Sea_Ice_Extent_Zoomed_2014_Day_159_1981-2010

Arctic_Sea_Ice_Extent_Zoomed_2014_Day_159_1981-2010

MASIE June 7 2014 – Greenland Sea and Sea of Okhotsk stubbornly gain some ice.

June 4 2014  MASIE Update – Greenland Sea and Sea of Okhotsk stubbornly gain some ice.

Region Start End Last69 Last28 Last14 Last7 Last3 Last1
Laptev Sea 897,845 704,416 -193,429 -193,429 -140,139 -114,439 -39,703 -23,197
Baffin Bay Gulf of St. Lawrence 1,688,530 1,001,337 -687,193 -289,451 -182,322 -102,281 -54,574 -22,648
Hudson Bay 1,260,903 1,163,482 -97,422 -94,674 -67,207 -61,975 -56,955 -5,924
Barents Sea 645,917 340,785 -305,132 -330,643 -107,180 -56,322 -36,933 2,164
Chukchi Sea 966,006 862,854 -103,153 -90,531 -51,824 -40,148 -34,210 -6,618
Beaufort Sea 1,070,445 1,037,039 -33,406 -33,406 -30,100 -29,604 -19,317 -6,823
Greenland Sea 603,416 640,036 36,621 30,036 -121,973 -14,988 15,509 11,209
Canadian Archipelago 853,214 799,599 -53,616 -50,666 -25,763 -10,672 -7,872 -1,801
Bering Sea 697,324 103,387 -593,937 -259,667 -14,249 -6,908 1,942 -3,014
Kara Sea 933,859 864,570 -69,289 -70,453 -19,735 -5,255 -9,543 -1,089
East Siberian Sea 1,087,137 1,031,259 -55,879 -55,879 10,358 -3,028 -9,477 224
Central Arctic 3,221,921 3,240,529 18,608 -7,484 -6,237 -819 723 -73
Baltic Sea 15,337 0 -15,337 -7,864 0 0 0 0
Yellow Sea 0 0 0 0 0 0 0 0
Sea of Okhotsk 853,240 78,049 -775,191 -91,319 -3,103 5,721 29,484 12,685
Northern Hemisphere (Total) 14,805,115 11,868,484 -2,936,631 -1,545,864 -759,503 -441,057 -220,926 -44,904
NH (Average Loss per Day) -41,952 -55,209 -54,250 -63,008 -73,642 -44,904

MASIE Arctic Ice Extent as of 2014-157

Sea Ice Update June 7 2014 – Global Sea Ice Extent is 704,000 sq km above ‘Normal’

A quick update for sea ice extent for day 153 of 2014:

  • Global Sea Ice Extent is 704,000 sq km above the 1981-2010 mean.
  • Antarctic Sea Ice Extent is 1,214,000 sq km above the 1981-2010 mean.  90th daily record for 2014.
  • Arctic Sea Ice Extent is -511,000 sq km below the 1981-2010 mean.

NOAA Data here and here here. Graphs below. Click for bigger.


Global_Sea_Ice_Extent_Zoomed_2014_Day_157_1981-2010

Antarctic_Sea_Ice_Extent_Zoomed_2014_Day_157_1981-2010

Arctic_Sea_Ice_Extent_Zoomed_2014_Day_157_1981-2010

MASIE June 4 2014 – Arctic Ice Extent By Region – A Day of More Ice

June 4 2014  MASIE Update – Arctic Sea Ice actually rose 31,421 sq km over the last day because of the Chukchi Sea, Greenland Sea, East Siberian Sea and Baffin Bay.

This is the gain/loss up to day 154. Negative = loss. Sorted with biggest loser in last 7 days at top. Northern Hemisphere is the grand total.

Region Start End Last 66 Last 28 Last 14 Last 7 Last 3 Last 1
Laptev Sea 897,845 744,119 -153,726 -153,726 -141,132 -85,355 -68,528 0
Barents Sea 645,917 377,719 -268,198 -321,345 -101,635 -46,684 -9,736 0
Sea of Okhotsk 853,240 48,565 -804,675 -160,912 -38,775 -24,371 -23,554 0
Chukchi Sea 966,006 897,063 -68,943 -64,211 -12,895 -21,302 -9,445 12,327
Kara Sea 933,859 874,113 -59,746 -60,910 -18,958 -15,004 -2,806 0
Bering Sea 697,324 101,445 -595,879 -263,045 -15,050 -13,627 -6,230 -1,836
Greenland Sea 603,416 624,527 21,112 -16,305 -74,602 -12,264 -15,805 2,607
Baffin Bay Gulf of St. Lawrence 1,688,530 1,055,912 -632,619 -255,952 -160,732 -11,265 -13,623 10,196
Hudson Bay 1,260,903 1,220,436 -40,467 -37,052 -14,444 -10,029 1,782 -1,304
Beaufort Sea 1,070,445 1,056,356 -14,089 -3,767 -7,416 -9,749 -8,730 0
Canadian Archipelago 853,214 807,471 -45,744 -45,744 -22,296 -7,728 -2,262 0
Central Arctic 3,221,921 3,239,806 17,885 -8,207 -7,104 -4,176 -1,505 0
Baltic Sea 15,337 0 -15,337 -8,402 0 0 0 0
Yellow Sea 0 0 0 0 0 0 0 0
East Siberian Sea 1,087,137 1,040,736 -46,401 -46,401 12,341 14,074 5,682 9,431
Northern Hemisphere (Total) 14,805,115 12,089,410 -2,715,704 -1,447,027 -602,763 -247,817 -154,761 31,421
NH (Average Loss per Day) -40,533 -51,680 -43,054 -35,402 -51,587 31,421

MASIE Arctic Ice Extent as of 2014-154

Sea Ice Update June 3 2014 – Global Sea Ice Highest Since 1996

A quick update for sea ice extent for day 153 of 2014:

  • Global Sea Ice Extent is 824,000 sq km above the 1981-2010 mean.
  • Antarctic Sea Ice Extent is 1,221,000 sq km above the 1981-2010 mean.
  • Arctic Sea Ice Extent is -397,000 sq km below the 1981-2010 mean.

NOAA Data here and here here. Graphs below. Click for bigger.

Global_Sea_Ice_Extent_Zoomed_2014_Day_153_1981-2010

Antarctic_Sea_Ice_Extent_Zoomed_2014_Day_153_1981-2010

Arctic_Sea_Ice_Extent_Zoomed_2014_Day_153_1981-2010

MASIE June 2 2014 – Arctic Ice Extent By Region As of Day 152

June 2 2014  MASIE Update

This is the gain/loss up to day 152. Negative = loss. Sorted with biggest loser in last 7 days at top. Northern Hemisphere is the grand total.


Region Start End Last 64 Last 28 Last 14 Last 7 Last 3 Last 1
Baffin Bay Gulf of St. Lawrence 1,688,530 1,043,246 -645,284 -307,375 -174,654 -94,659 -67,951 -26,289
Greenland Sea 603,416 625,730 22,314 -12,228 -88,003 -77,276 -16,113 -14,602
Barents Sea 645,917 384,752 -261,165 -294,758 -121,072 -63,635 -35,573 -2,703
Laptev Sea 897,845 812,647 -85,198 -85,198 -80,695 -27,269 -13,638 0
Hudson Bay 1,260,903 1,218,054 -42,849 -36,638 -1,601 -21,791 -14,010 -600
Sea of Okhotsk 853,240 48,565 -804,675 -211,784 -51,509 -19,439 -22,078 -23,554
Canadian Archipelago 853,214 807,471 -45,744 -45,744 -26,055 -15,659 -6,206 -2,262
Bering Sea 697,324 103,281 -594,042 -251,810 -43,526 -13,488 -12,554 -4,393
Beaufort Sea 1,070,445 1,056,356 -14,089 -7,785 3,780 -13,149 -10,567 -8,730
Kara Sea 933,859 872,281 -61,578 -62,742 -44,356 -12,319 -6,623 -4,639
Chukchi Sea 966,006 884,736 -81,270 -66,680 -25,163 -10,418 -24,745 -21,772
Central Arctic 3,221,921 3,240,263 18,342 -7,750 -6,557 -7,153 -1,375 -1,048
Baltic Sea 15,337 0 -15,337 -8,219 0 0 0 0
Yellow Sea 0 0 0 0 0 0 0 0
East Siberian Sea 1,087,137 1,035,054 -52,083 -52,083 -52,083 20,938 1,015 0
Northern Hemisphere (Total) 14,805,115 12,133,578 -2,671,537 -1,451,859 -711,559 -355,671 -230,756 -110,593
NH (Average Loss per Day) -41,101 -51,852 -50,826 -50,810 -76,919 -110,593

MASIE Arctic Ice Extent as of 2014-152