Sea Ice Update June 2 2014

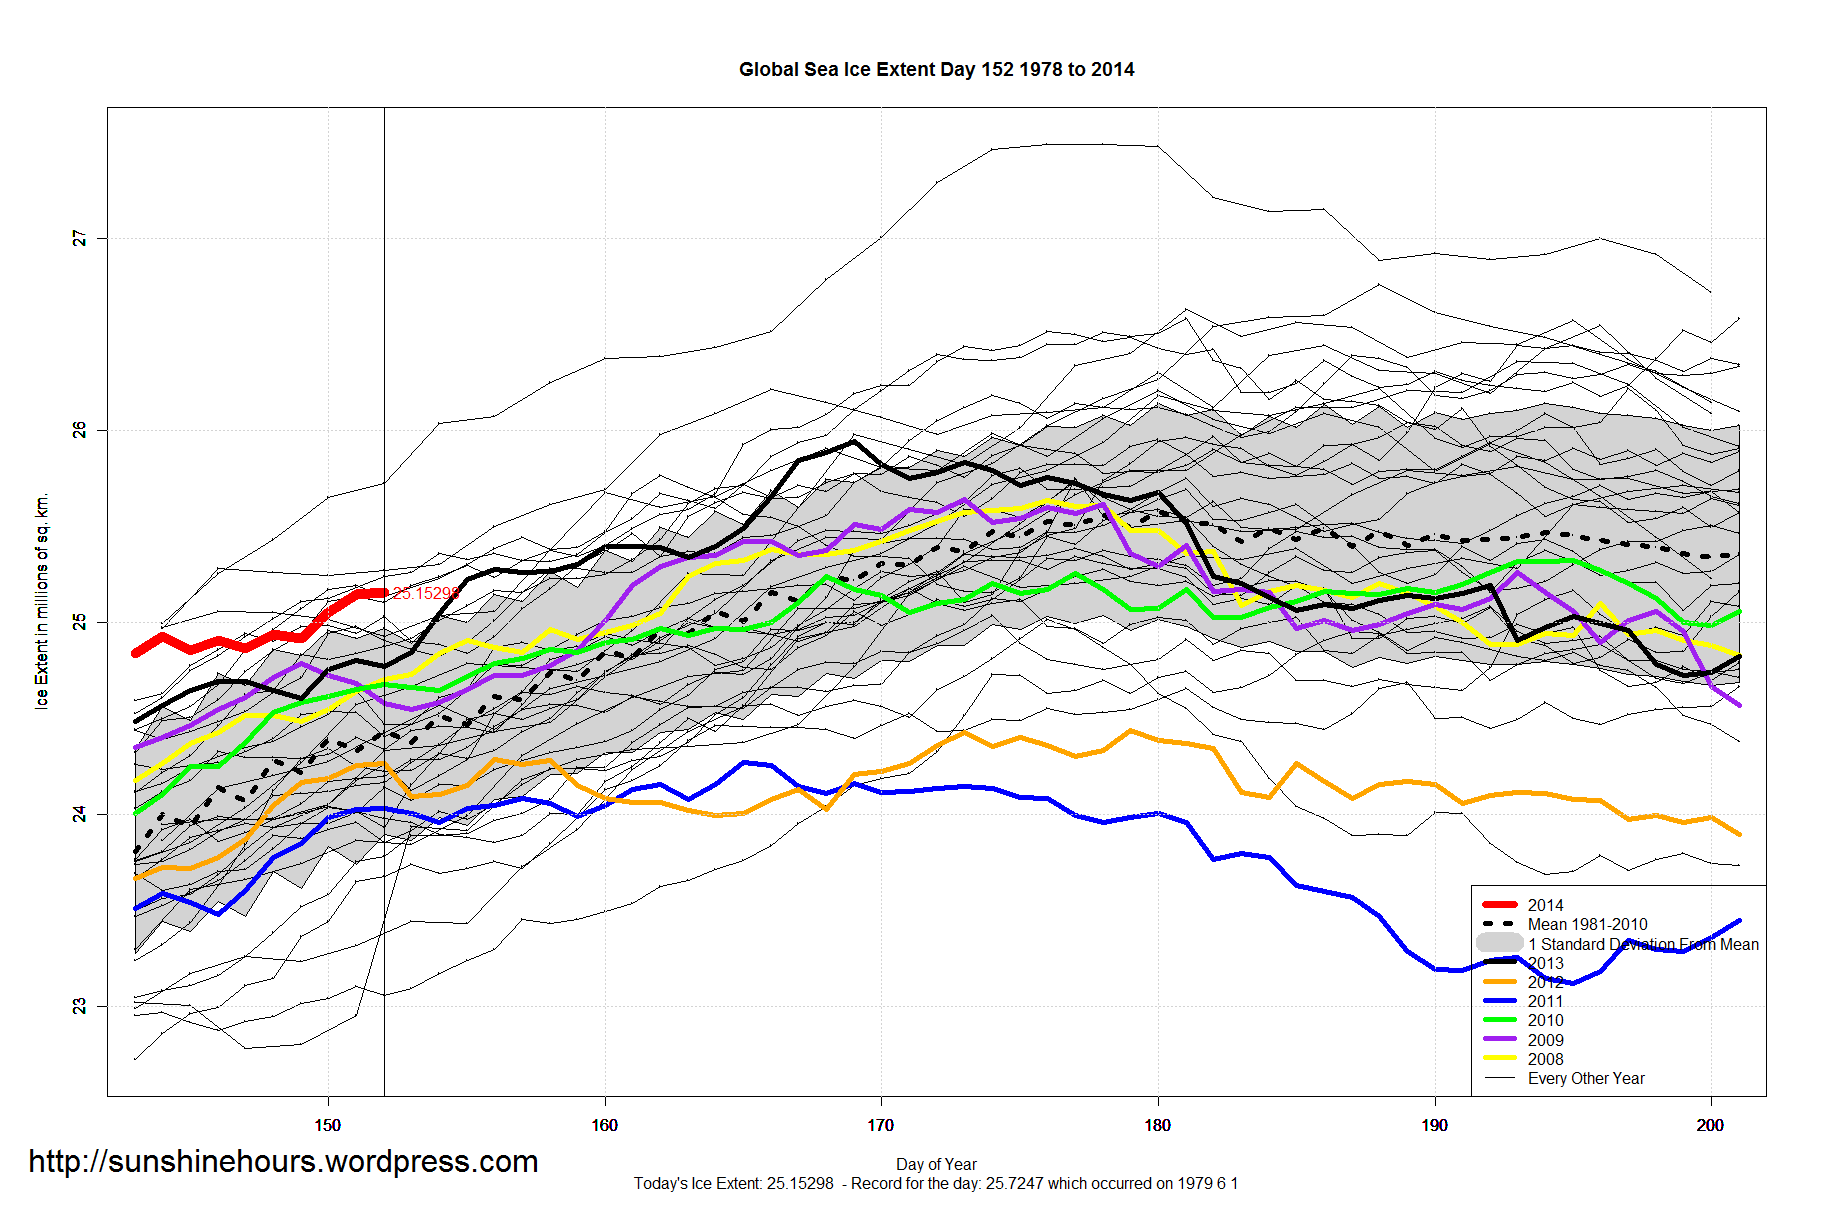
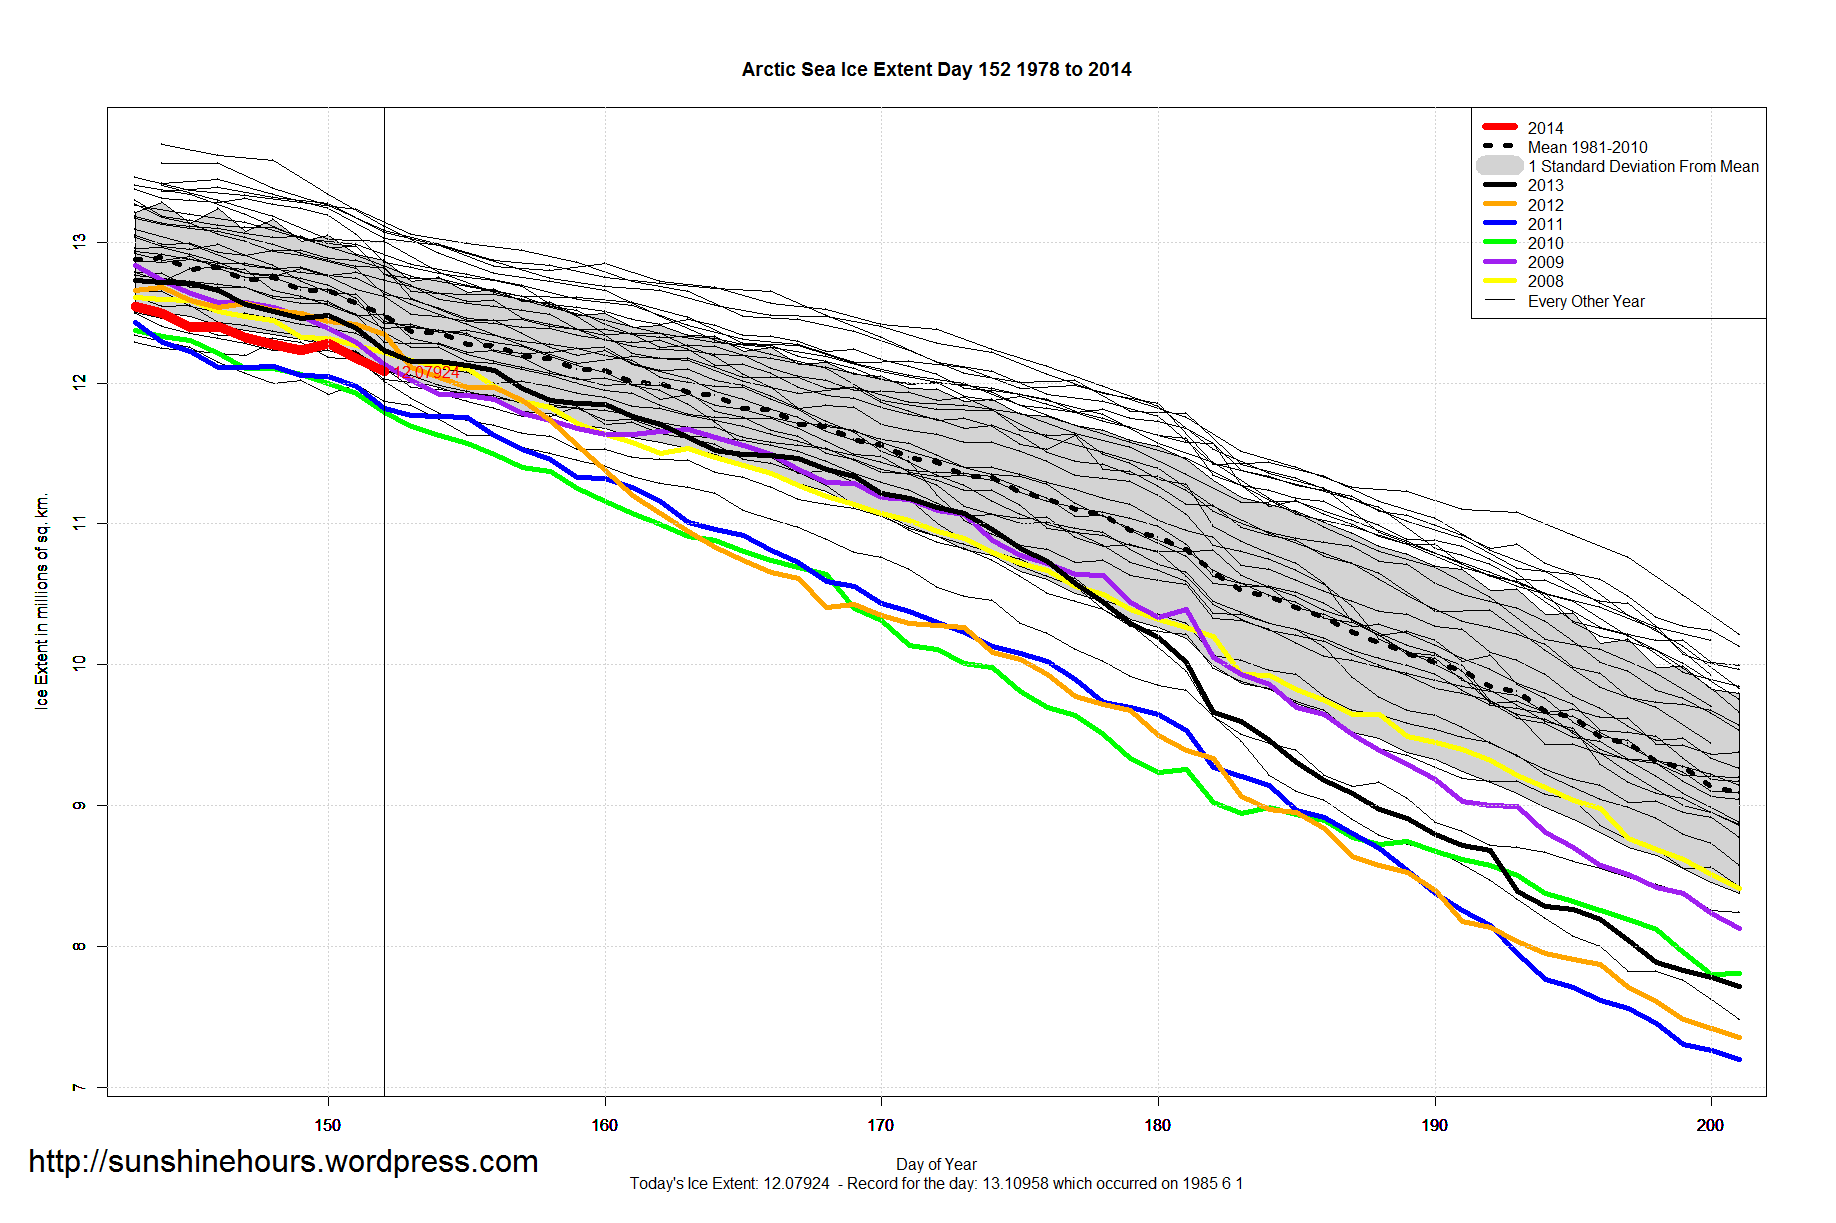
A quick update for sea ice extent for day 152 of 2014:

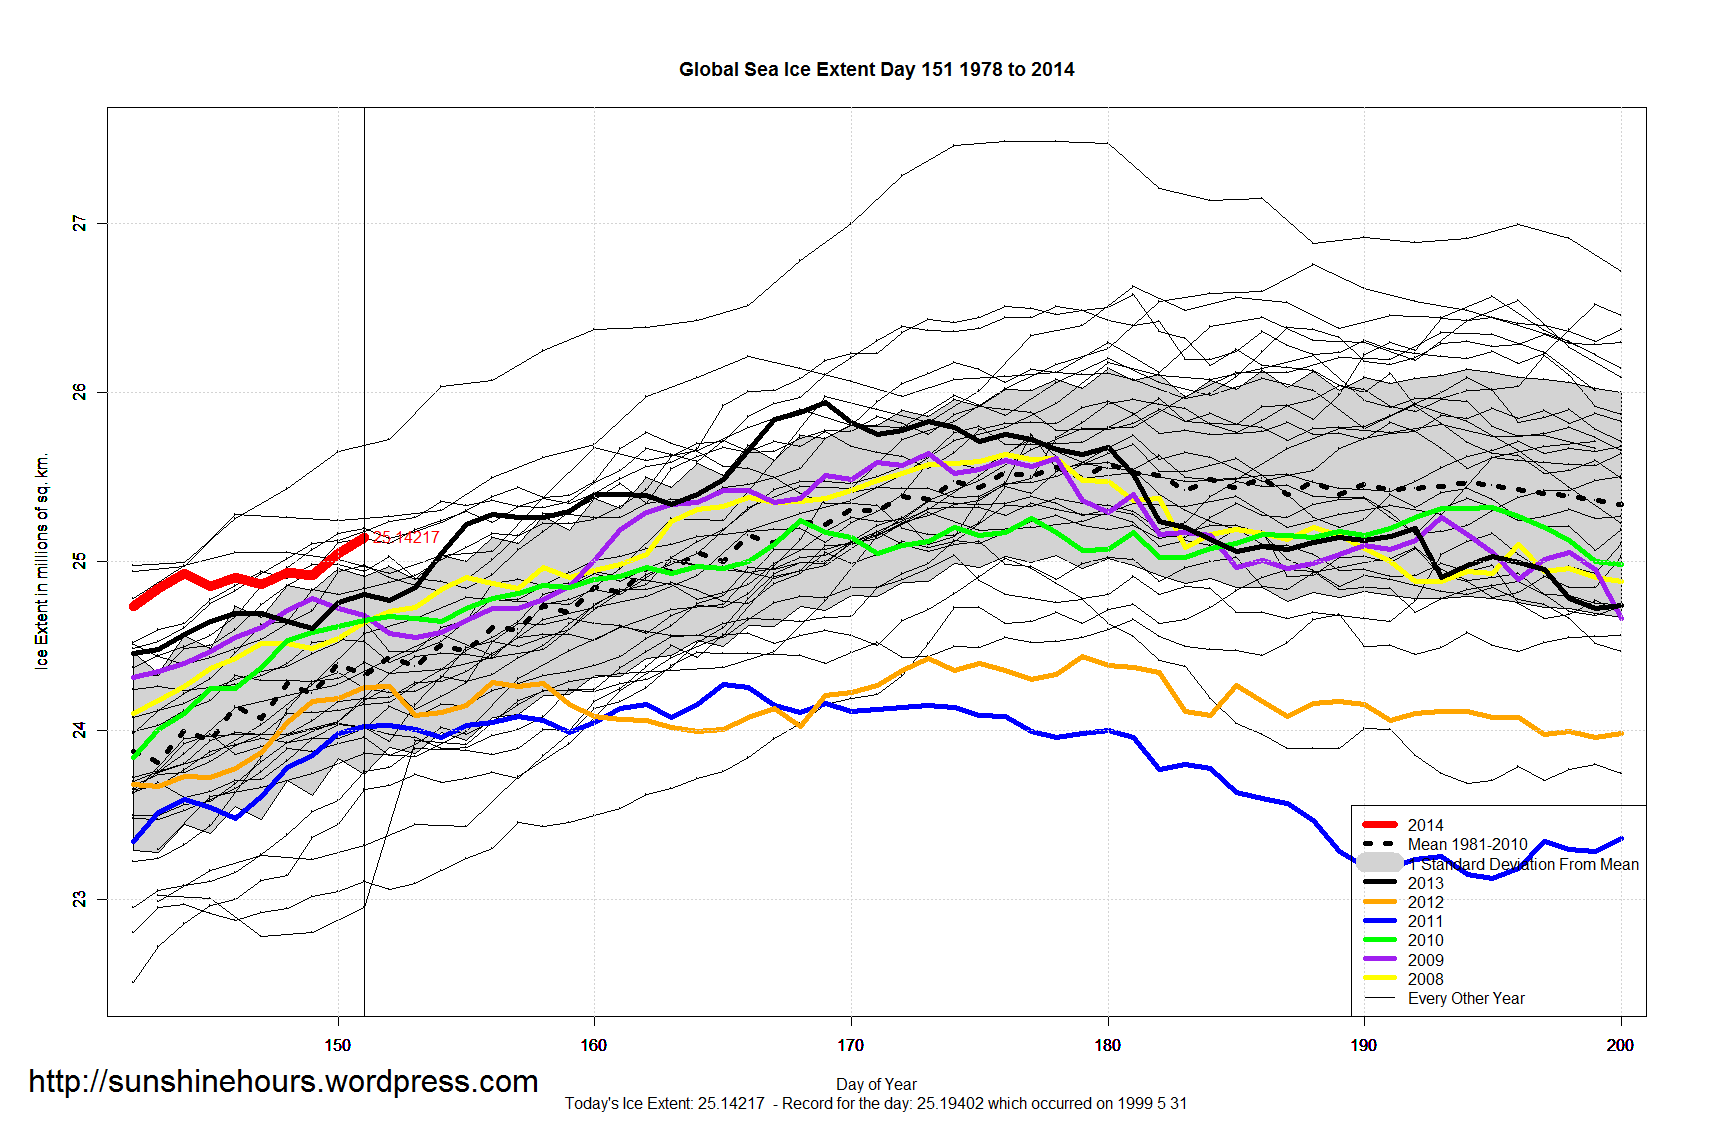
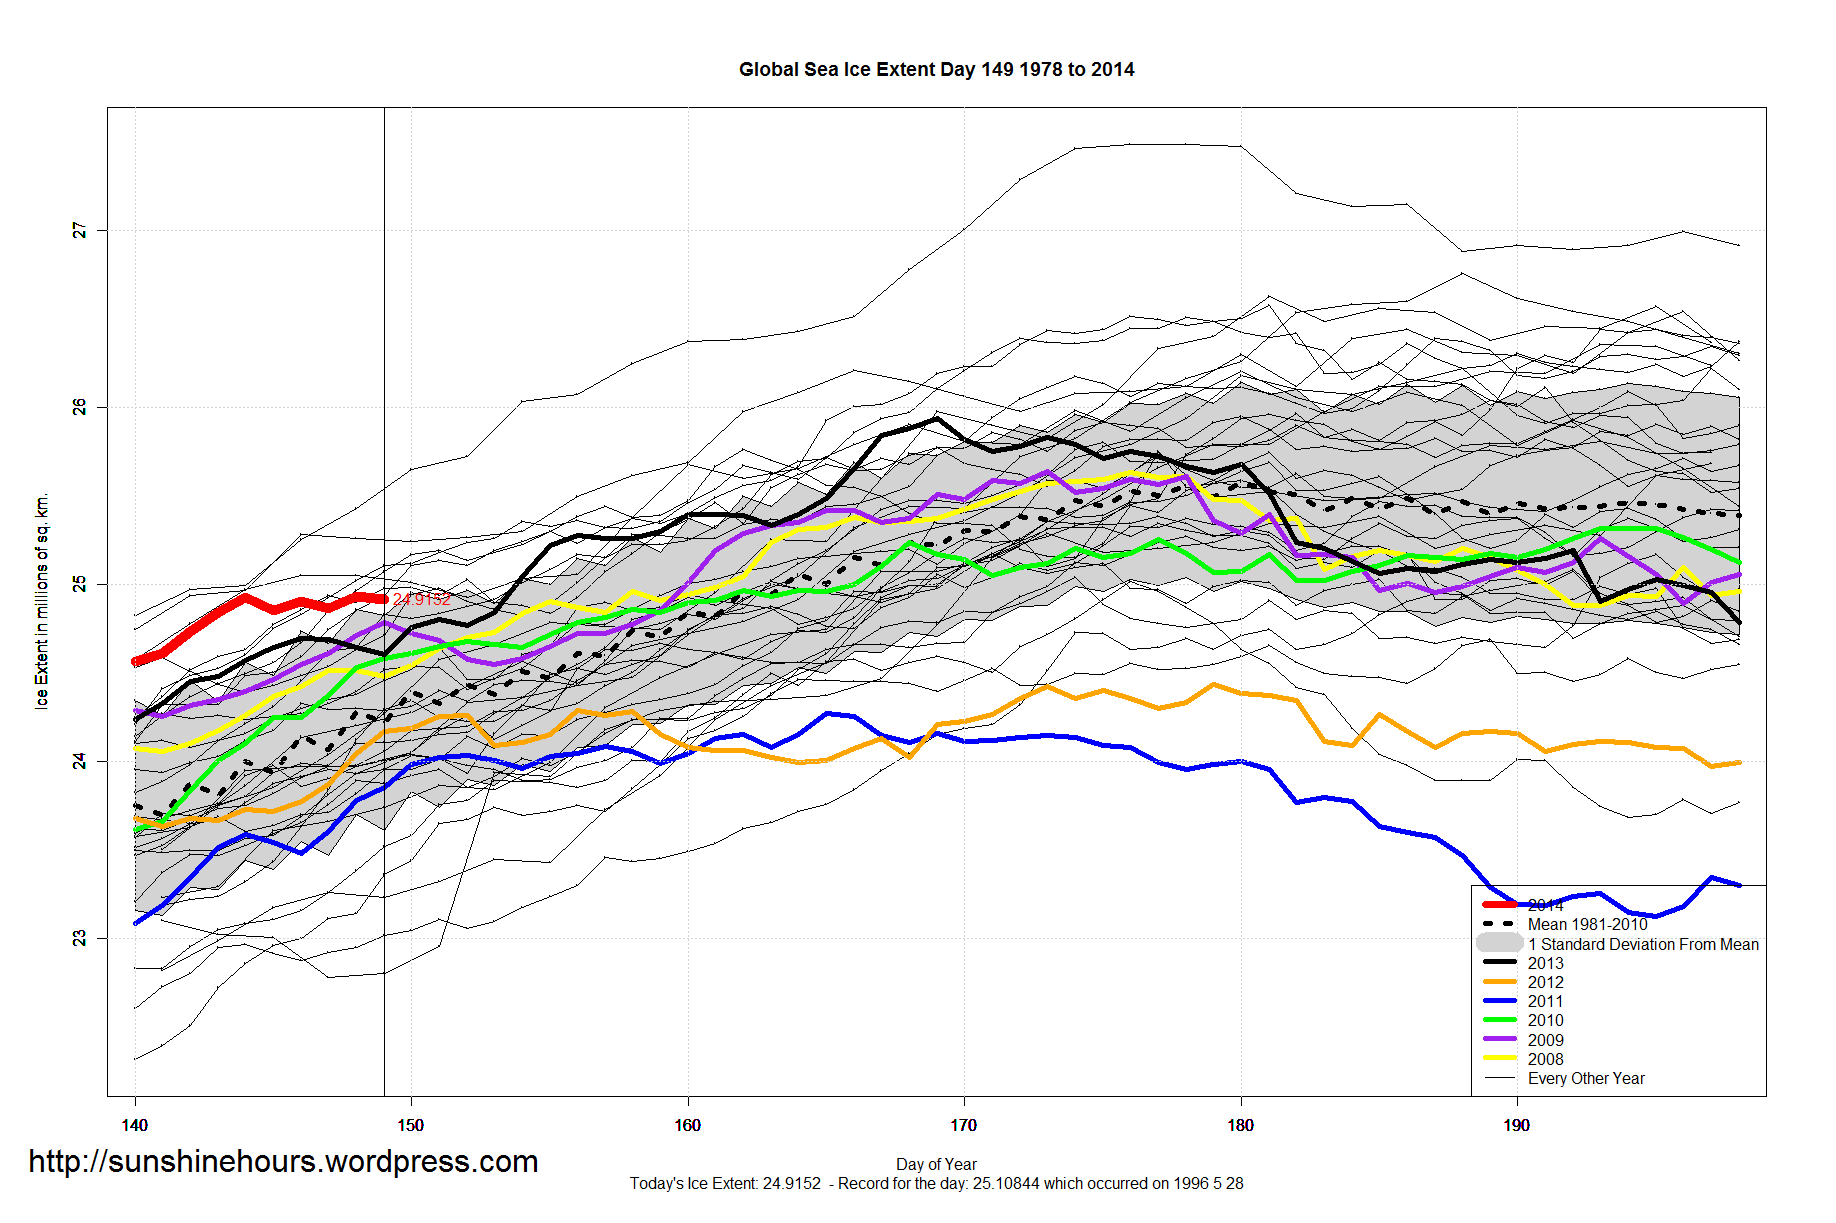
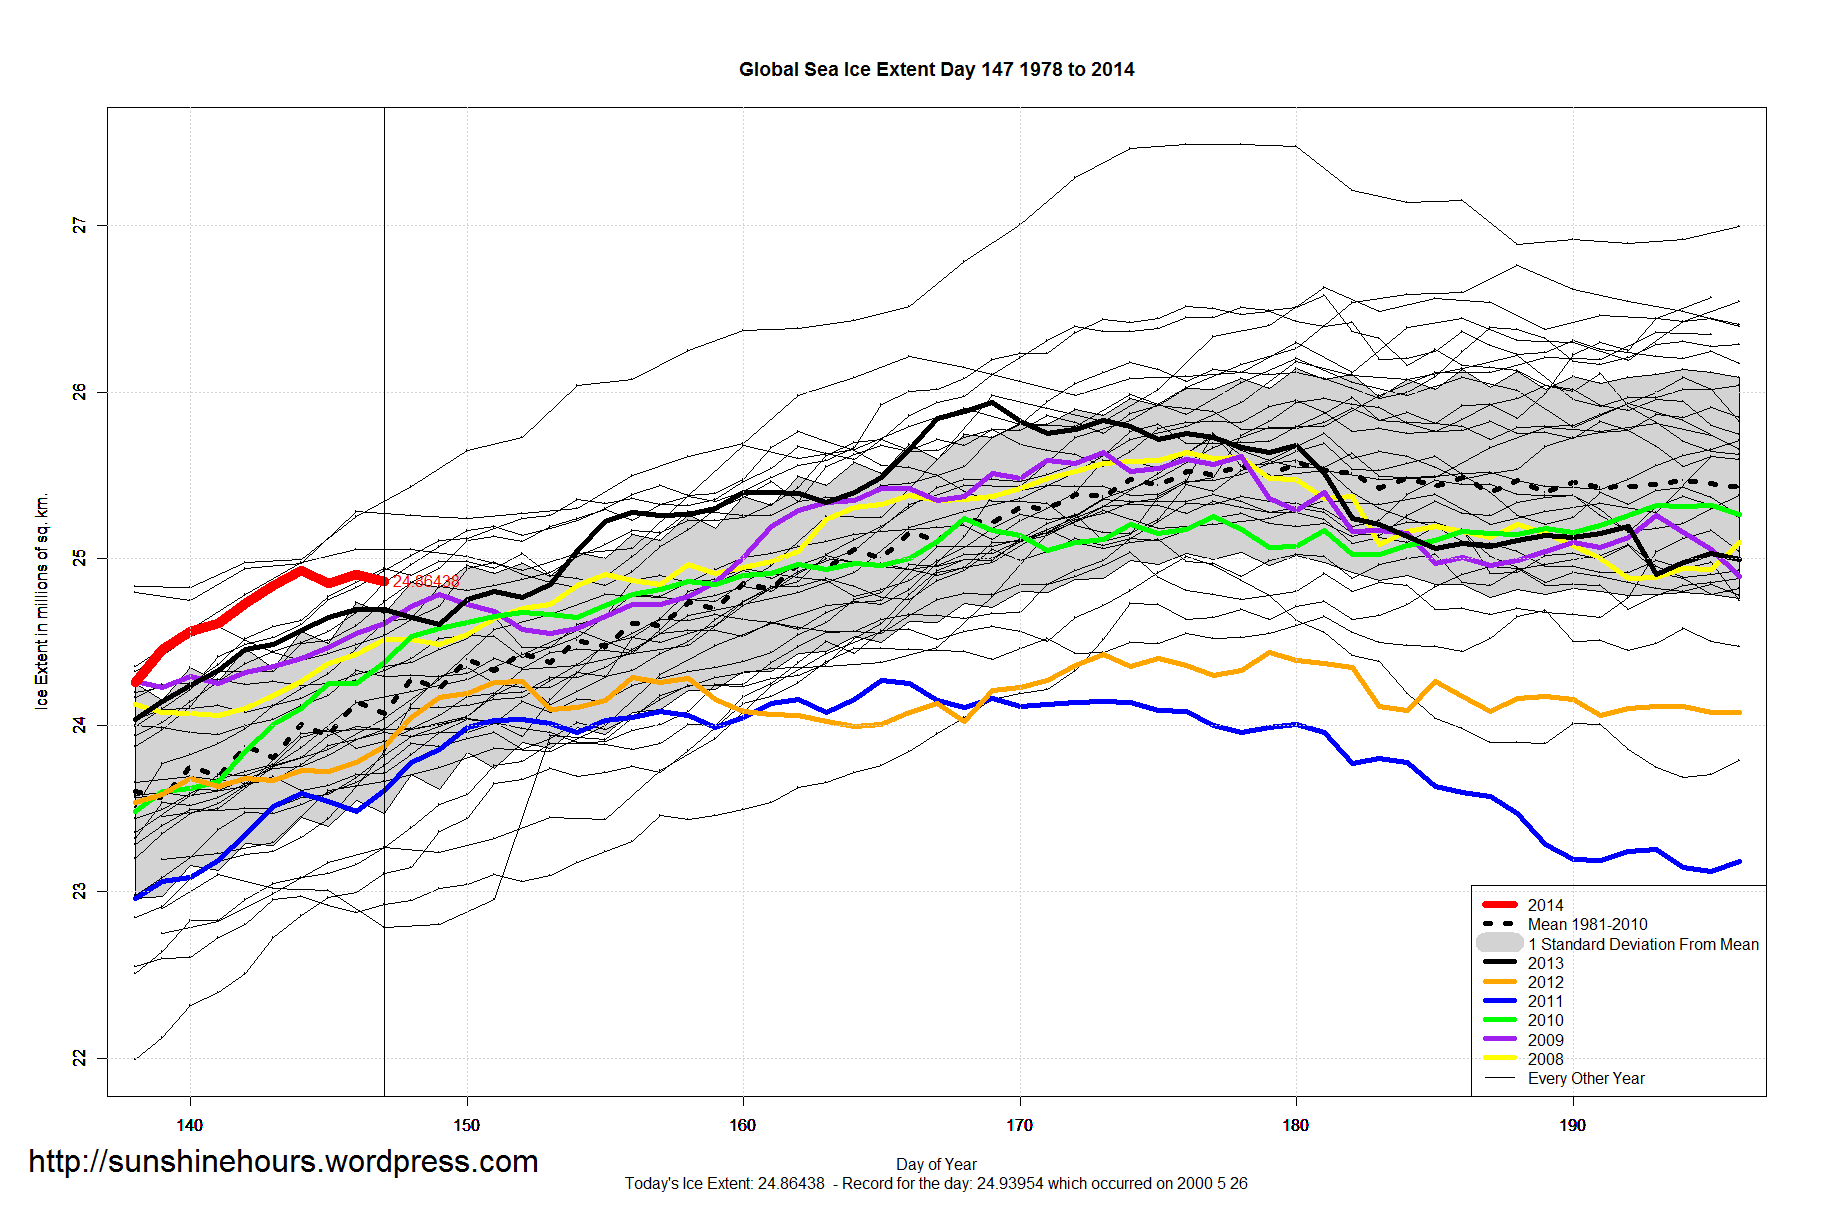
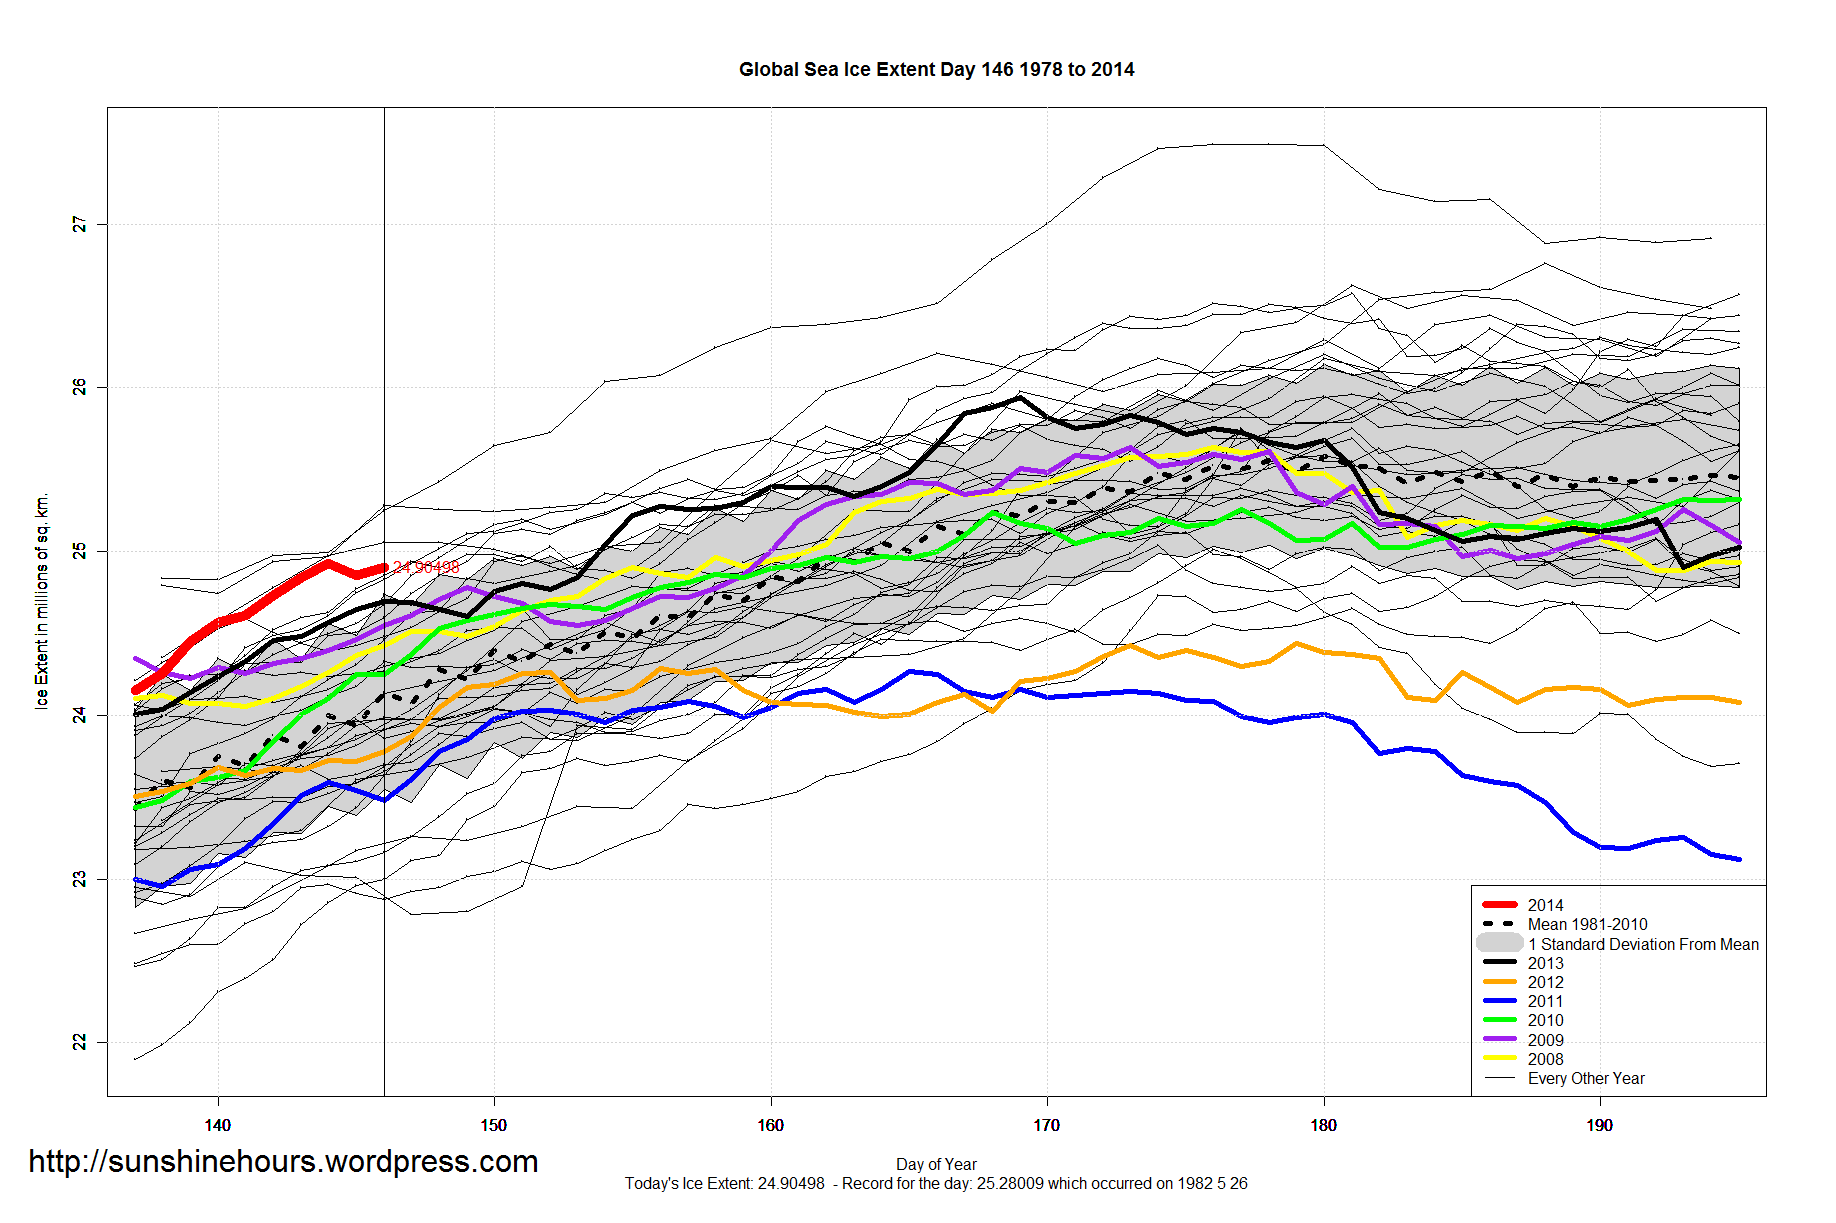
  • Global Sea Ice Extent is 766,000 sq km above the 1981-2010 mean. That is ranked 4 for the day.
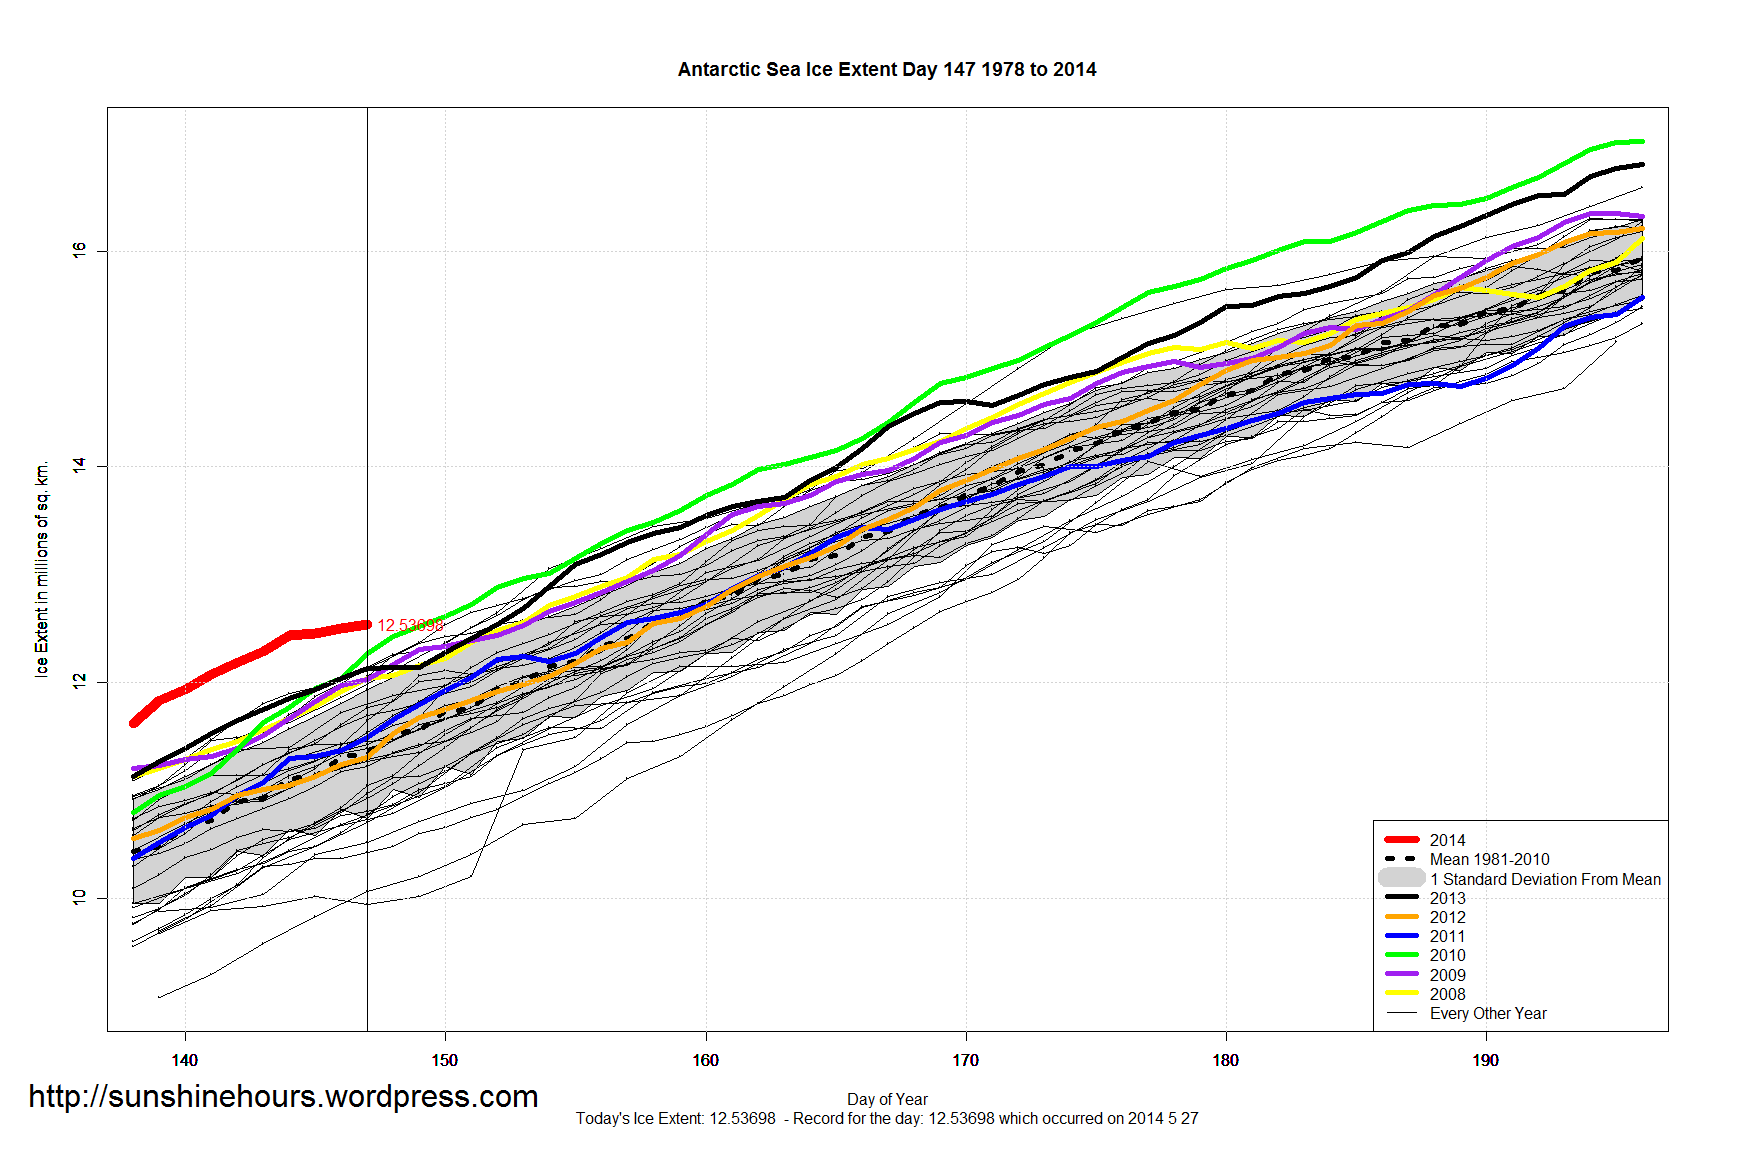
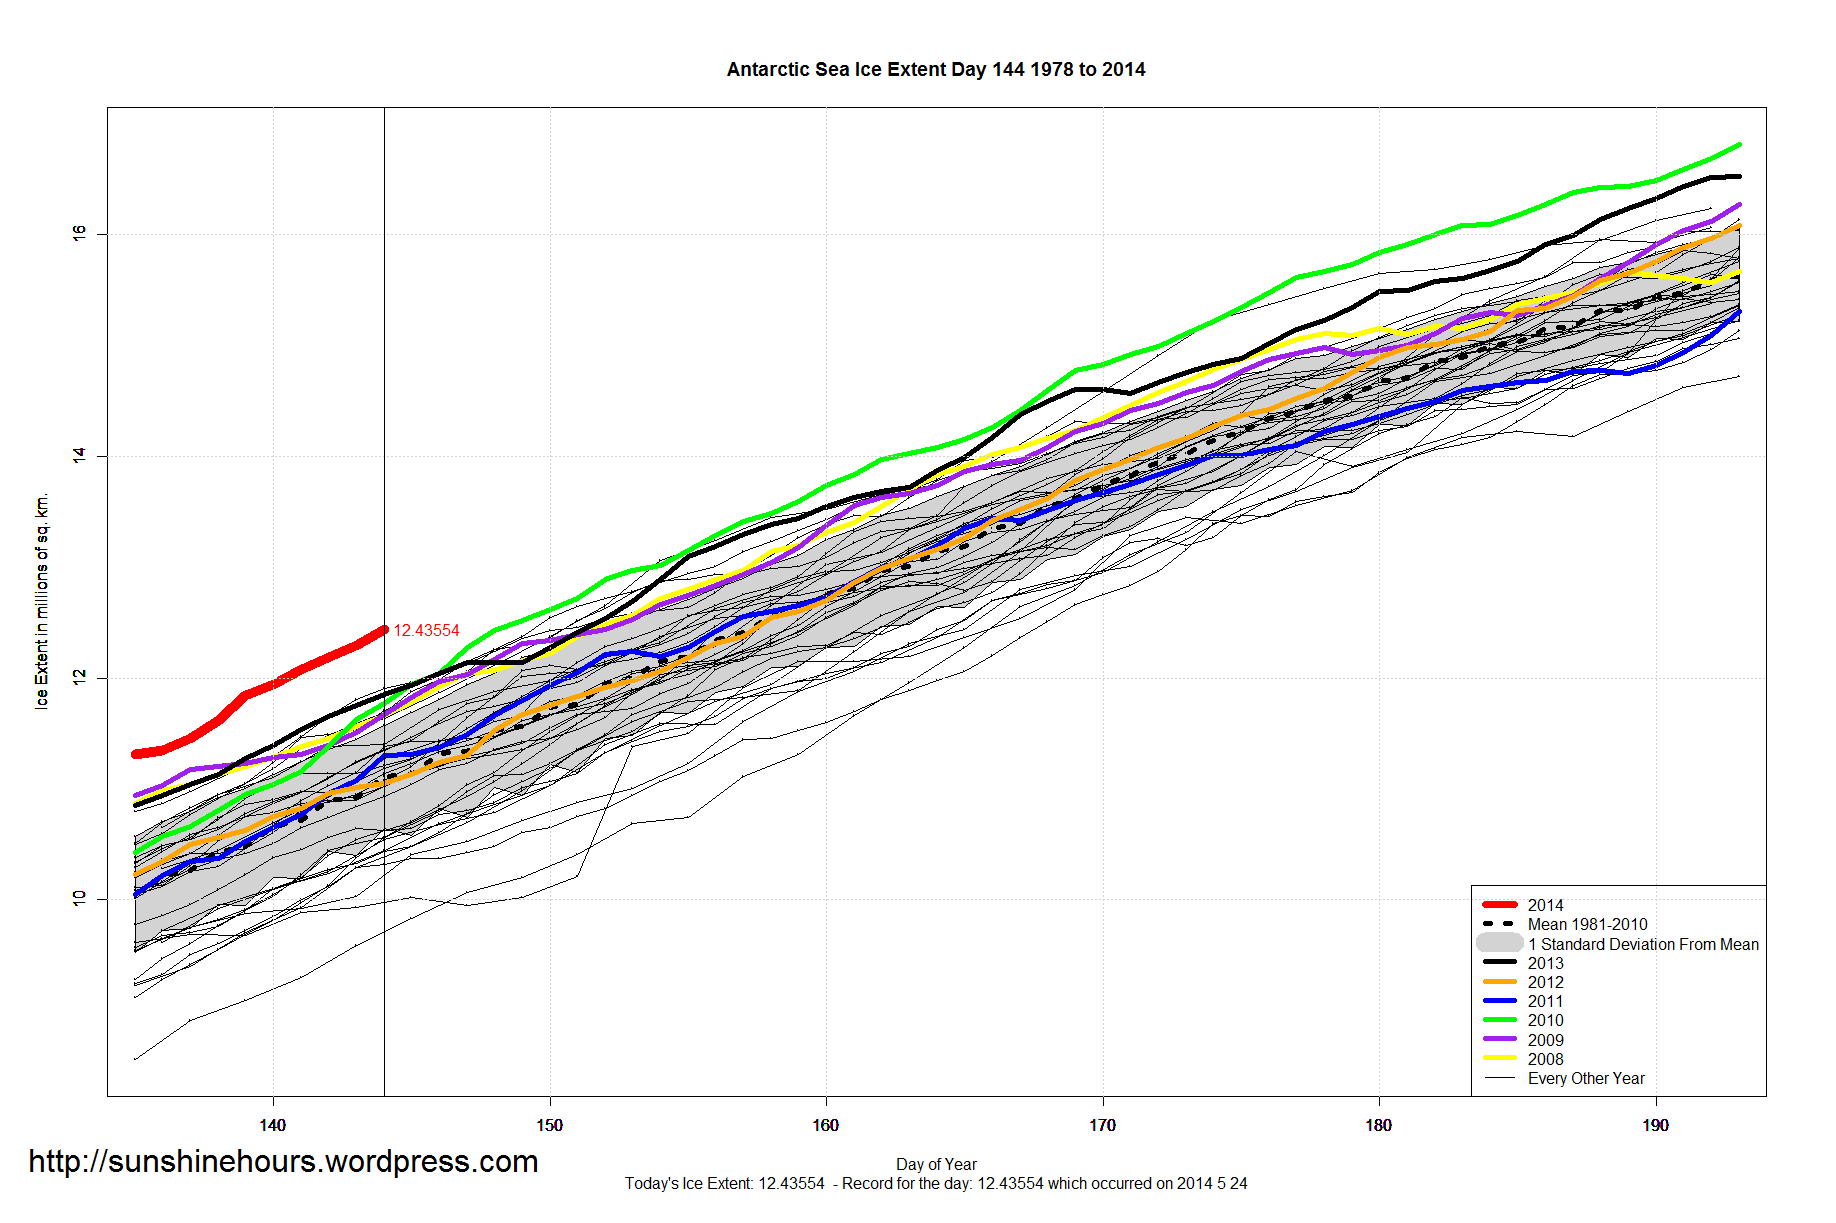
  • Antarctic Sea Ice Extent is 1,212,000 sq km above the 1981-2010 mean. That is ranked 1 for the day.
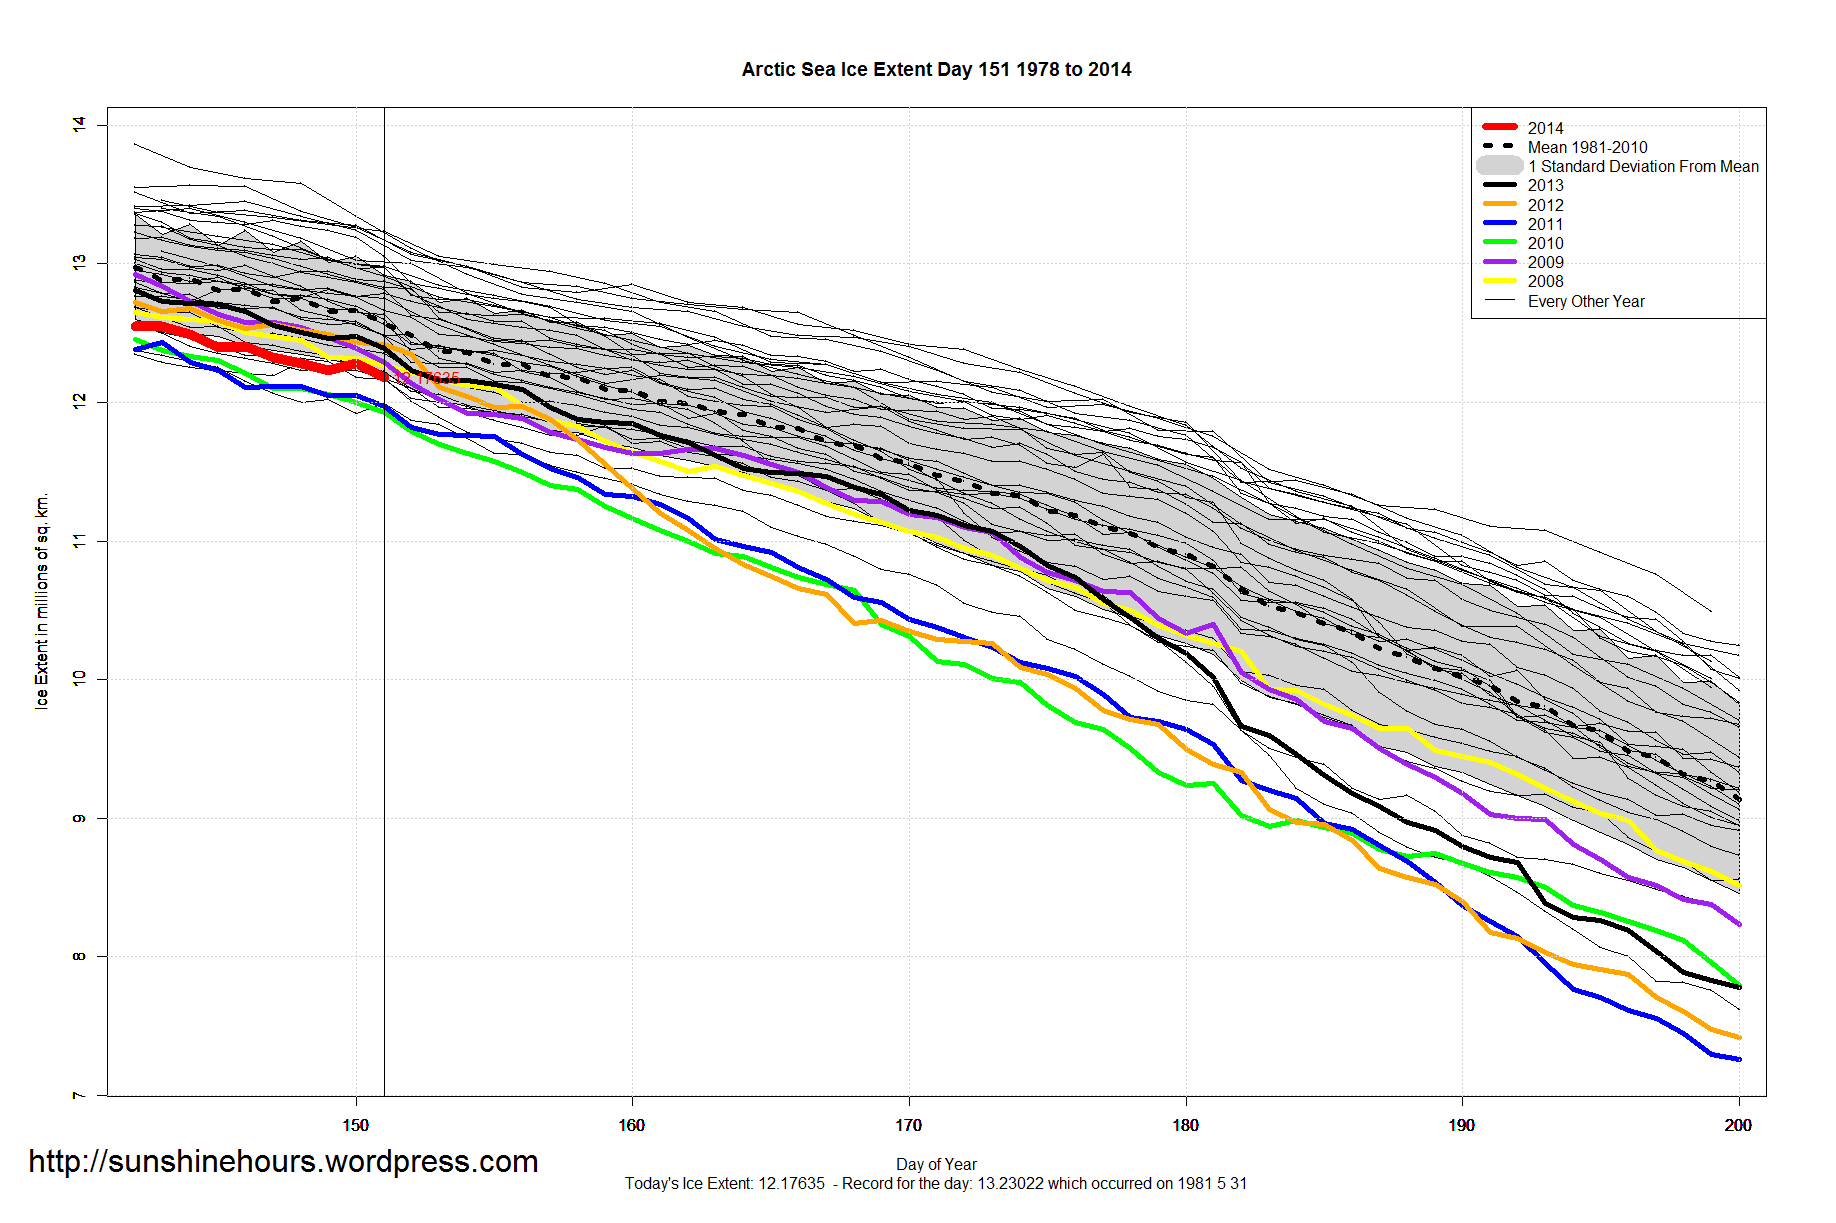
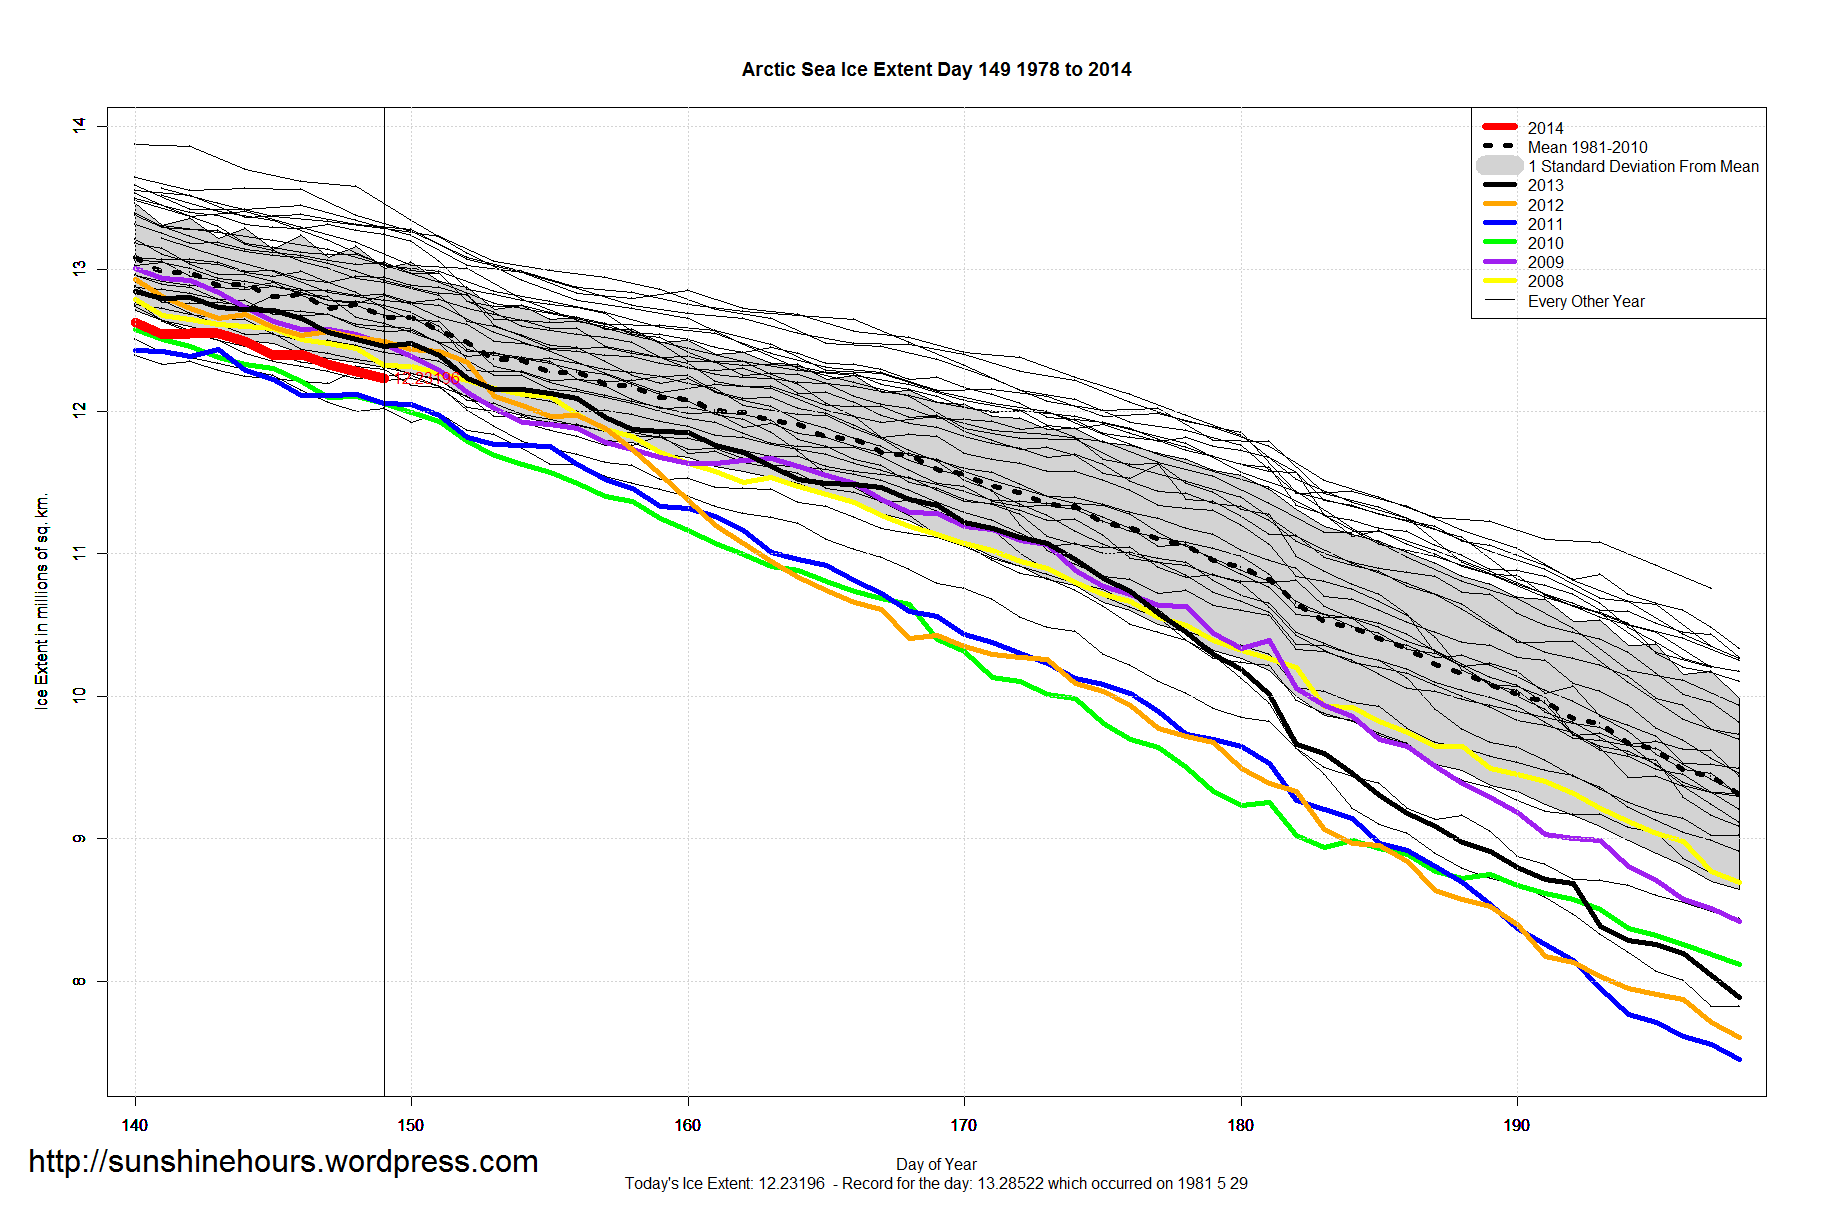
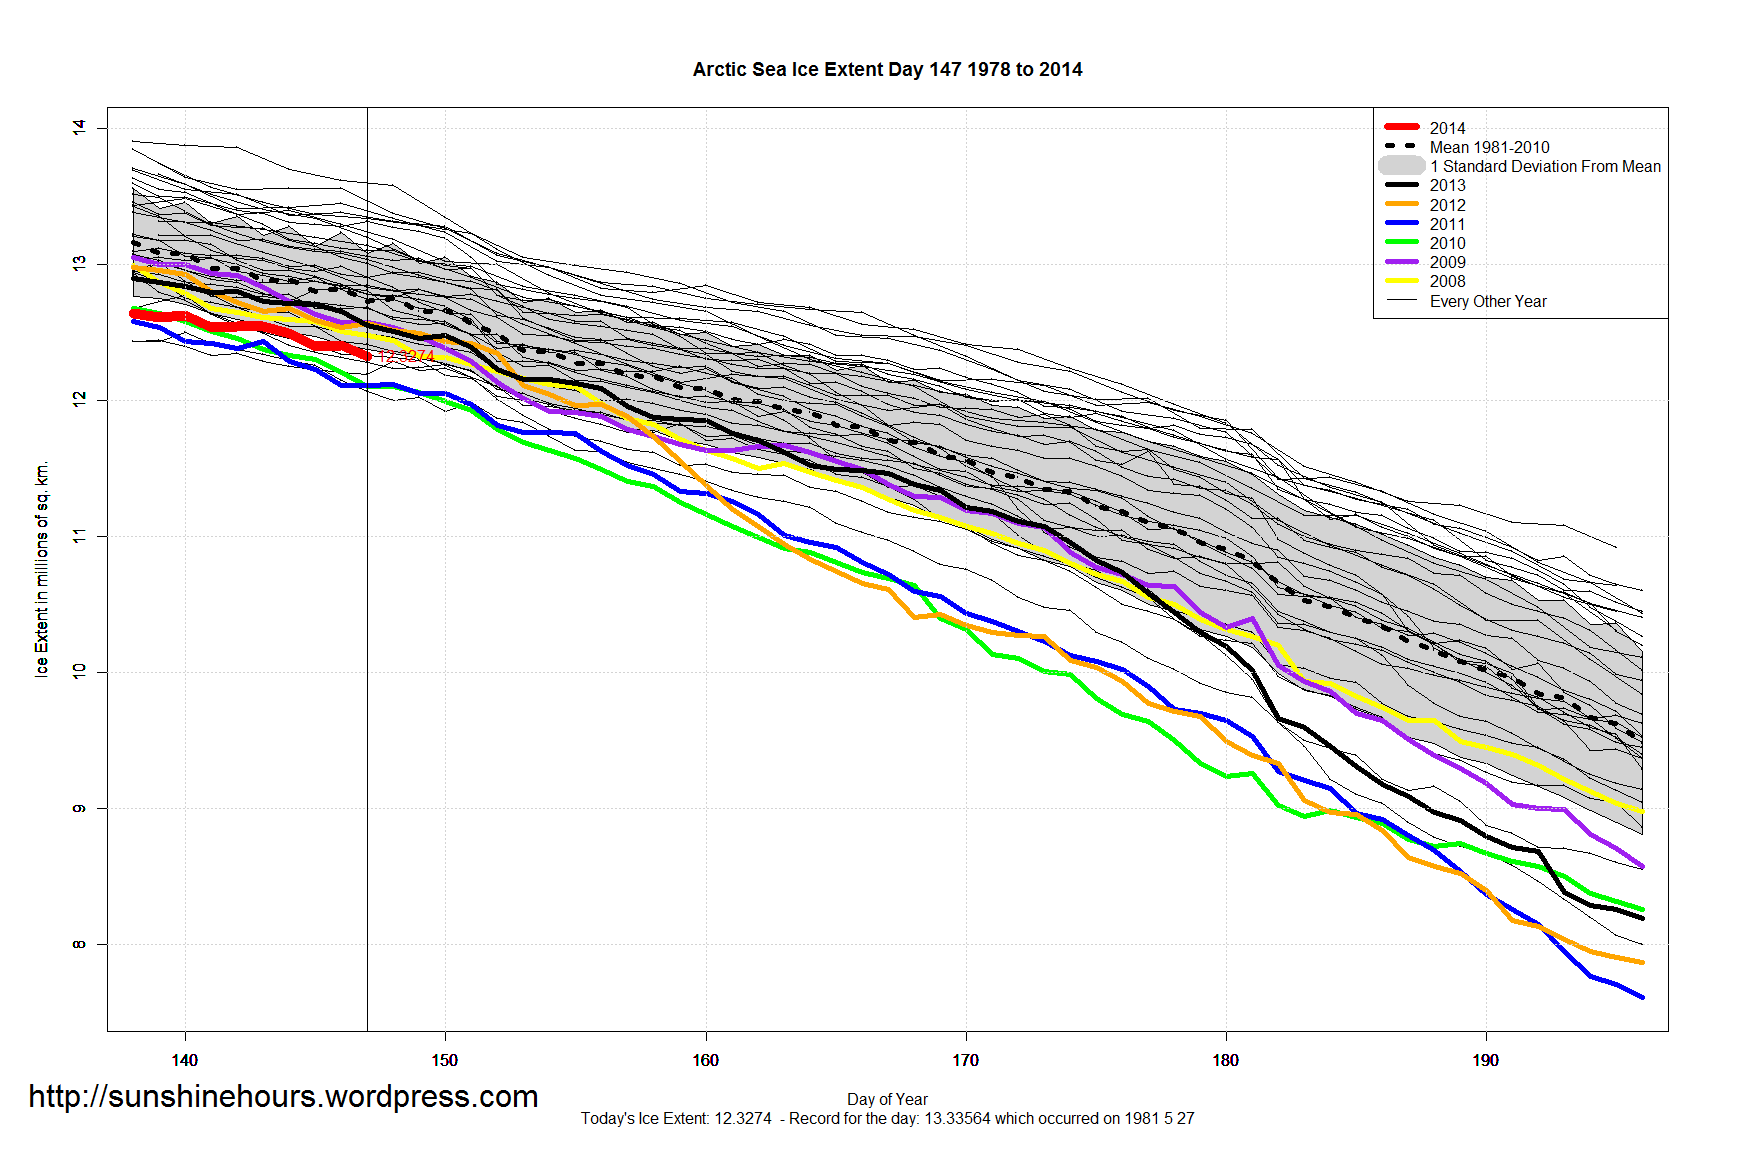
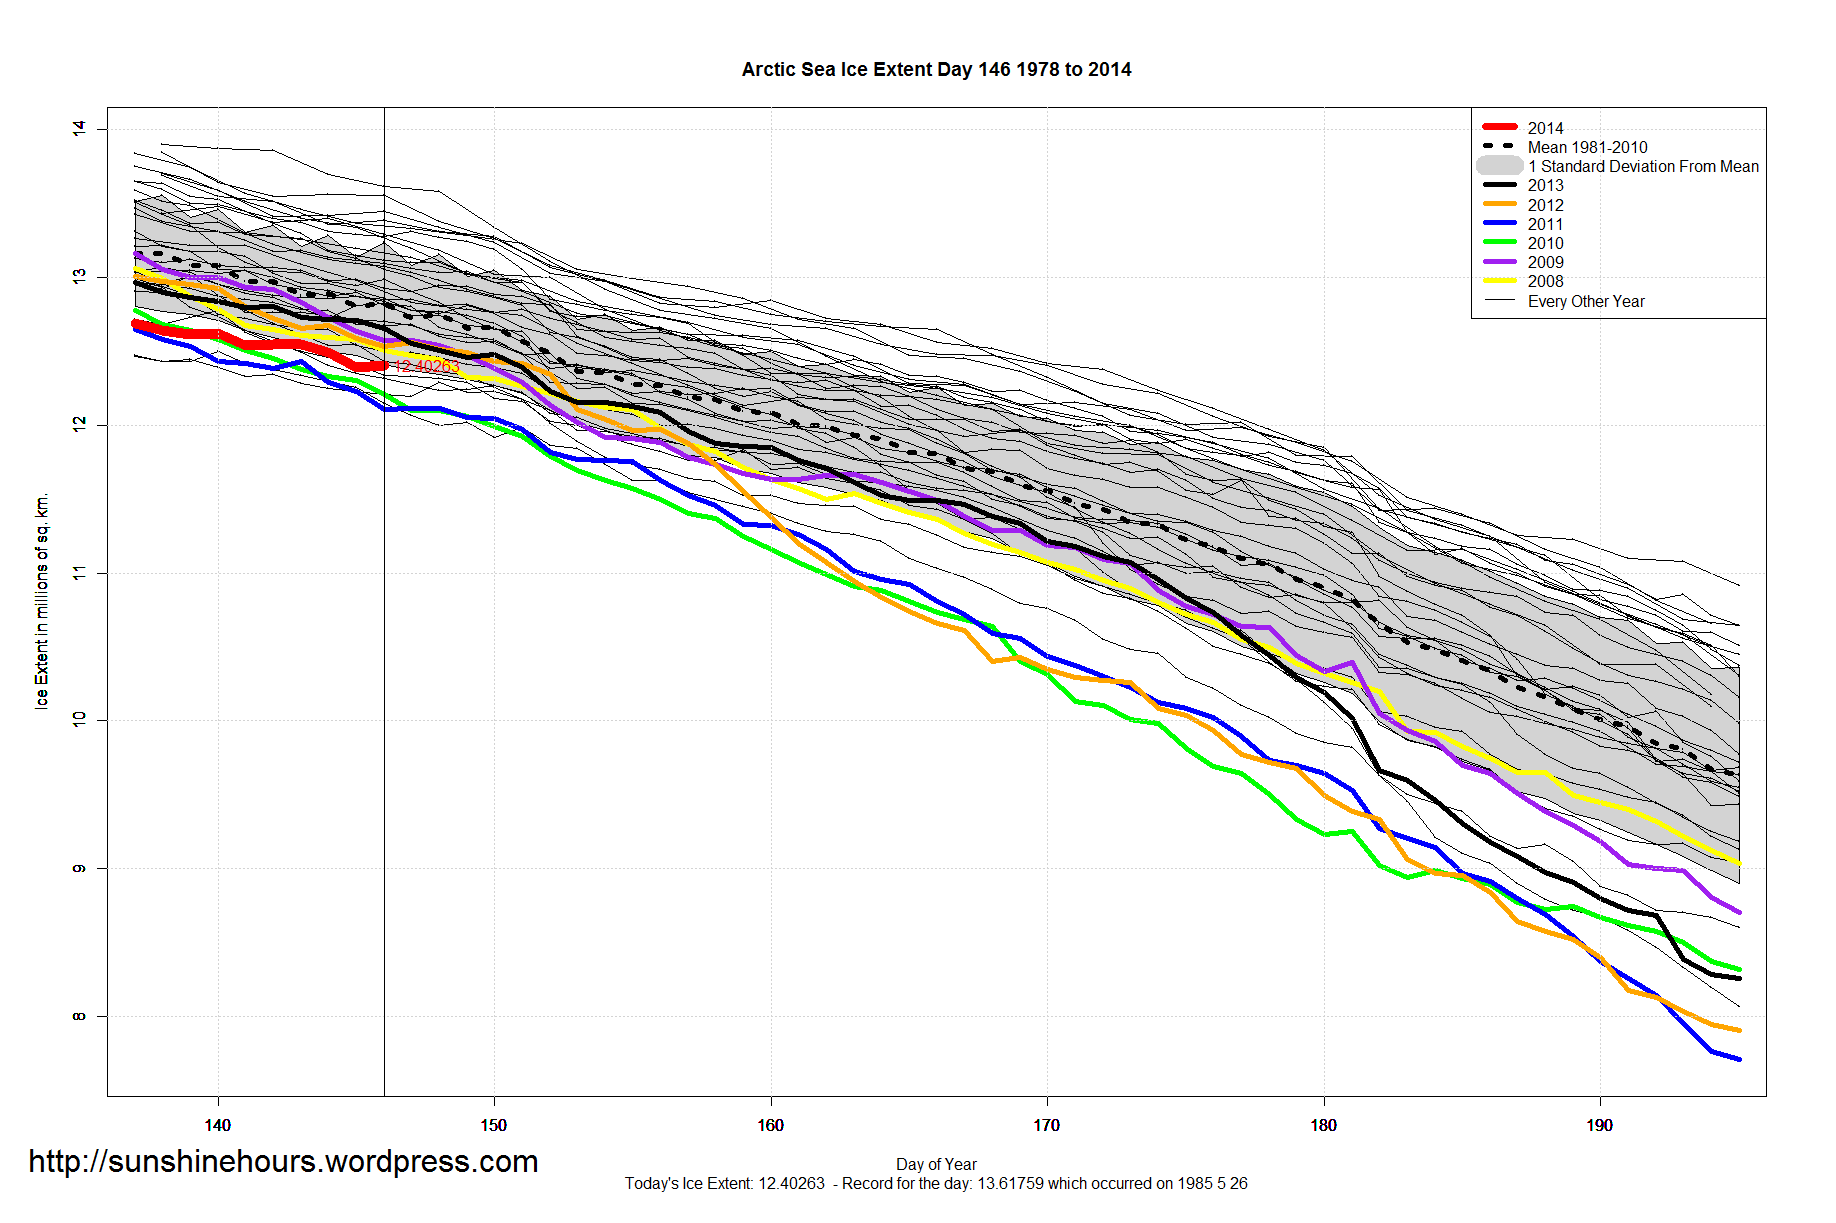
  • Arctic Sea Ice Extent is -447,000 sq km below the 1981-2010 mean. That is ranked 31 for the day.

NOAA Data here and here here. Graphs below. Click for bigger.   Global_Sea_Ice_Extent_Zoomed_2014_Day_152_1981-2010 Antarctic_Sea_Ice_Extent_Zoomed_2014_Day_152_1981-2010 Arctic_Sea_Ice_Extent_Zoomed_2014_Day_152_1981-2010

AMO Update as of April 2014

UPDATE: Sorry about the title. Not sure what happened. Fixed now.

The AMO is definitely linked with climate cycles. And probably has more to do with Arctic Sea Ice than any other factor. This is loess trend of each month of the AMO on the same graph.

The winter months started trending down around 2005/2008. Spring months have been flattish since the same time. Only July-Sept have stayed high. June has been flat.

The first four months of 2014 were all negative.

AMO From 2000 as of 2014 April

Same graph, but from 1856 and 1979. The spread in months now seems to be repeating the pattern way back in 1856. But that could be an endpoint artifact.

AMO From 1856 as of 2014 April

AMO From 1979 as of 2014 April


Same graphs, but the data and the trends.

AMO From 1856 as of 2014 April (all lines) AMO From 1979 as of 2014 April (all lines) AMO From 2000 as of 2014 April (all lines)

Sea Ice Update June 1 2014 – Global Sea Ice Extent is 767,000 sq km Above ‘Normal’

A quick update for sea ice extent for day 151 of 2014:

  • Global Sea Ice Extent is 767,000 sq km above the 1981-2010 mean.
  • Antarctic Sea Ice Extent is 1,233,000 sq km above the 1981-2010 mean. 84th daily record.
  • Arctic Sea Ice Extent is -466,000 sq km below the 1981-2010 mean.

NOAA Data here and here here.

Graphs below. Click for bigger.


Global_Sea_Ice_Extent_Zoomed_2014_Day_151_1981-2010

Antarctic_Sea_Ice_Extent_Zoomed_2014_Day_151_1981-2010

Arctic_Sea_Ice_Extent_Zoomed_2014_Day_151_1981-2010

MASIE May 31 2014 – Arctic Ice Extent By Region As of Day 150

May 31 2014  MASIE Update

This is the gain/loss up to day 150. Negative = loss. Sorted with biggest loser in last 7 days at top. Northern Hemisphere is the grand total.

While melting resumed in many regions over the last one day, over the last 3 days daily melt was only -9,229 sq km per day.

The Greenland Sea continues to climb.

Region Start End Last 62 Last 28 Last 14 Last 7 Last 3 Last 1
Greenland Sea 603,416 655,024 51,609 4,140 -90 -106,985 18,233 13,181
Baffin Bay Gulf of St. Lawrence 1,688,530 1,103,619 -584,912 -245,220 -69,982 -80,040 36,442 -7,578
Barents Sea 645,917 397,108 -248,810 -267,741 -108,359 -50,858 -27,296 -23,217
Laptev Sea 897,845 818,855 -78,990 -78,990 -74,487 -25,700 -10,619 -7,430
Canadian Archipelago 853,214 810,271 -42,943 -42,943 -23,912 -15,090 -4,928 -3,406
Kara Sea 933,859 869,825 -64,034 -65,198 -44,437 -14,481 -19,292 -9,079
Chukchi Sea 966,006 903,001 -63,005 -49,419 -23,794 -11,676 -15,364 -6,480
Sea of Okhotsk 853,240 72,328 -780,912 -172,684 -34,867 -8,824 -608 1,685
Bering Sea 697,324 110,295 -587,029 -259,246 -112,201 -7,340 -4,777 -5,541
Central Arctic 3,221,921 3,241,348 19,427 -6,665 -5,400 -5,418 -2,634 -290
Hudson Bay 1,260,903 1,225,457 -35,446 -25,002 6,010 -5,232 -5,008 -6,607
Beaufort Sea 1,070,445 1,066,643 -3,802 -3,802 16,656 -495 539 -280
Baltic Sea 15,337 0 -15,337 -8,219 0 0 0 0
Yellow Sea 0 0 0 0 0 0 0 0
East Siberian Sea 1,087,137 1,034,287 -52,850 -52,850 -52,850 13,387 7,625 248
Northern Hemisphere (Total) 14,805,115 12,309,541 -2,495,574 -1,274,566 -527,729 -318,446 -27,687 -54,792
NH (Average Loss per Day)     -39,612 -45,520 -37,695 -45,492 -9,229 -54,792

MASIE Arctic Ice Extent as of 2014-150

Sea Ice Update May 30 2014

A quick update for sea ice extent for day 149 of 2014:

  • Global Sea Ice Extent is 639,000 sq km above the 1981-2010 mean.
  • Antarctic Sea Ice Extent is 1,150,000 sq km above the 1981-2010 mean.
  • Arctic Sea Ice Extent is -511,000 sq km below the 1981-2010 mean.

NOAA Data here and here here.

Graphs below. Click for bigger.


Global_Sea_Ice_Extent_Zoomed_2014_Day_149_1981-2010

Antarctic_Sea_Ice_Extent_Zoomed_2014_Day_149_1981-2010

Arctic_Sea_Ice_Extent_Zoomed_2014_Day_149_1981-2010

Sea Ice Update May 28 2014

A quick update for sea ice extent for day 147 of 2014:

  • Global Sea Ice Extent is 721,000 sq km above the 1981-2010 mean. Big drop over the last few days because Antarctica slowed down.
  • Antarctic Sea Ice Extent is 1,214,000 sq km above the 1981-2010 mean. 80th daily record for 2014.
  • Arctic Sea Ice Extent is -493,000 sq km below the 1981-2010 mean.

NOAA Data here and here here.

Graphs below. Click for bigger.


Global_Sea_Ice_Extent_Zoomed_2014_Day_147_1981-2010

Antarctic_Sea_Ice_Extent_Zoomed_2014_Day_147_1981-2010

Arctic_Sea_Ice_Extent_Zoomed_2014_Day_147_1981-2010

Sea Ice Update May 27 2014 – Global Sea 827,000 sq km Above ‘Normal’

A quick update for sea ice extent for day 146 of 2014:

  • Global Sea Ice Extent is 827,000 sq km above the 1981-2010 mean.
  • Antarctic Sea Ice Extent is 1,281,000 sq km above the 1981-2010 mean.  79th daily record for 2014.
  • Arctic Sea Ice Extent is -454,000 sq km below the 1981-2010 mean.

NOAA Data here and here here.

Graphs below. Click for bigger.

Global_Sea_Ice_Extent_Zoomed_2014_Day_146_1981-2010

Antarctic_Sea_Ice_Extent_Zoomed_2014_Day_146_1981-2010

Arctic_Sea_Ice_Extent_Zoomed_2014_Day_146_1981-2010

MASIE May 25 2014 – Arctic Ice Extent By Region As of Day 144

May 25 2014  MASIE Update

This is the gain/loss up to day 144. Negative = loss. Sorted with biggest loser in last 7 days at top. Northern Hemisphere is the grand total.

I’ve added a “NH (Average Loss per Day)” line to the bottom of the table.  The interesting figure is that even though a lot of ice melted over the last 1 day, very little melted over the last 3 days: -7,232/day

Region Start End Last 56 Last 28 Last 14 Last 7 Last 3 Last 1
Barents Sea 645,917 426,330 -219,587 -197,492 -161,324 -69,343 -5,468 -21,635
East Siberian Sea 1,087,137 1,020,900 -66,237 -66,237 -66,237 -66,237 -9,601 0
Bering Sea 697,324 116,770 -580,554 -348,719 -187,839 -50,274 4,780 -866
Laptev Sea 897,845 844,555 -53,290 -53,290 -48,104 -48,787 -8,963 0
Baffin Bay Gulf of St. Lawrence 1,688,530 1,159,590 -528,941 -348,384 -82,592 -40,205 -29,385 -24,069
Sea of Okhotsk 853,240 68,004 -785,236 -330,041 -74,417 -36,163 -13,934 -13,148
Kara Sea 933,859 877,476 -56,383 -57,547 -49,337 -35,799 -9,626 -6,829
Chukchi Sea 966,006 914,677 -51,329 -51,329 -38,707 -14,015 -2,244 0
Canadian Archipelago 853,214 823,129 -30,085 -30,085 -9,967 -10,396 1,002 -2,232
Baltic Sea 15,337 0 -15,337 -8,172 -8,065 0 0 0
Yellow Sea 0 0 0 0 0 0 0 0
Central Arctic 3,221,921 3,246,766 24,844 -1,247 -1,247 18 72 0
Beaufort Sea 1,070,445 1,069,505 -940 -940 -940 16,478 4,165 2,367
Hudson Bay 1,260,903 1,235,572 -25,331 -25,331 15,864 18,058 3,072 4,883
Greenland Sea 603,416 736,975 133,559 94,070 136,343 29,406 44,112 -25,034
Northern Hemisphere (Total) 14,805,115 12,541,745 -2,263,370 -1,425,454 -576,650 -306,971 -21,697 -86,242
NH (Average Loss per Day)     -39,708 -50,909 -41,189 -43,853 -7,232 -86,242

MASIE Arctic Ice Extent as of 2014-144

Sea Ice Update May 25 2014 – Global Sea Ice Still Skyrocketing

A quick update for sea ice extent for day 144 of 2014:

  • Global Sea Ice Extent is 984,000 sq km above the 1981-2010 mean.
  • Antarctic Sea Ice Extent is 1,416,000 sq km above the 1981-2010 mean. 77th daily record for 2014.
  • Arctic Sea Ice Extent is -433,000 sq km below the 1981-2010 mean.

NOAA Data here and here here.

Graphs below. Click for bigger.


Global_Sea_Ice_Extent_Zoomed_2014_Day_144_1981-2010 Antarctic_Sea_Ice_Extent_Zoomed_2014_Day_144_1981-2010 Arctic_Sea_Ice_Extent_Zoomed_2014_Day_144_1981-2010