MASIE May 23 2014 – Arctic Ice Extent By Region As of Day 142

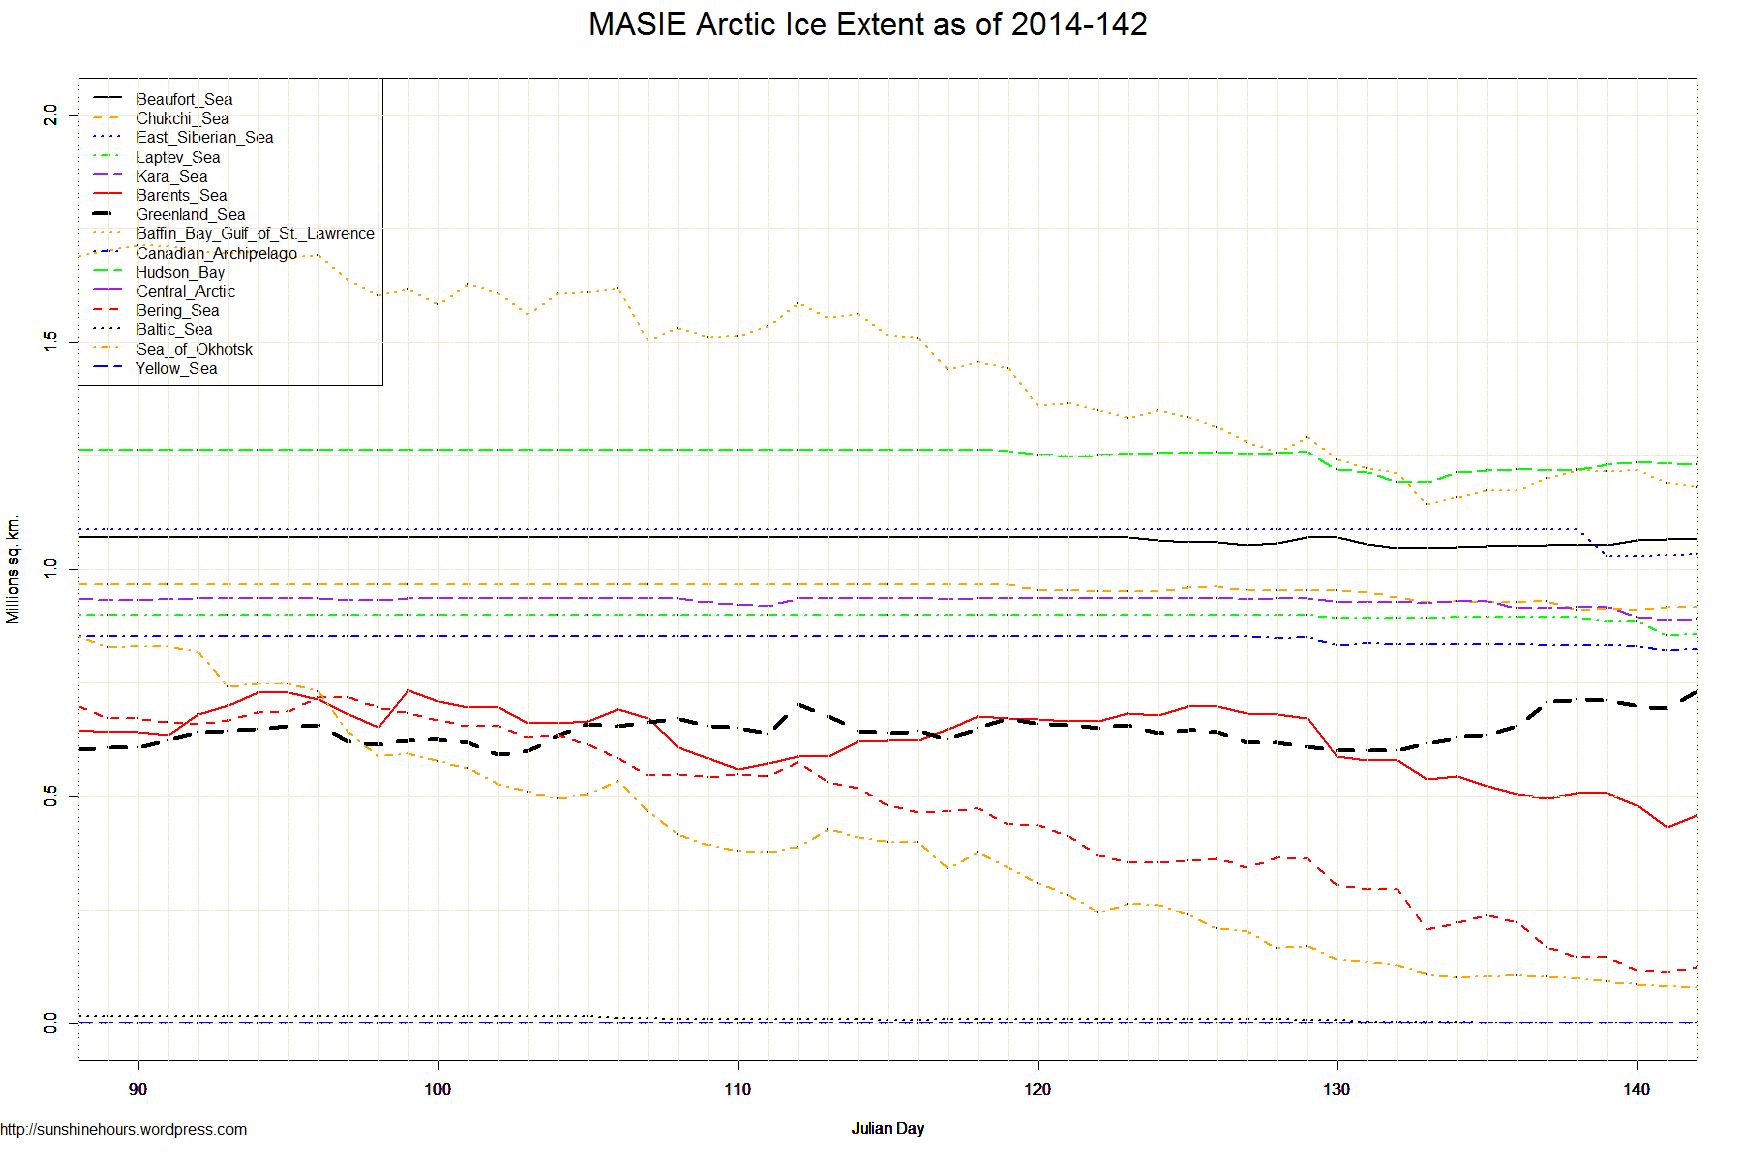
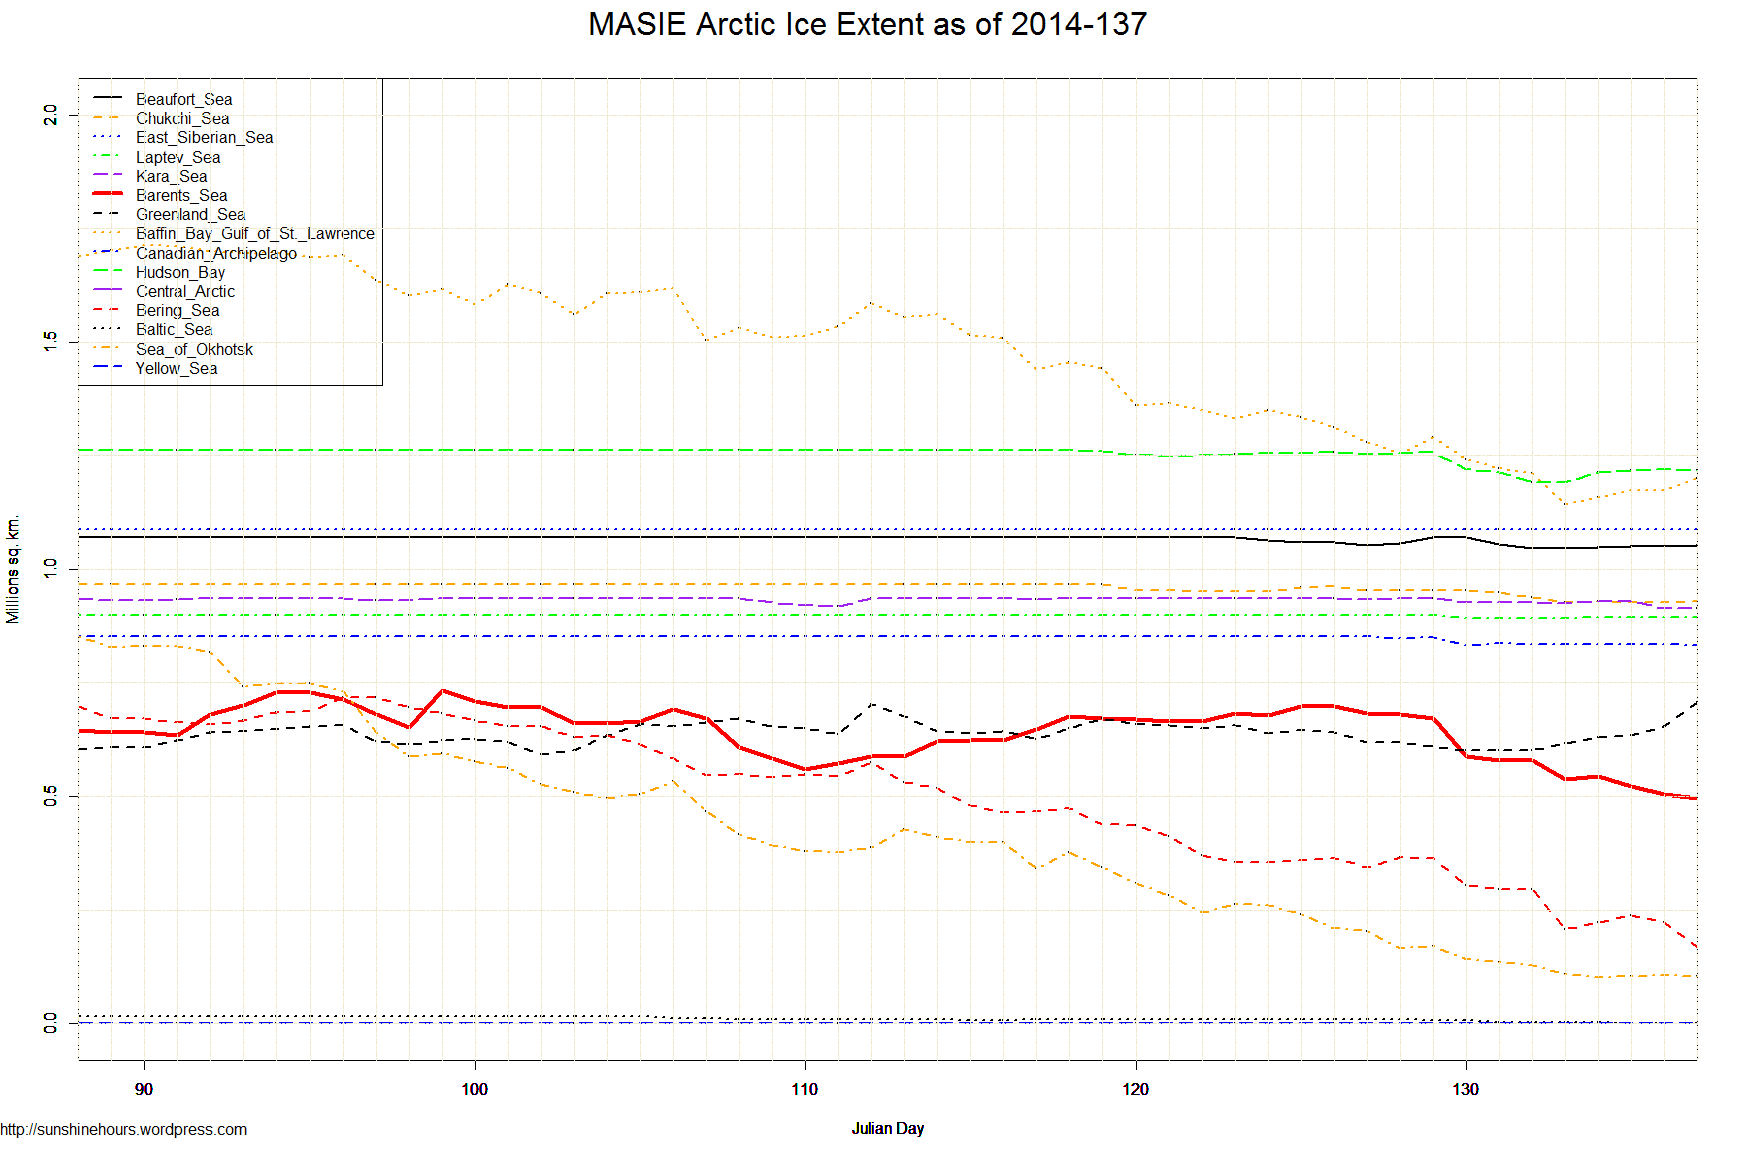
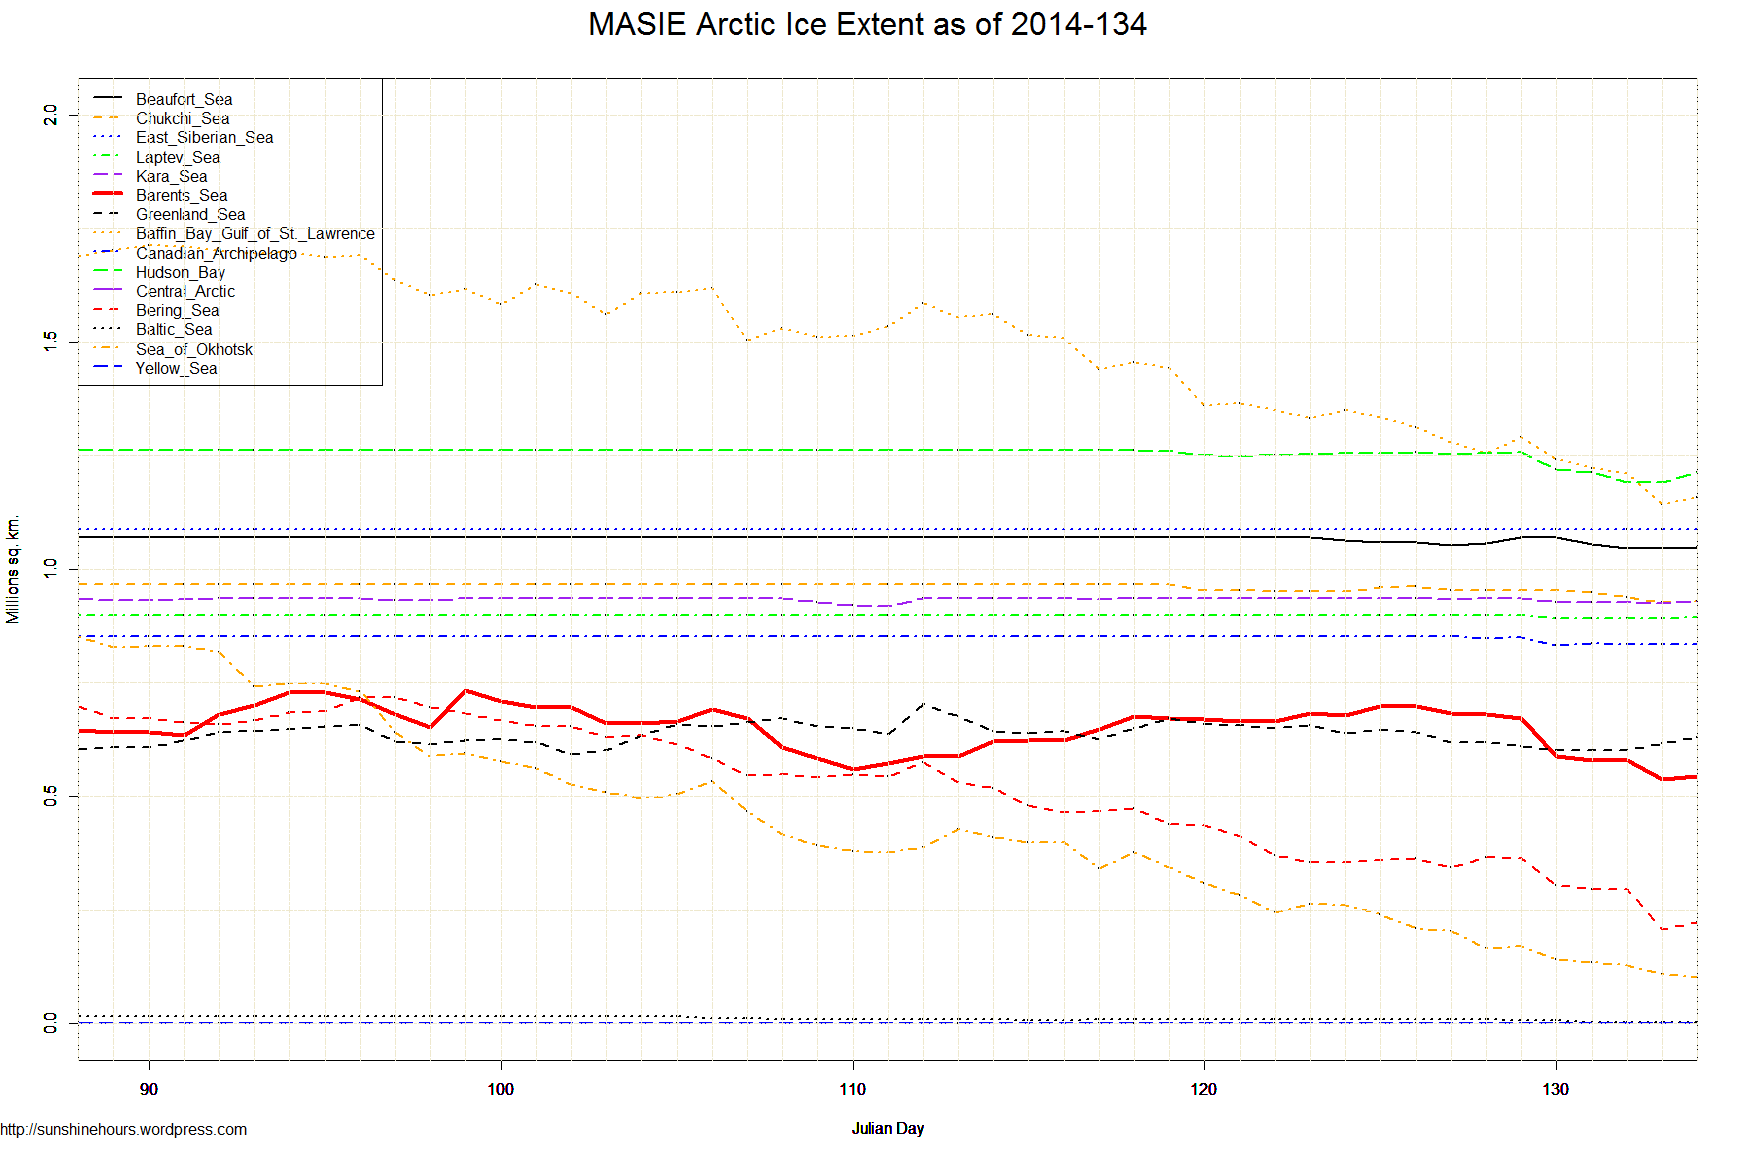
May 23 2014  MASIE Update

This is the gain/loss up to day 42. Negative = loss. Sorted with biggest loser in last 7 days at top. Northern Hemisphere is the grand total.

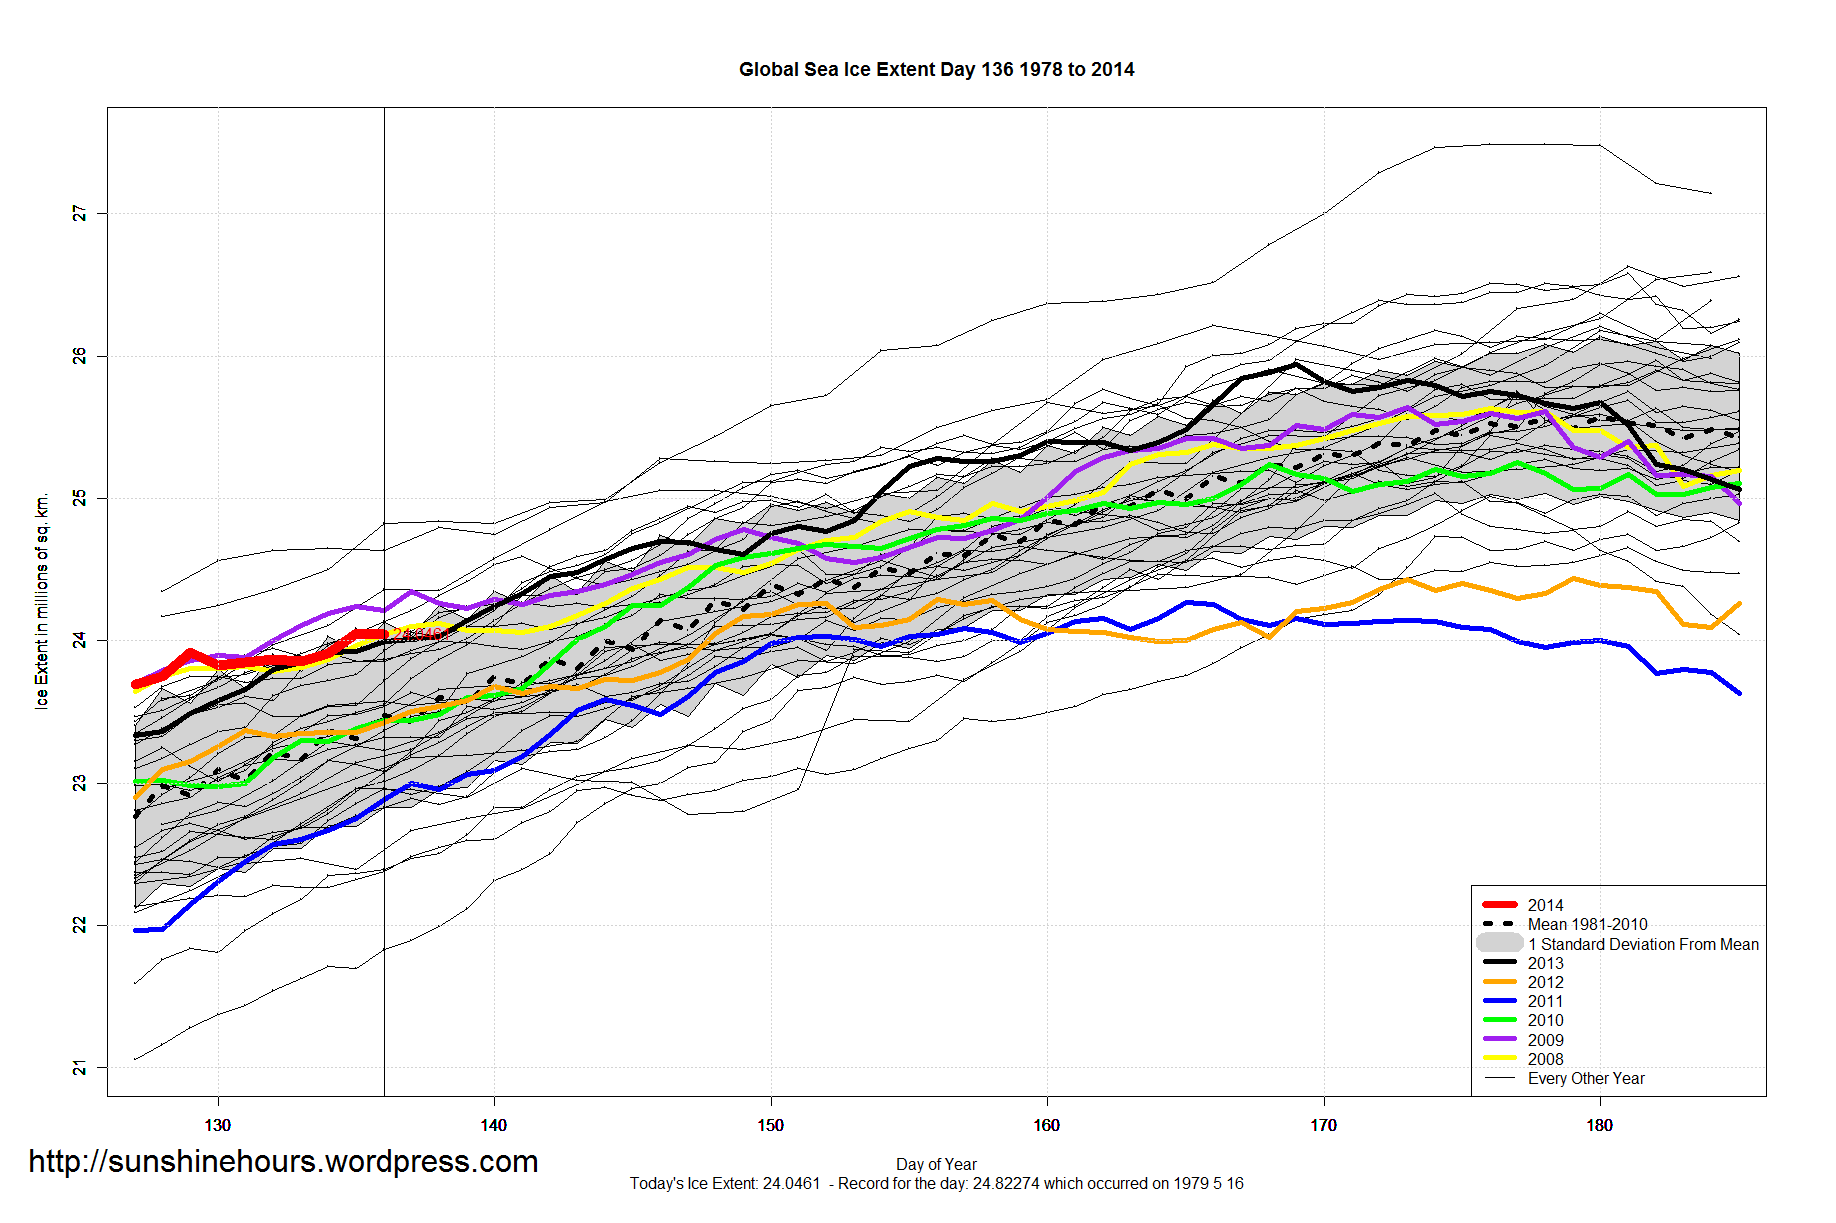
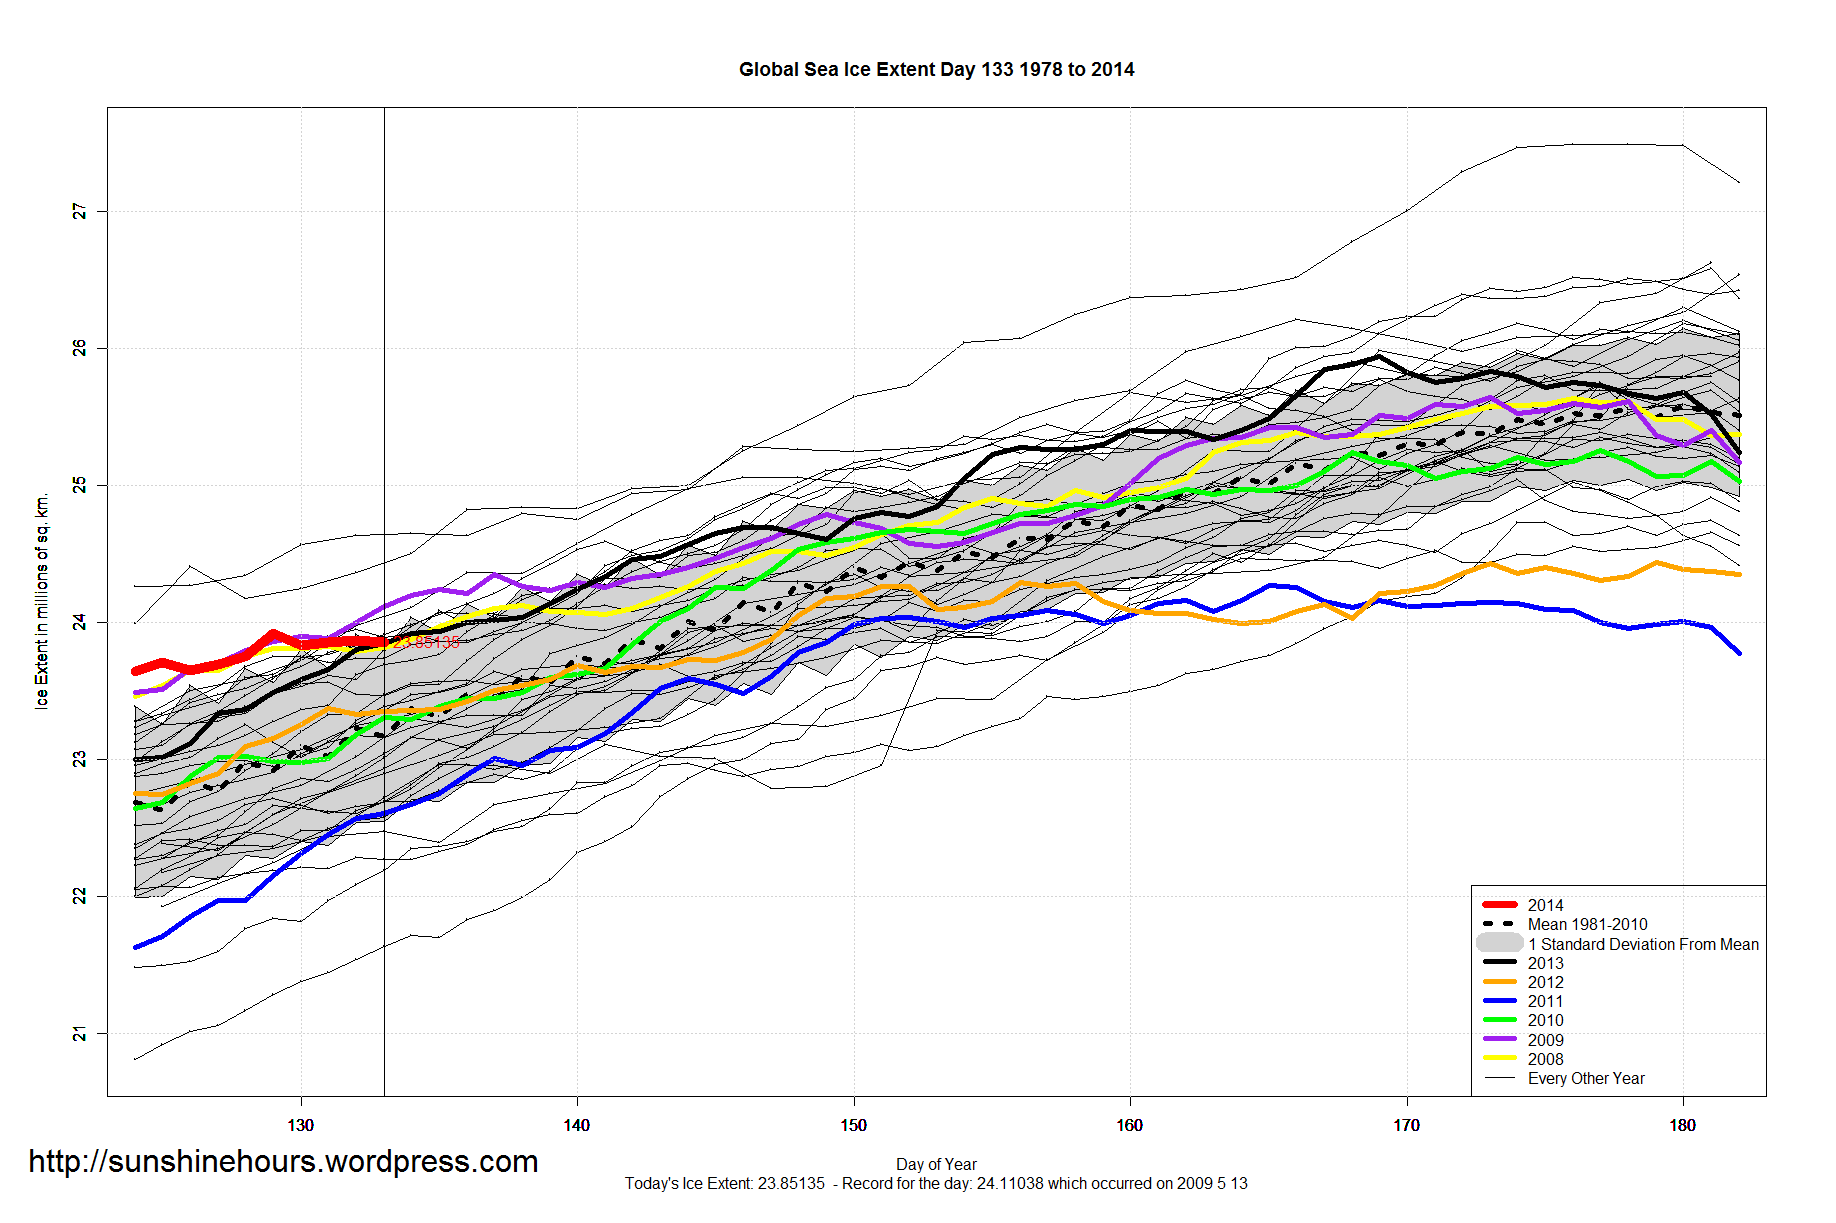
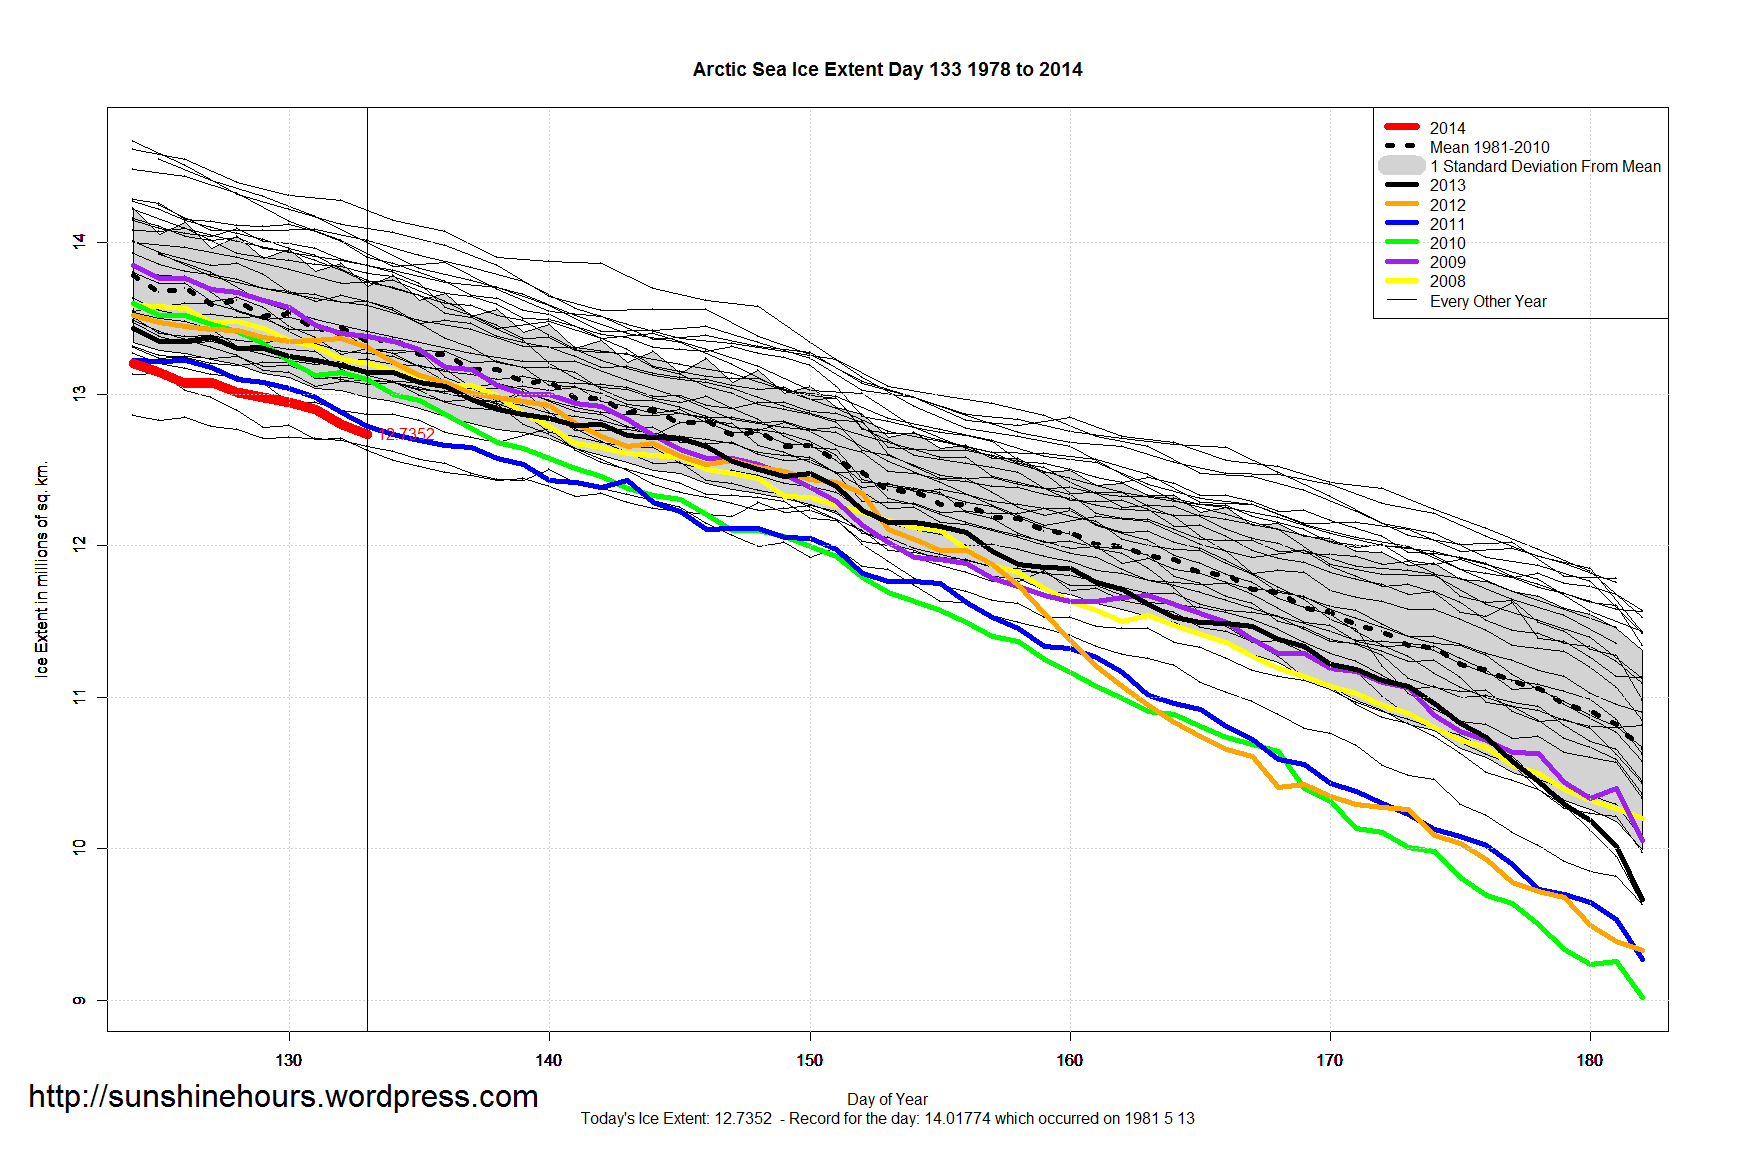
Over the last day Arctic Sea Ice actually rose  71,918 sq km.

Greenland Sea is actually 128,906  higher than it was 54 days ago. Central Arctic is a little higher than 54 days ago.

Region Start End Last 54 Last 28 Last 14 Last 7 Last 3 Last 1
Bering Sea 697,324 123,222 -574,102 -393,550 -241,699 -115,261 -22,203 11,232
Barents Sea 645,917 457,488 -188,429 -163,976 -223,226 -63,857 -48,336 25,690
East Siberian Sea 1,087,137 1,032,550 -54,587 -54,587 -54,587 -54,587 4,155 2,049
Kara Sea 933,859 888,854 -45,006 -46,170 -46,170 -39,891 -27,783 1,751
Laptev Sea 897,845 856,855 -40,990 -40,990 -40,990 -36,487 -28,395 3,337
Sea of Okhotsk 853,240 79,942 -773,298 -330,572 -86,154 -23,851 -13,813 -1,996
Canadian Archipelago 853,214 823,902 -29,312 -29,312 -24,790 -10,281 -9,624 1,774
Chukchi Sea 966,006 916,921 -49,085 -49,085 -35,691 -9,874 2,459 0
Central Arctic 3,221,921 3,246,693 24,772 -1,320 -1,320 -1,049 -126 0
Baltic Sea 15,337 0 -15,337 -8,356 -9,170 0 0 0
Yellow Sea 0 0 0 0 0 0 0 0
Baffin Bay Gulf of St. Lawrence 1,688,530 1,179,599 -508,931 -380,919 -75,117 5,981 -36,203 -9,376
Hudson Bay 1,260,903 1,230,482 -30,422 -30,422 -24,442 13,734 -825 -2,019
Beaufort Sea 1,070,445 1,065,340 -5,105 -5,105 8,745 15,352 12,764 0
Greenland Sea 603,416 732,322 128,906 88,573 113,953 97,131 19,995 39,459
Northern Hemisphere (Total) 14,805,115 12,635,360 -2,169,755 -1,446,806 -741,488 -223,244 -147,953 71,918

MASIE Arctic Ice Extent as of 2014-142

Sea Ice Update May 23 2014 – Global Sea Ice Skyrocketing

A quick update for sea ice extent for day 142 of 2014:

  • Global Sea Ice Extent is 913,000 sq km above the 1981-2010 mean and is well above the one standard deviation mark.
  • Antarctic Sea Ice Extent is 1,378,000 sq km above the 1981-2010 mean.
  • Arctic Sea Ice Extent is -465,000 sq km below the 1981-2010 mean.

NOAA Data here and here here.

Graphs below. Click for bigger.


Global_Sea_Ice_Extent_Zoomed_2014_Day_142_1981-2010 Antarctic_Sea_Ice_Extent_Zoomed_2014_Day_142_1981-2010 Arctic_Sea_Ice_Extent_Zoomed_2014_Day_142_1981-2010

Sea Ice Update May 21 2014 – Antarctic 73rd Daily Record of 2014 – Global Sea Ice 865,000 sq km Above Normal

A quick update for sea ice extent for day 140 of 2014:

  • Global Sea Ice Extent is 865,000 sq km above the 1981-2010 mean. That is ranked 4 for the day.
  • Antarctic Sea Ice Extent is 1,356,000 sq km above the 1981-2010 mean. That is ranked 1 for the day.
  • Arctic Sea Ice Extent is -492,000 sq km below the 1981-2010 mean.

NOAA Data here and here here.

Graphs below. Click for bigger.

Global_Sea_Ice_Extent_Zoomed_2014_Day_140_1981-2010 Antarctic_Sea_Ice_Extent_Zoomed_2014_Day_140_1981-2010 Arctic_Sea_Ice_Extent_Zoomed_2014_Day_140_1981-2010

MASIE May 20 2014 – Arctic Ice Extent By Region As of Day 139

May 20 2014  MASIE Update (Data here)

This is the gain/loss up to day 139. Negative = loss. Sorted with biggest loser in last 7 days at top. Northern Hemisphere is the grand total.

According to MASIE Melting over the last 3 days in the Arctic has come to a standstill except for East Siberian Sea. Hudson Bay actually rose 11,652 sq km.

Region Start End Last 51 days Last 28 Last 14 Las t7 Last 3 Last 1
Bering Sea 697,324 145,425 -551,899 -399,331 -214,044 -149,845 -77,071 -1,383
Barents Sea 645,917 505,824 -140,093 -67,499 -193,240 -72,875 358 0
East Siberian Sea 1,087,137 1,028,395 -58,742 -58,742 -58,742 -58,742 -58,742 -58,742
Sea of Okhotsk 853,240 93,755 -759,484 -282,711 -145,795 -34,575 -13,440 -6,319
Chukchi Sea 966,006 914,462 -51,544 -51,544 -46,558 -23,475 -12,332 4,563
Kara Sea 933,859 916,637 -17,222 -1,537 -18,386 -9,778 2,375 0
Laptev Sea 897,845 885,251 -12,594 -12,594 -12,594 -7,408 -8,091 -8,091
Baltic Sea 15,337 0 -15,337 -9,378 -8,402 -3,627 0 0
Canadian Archipelago 853,214 833,526 -19,689 -19,689 -19,689 -1,911 -658 0
Central Arctic 3,221,921 3,246,820 24,899 289 -1,193 -922 72 0
Yellow Sea 0 0 0 0 0 0 0 0
Baffin Bay Gulf of St. Lawrence 1,688,530 1,215,802 -472,728 -318,069 -119,373 4,557 42,202 -2,098
Beaufort Sea 1,070,445 1,052,576 -17,869 -17,869 -7,547 6,574 2,588 0
Hudson Bay 1,260,903 1,231,307 -29,596 -29,596 -23,385 40,731 11,860 11,652
Greenland Sea 603,416 712,327 108,911 75,832 66,638 111,395 57,212 -1,406
Northern Hemisphere (Total) 14,805,115 12,783,313 -2,021,801 -1,193,438 -803,296 -200,271 -53,956 -61,824

MASIE Arctic Ice Extent as of 2014-139

Sea Ice Update May 19 2014 – Antarctic 71st Daily Record of 2014 – Global Sea Ice 699,000 sq km Above Normal

A quick update for sea ice extent for day 138 of 2014:

  • Global Sea Ice Extent is 699,000 sq km above the 1981-2010 mean. That is ranked 6th for the day.
  • Antarctic Sea Ice Extent is 1,254,000 sq km above the 1981-2010 mean. That is the 71st daily record for 2014.
  • Arctic Sea Ice Extent is -555,000 sq km below the 1981-2010 mean.

NOAA Data here and here here.

Graphs below. Click for bigger.

Global_Sea_Ice_Extent_Zoomed_2014_Day_138_1981-2010 Antarctic_Sea_Ice_Extent_Zoomed_2014_Day_138_1981-2010 Arctic_Sea_Ice_Extent_Zoomed_2014_Day_138_1981-2010


MASIE May 18 2014 – Arctic Ice Extent By Region As of Day 137

May 18 2014  MASIE Update

This is the gain/loss up to day 137. Negative = loss. Sorted with biggest loser in last 7 days at top. Northern Hemisphere is the grand total.

Over the last 3 days Arctic Sea Ice actually rose a tiny amount – 5,806 sq km.

Over the last 49 days sea ice has dropped -1,956,398 sq km. But Greenland Sea and Central Arctic are actually higher than they were 49 days ago. An interesting quirk.

Region Start End Last 49 Days Last 28 Last 14 Last 7 Last 3 Last 1
Bering Sea 697,324 167,044 -530,279 -373,995 -188,021 -137,564 -56,458 -55,452
Barents Sea 645,917 495,673 -150,244 -88,856 -186,479 -91,981 -48,466 -9,793
Baffin Bay Gulf of St. Lawrence 1,688,530 1,199,795 -488,735 -310,601 -132,236 -42,387 41,792 26,195
Sea of Okhotsk 853,240 104,167 -749,072 -288,825 -158,566 -38,253 2,073 -3,028
Chukchi Sea 966,006 928,693 -37,314 -37,314 -23,728 -24,692 379 1,898
Beaufort Sea 1,070,445 1,053,027 -17,418 -17,418 -17,418 -17,418 4,479 3,040
Kara Sea 933,859 913,275 -20,584 -14,243 -21,748 -13,538 -15,302 -987
Baltic Sea 15,337 0 -15,337 -9,411 -8,219 -8,065 -2,673 0
Hudson Bay 1,260,903 1,217,514 -43,389 -43,389 -36,414 -2,194 4,037 -1,933
Central Arctic 3,221,921 3,246,747 24,826 217 -1,265 -1,265 -994 0
East Siberian Sea 1,087,137 1,087,137 0 0 0 0 0 0
Yellow Sea 0 0 0 0 0 0 0 0
Canadian Archipelago 853,214 833,526 -19,689 -19,689 -19,689 429 -658 -658
Laptev Sea 897,845 893,342 -4,503 -4,503 -4,503 683 0 0
Greenland Sea 603,416 707,569 104,153 54,117 50,743 106,937 77,888 52,454
Northern Hemisphere (Total) 14,805,115 12,848,716 -1,956,398 -1,154,910 -748,542 -269,679 5,806 11,447

MASIE Arctic Ice Extent as of 2014-137

Sea Ice Update May 17 2014 – Antarctic 69th Daily Record of 2014 – Global Sea Ice 610,000 sq km Above Normal

A quick update for sea ice extent for day 136 of 2014:

  • Global Sea Ice Extent is 610,000 sq km above the 1981-2010 mean.
  • Antarctic Sea Ice Extent is 1,202,000 sq km above the 1981-2010 mean. That is the 69th daily record of 2014.
  • Arctic Sea Ice Extent is -593,000 sq km below the 1981-2010 mean.

NOAA Data here and here here.

Graphs below. Click for bigger.

Global_Sea_Ice_Extent_Zoomed_2014_Day_136_1981-2010 Antarctic_Sea_Ice_Extent_Zoomed_2014_Day_136_1981-2010 Arctic_Sea_Ice_Extent_Zoomed_2014_Day_136_1981-2010

MASIE May 15 2014 – Arctic Ice Extent By Region As of Day 134

May 15 2014  MASIE Update

This is the gain/loss up to day 131. Negative = loss. Sorted with biggest loser in last 7 days at top. Northern Hemisphere is the grand total.

A 71,559 sq km increase from day 133 to 134. Almost all the regions had some increase or flattening except for the Sea of Okhotsk.

Region Start End Last 46 Days Last 28 Last 14 Last 7 Last 3 Last 1
Barents Sea 645,917 544,139 -101,778 -146,436 -124,548 -139,140 -34,559 6,021
Baffin Bay Gulf of St. Lawrence 1,688,530 1,158,003 -530,527 -460,820 -203,730 -122,201 -64,200 14,531
Bering Sea 697,324 223,502 -473,821 -361,304 -212,024 -120,356 -71,689 16,065
Sea of Okhotsk 853,240 102,095 -751,145 -430,119 -206,663 -100,859 -32,112 -6,286
Hudson Bay 1,260,903 1,213,477 -47,426 -47,426 -37,835 -38,325 -614 22,303
Chukchi Sea 966,006 928,313 -37,693 -37,693 -25,831 -24,215 -20,492 513
Canadian Archipelago 853,214 834,183 -19,031 -19,031 -19,031 -17,769 -1,864 -96
Kara Sea 933,859 928,578 -5,282 -6,446 -6,446 -6,255 2,163 3,886
Baltic Sea 15,337 2,673 -12,664 -8,595 -5,834 -5,729 -954 -34
Laptev Sea 897,845 893,342 -4,503 -4,503 -4,503 -4,503 683 683
Beaufort Sea 1,070,445 1,048,548 -21,897 -21,897 -21,897 -4,467 -6,795 2,164
Central Arctic 3,221,921 3,247,742 25,821 -271 -271 -271 0 0
East Siberian Sea 1,087,137 1,087,137 0 0 0 0 0 0
Yellow Sea 0 0 0 0 0 0 0 0
Greenland Sea 603,416 629,681 26,265 -23,916 -28,065 9,649 28,749 11,808
Northern Hemisphere (Total) 14,805,115 12,842,910 -1,962,204 -1,571,232 -897,388 -575,135 -201,765 71,559

MASIE Arctic Ice Extent as of 2014-134

Sea Ice Update May 14 2014 – Antarctic 66th Daily Record of 2014 – Global Sea Ice 606,000 sq km Above Normal

A quick update for sea ice extent for day 133 of 2014:

  • Global Sea Ice Extent is 606,000 sq km above the 1981-2010 mean. That is ranked 7 for the day.
  • Antarctic Sea Ice Extent is 1,301,000 sq km above the 1981-2010 mean. That is ranked 1 for the day.
  • Arctic Sea Ice Extent is -695,000 sq km below the 1981-2010 mean. That is ranked 34 for the day.

NOAA Data here and here here.

Graphs below. Click for bigger.

Global_Sea_Ice_Extent_Zoomed_2014_Day_133_1981-2010 Antarctic_Sea_Ice_Extent_Zoomed_2014_Day_133_1981-2010 Arctic_Sea_Ice_Extent_Zoomed_2014_Day_133_1981-2010

MASIE May 12 2014 – Arctic Ice Extent By Region As of Day 131

May 12 2014  MASIE Update

This is the gain/loss up to day 131. Negative = loss. Sorted with biggest loser in last 7 days at top. Northern Hemisphere is the grand total.

Lots of melting. The Barents Sea has resumed melting after taking 3 weeks off.

Region Start End Change Last 43 Days Last 28 Last 14 Last 7 Last 3 Last 1
Baffin Bay Gulf of St. Lawrence 1,688,530 1,222,204 -466,327 -338,246 -218,087 -128,417 -32,512 -19,978
Sea of Okhotsk 853,240 134,207 -719,033 -374,721 -206,766 -126,143 -31,890 -8,214
Barents Sea 645,917 578,699 -67,218 -81,356 -69,456 -100,811 -102,015 -8,955
Bering Sea 697,324 295,192 -402,132 -335,907 -172,256 -59,900 -69,729 -9,417
Hudson Bay 1,260,903 1,214,091 -46,813 -46,813 -46,813 -40,602 -40,833 -5,617
Greenland Sea 603,416 600,932 -2,483 -379 -24,029 -37,026 -17,436 300
Canadian Archipelago 853,214 836,047 -17,167 -17,167 -17,167 -17,167 -12,645 2,950
Beaufort Sea 1,070,445 1,055,344 -15,101 -15,101 -15,101 -8,797 -1,251 -15,101
Kara Sea 933,859 926,415 -7,445 -8,609 -8,106 -8,609 -8,609 -399
Laptev Sea 897,845 892,659 -5,186 -5,186 -5,186 -5,186 -5,186 0
Baltic Sea 15,337 3,627 -11,710 -12,111 -4,931 -4,592 -5,542 -4,438
Chukchi Sea 966,006 948,805 -17,201 -17,201 -17,201 -2,611 -3,807 -4,579
Central Arctic 3,221,921 3,247,742 25,821 1,339 1,121 -271 -271 -271
East Siberian Sea 1,087,137 1,087,137 0 0 0 0 0 0
Yellow Sea 0 0 0 0 0 0 0 0
Northern Hemisphere (Total) 14,805,115 13,044,675 -1,760,440 -1,254,153 -804,609 -540,762 -332,173 -73,720

MASIE Arctic Ice Extent as of 2014-131