DMI says it is getting colder in the Arctic. 15C colder. Yes, it is still higher than average. (Green is the mean)
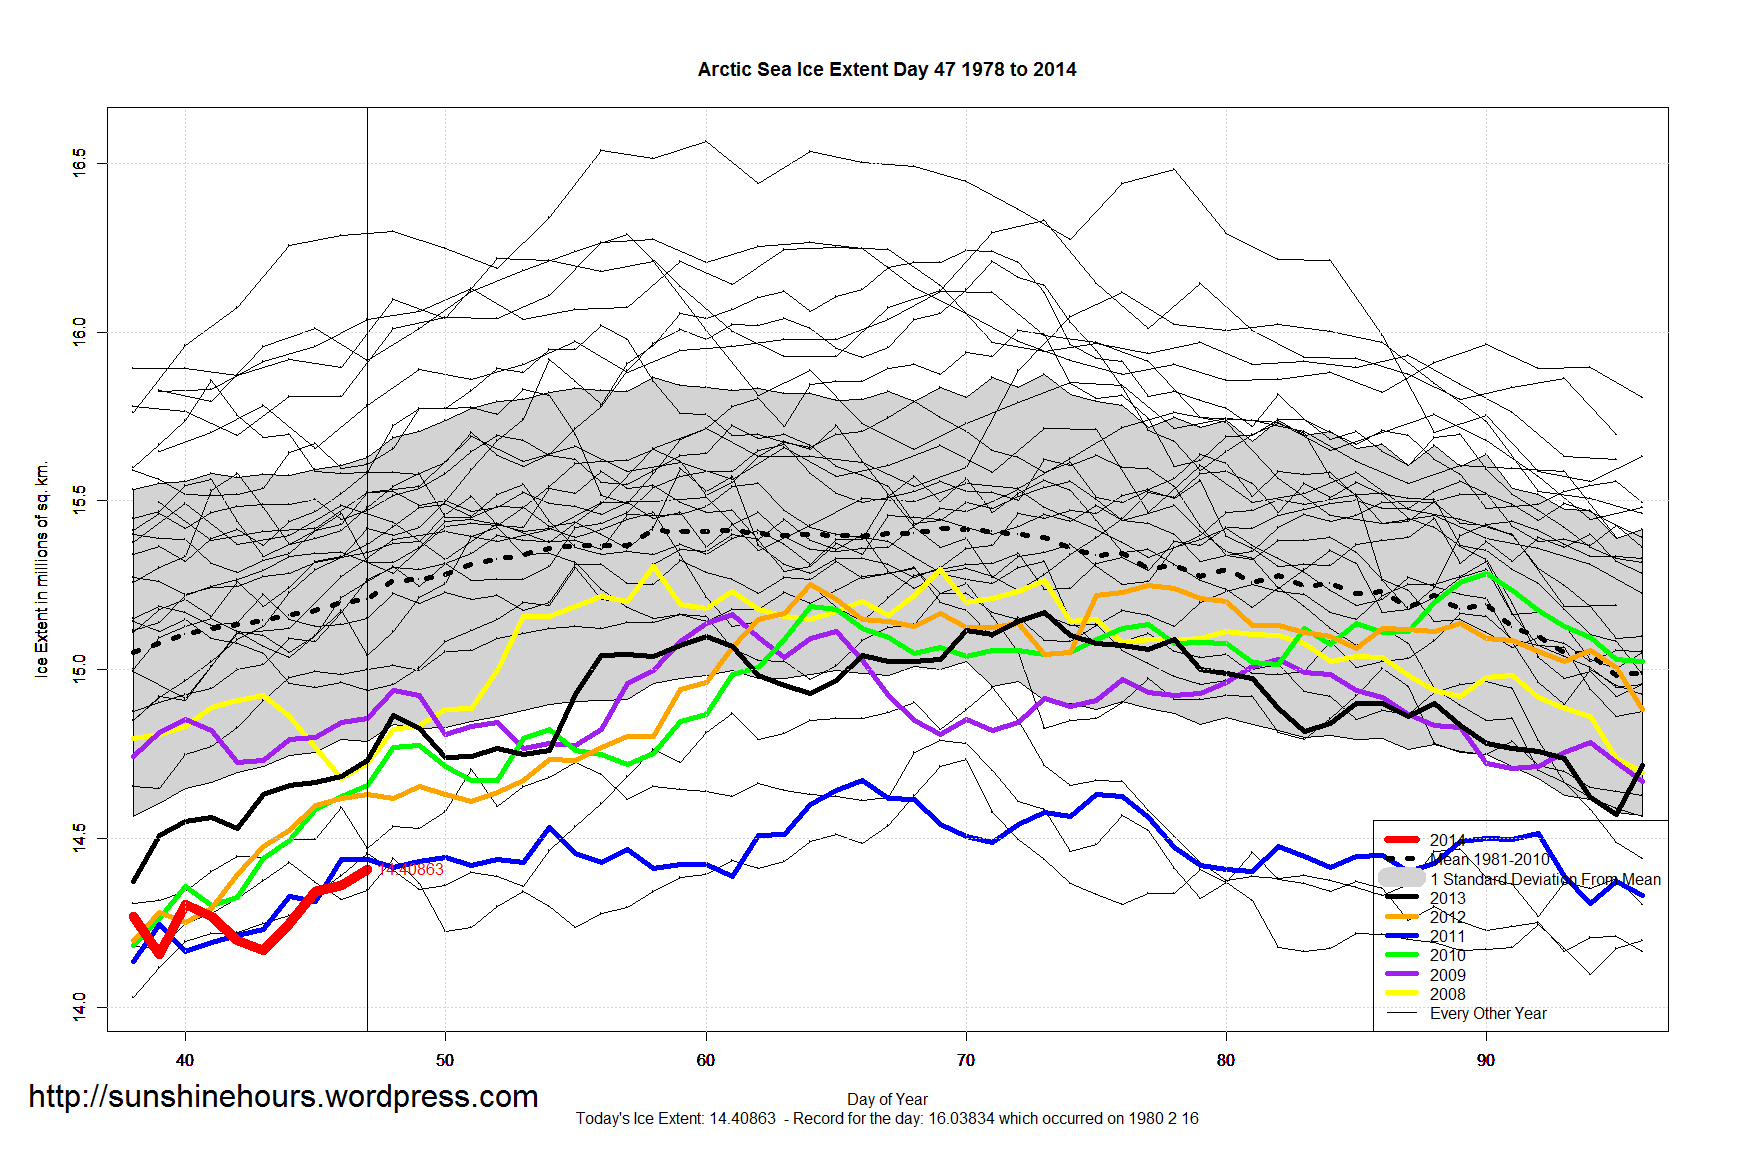
A few days ago the Arctic was lowest for the day. Now it is 4th lowest.
DMI says it is getting colder in the Arctic. 15C colder. Yes, it is still higher than average. (Green is the mean)
A few days ago the Arctic was lowest for the day. Now it is 4th lowest.
A quick update for sea ice extent:
Data here. Graphs below. Click for bigger.


A quick update for sea ice extent:
Data here. Graphs below. Click for bigger.


A quick update for sea ice extent:
Graphs below. Click for bigger.


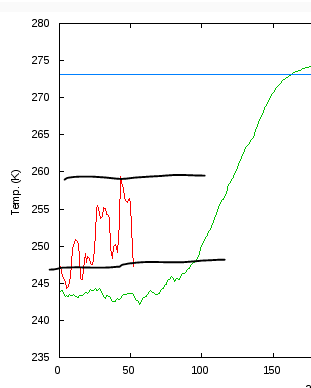
At the beginning of the year the DMI “Daily mean temperatures for the Arctic area north of the 80th northern parallel” was a few degrees C above normal.
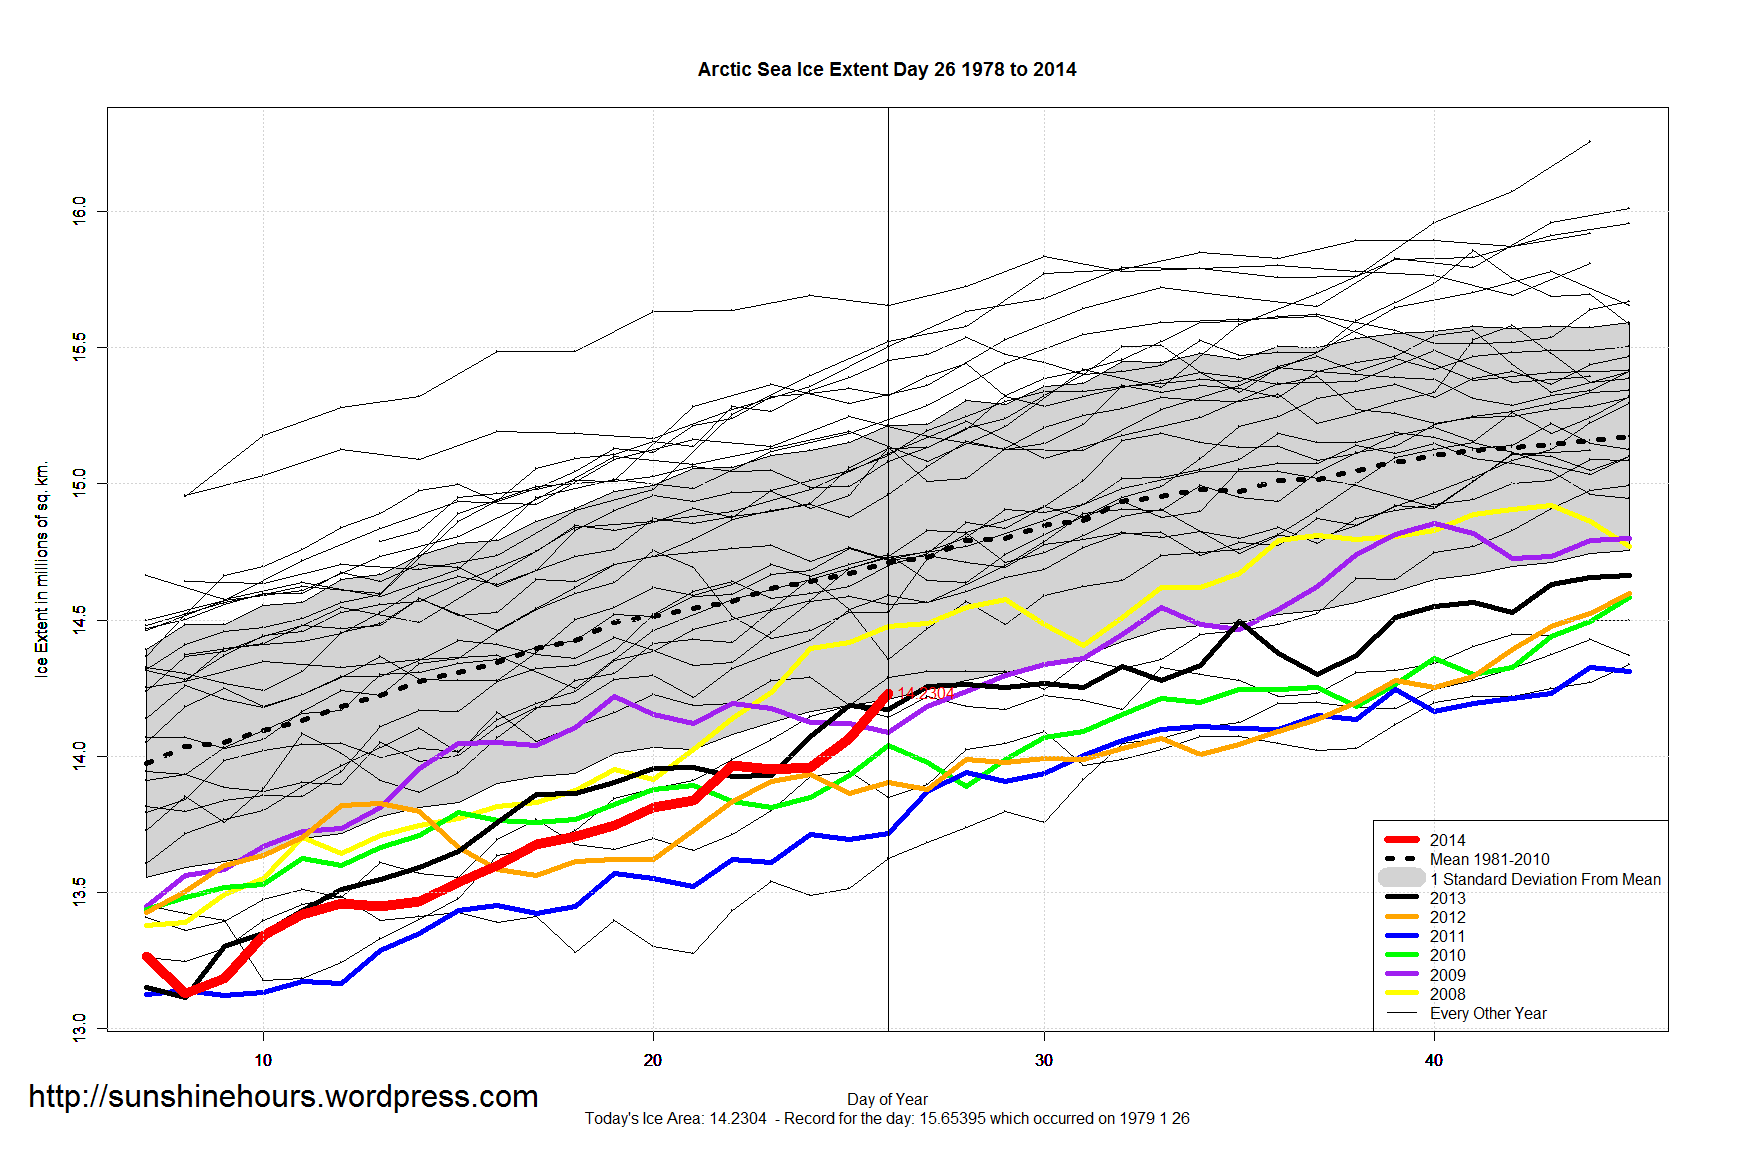
And then it went about 12C above normal. That coincides with the Arctic Sea Ice Extent falling out of the one standard deviation point it was in on day 26
In the last week or so it has plunged back down to 7C above normal, and it looks like it will continue. I wonder what will happen?

A quick update for sea ice extent:
Global Sea Ice is 192,000 sq km above normal.
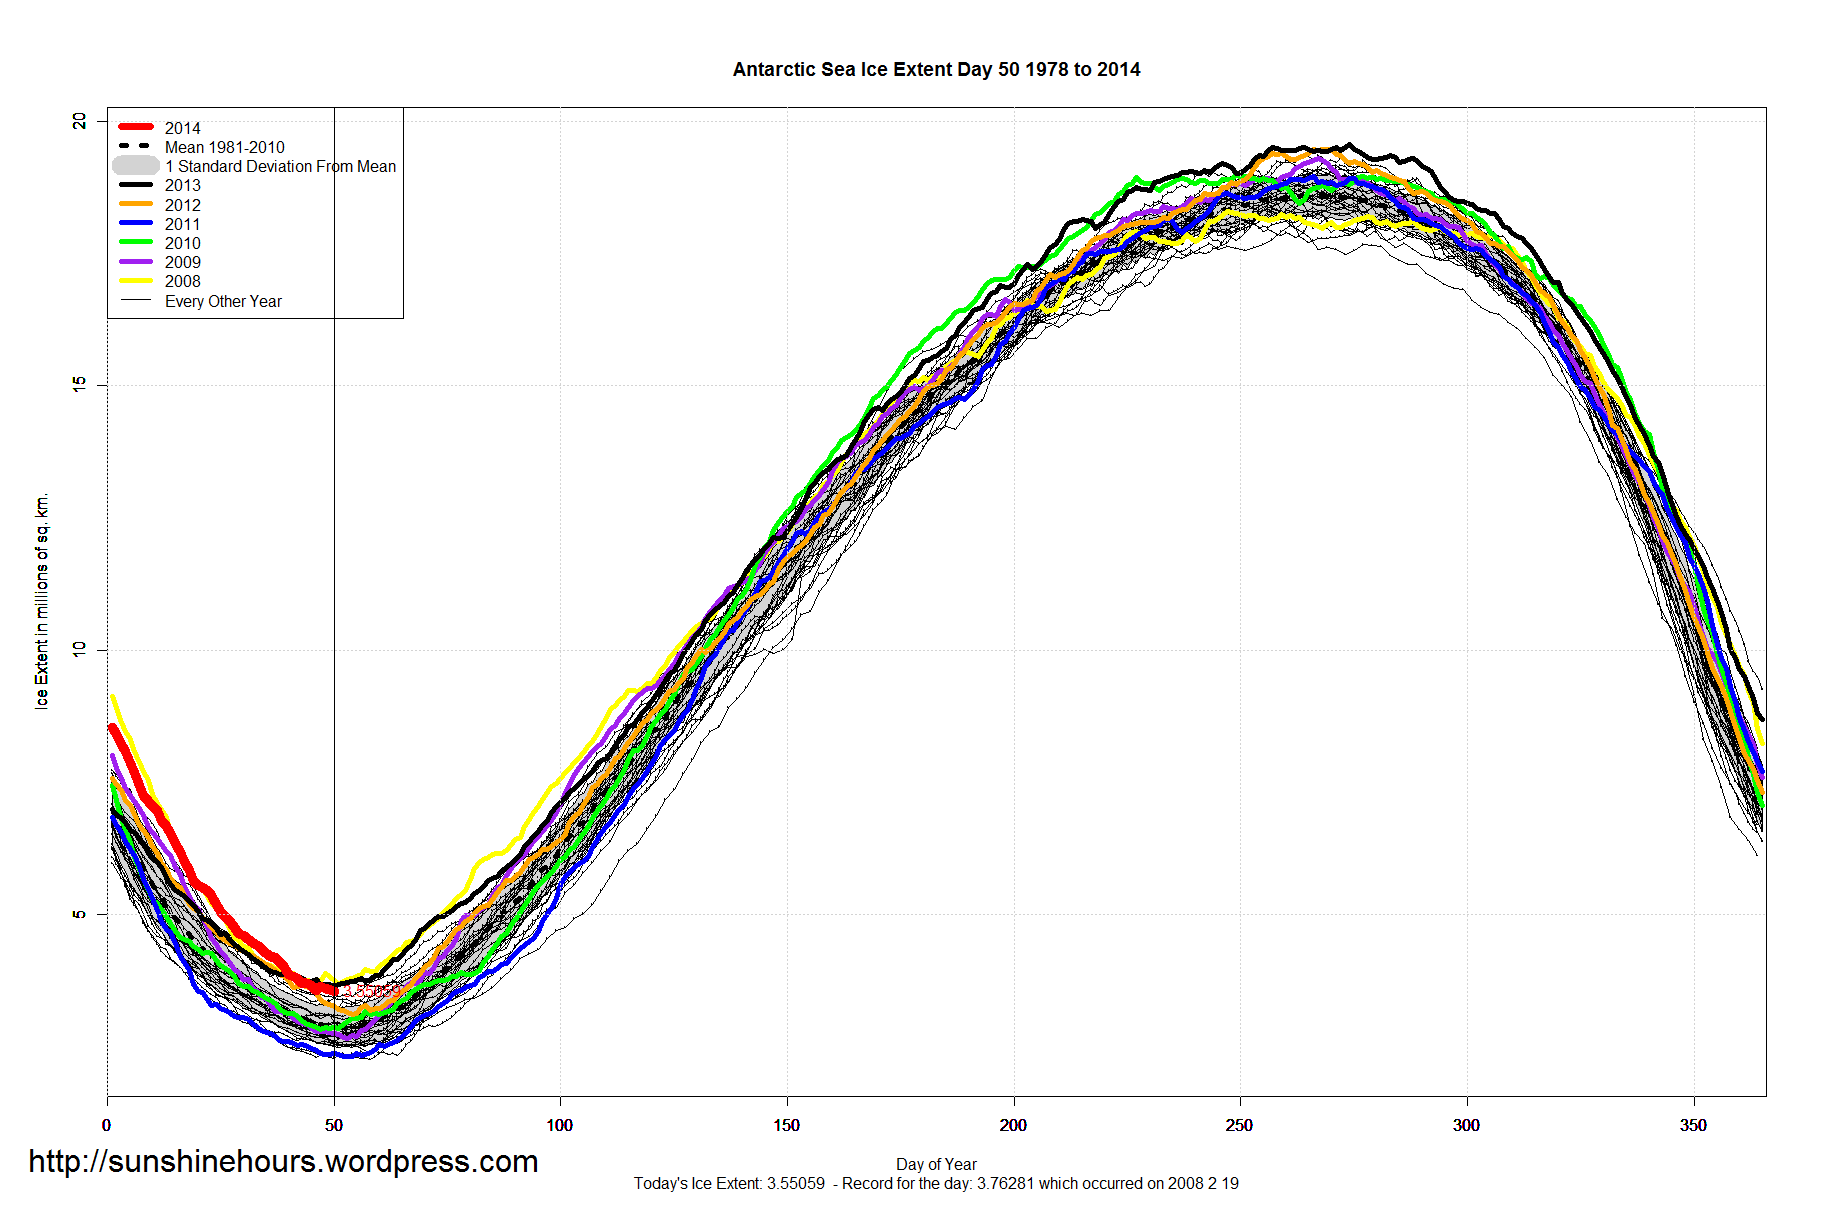
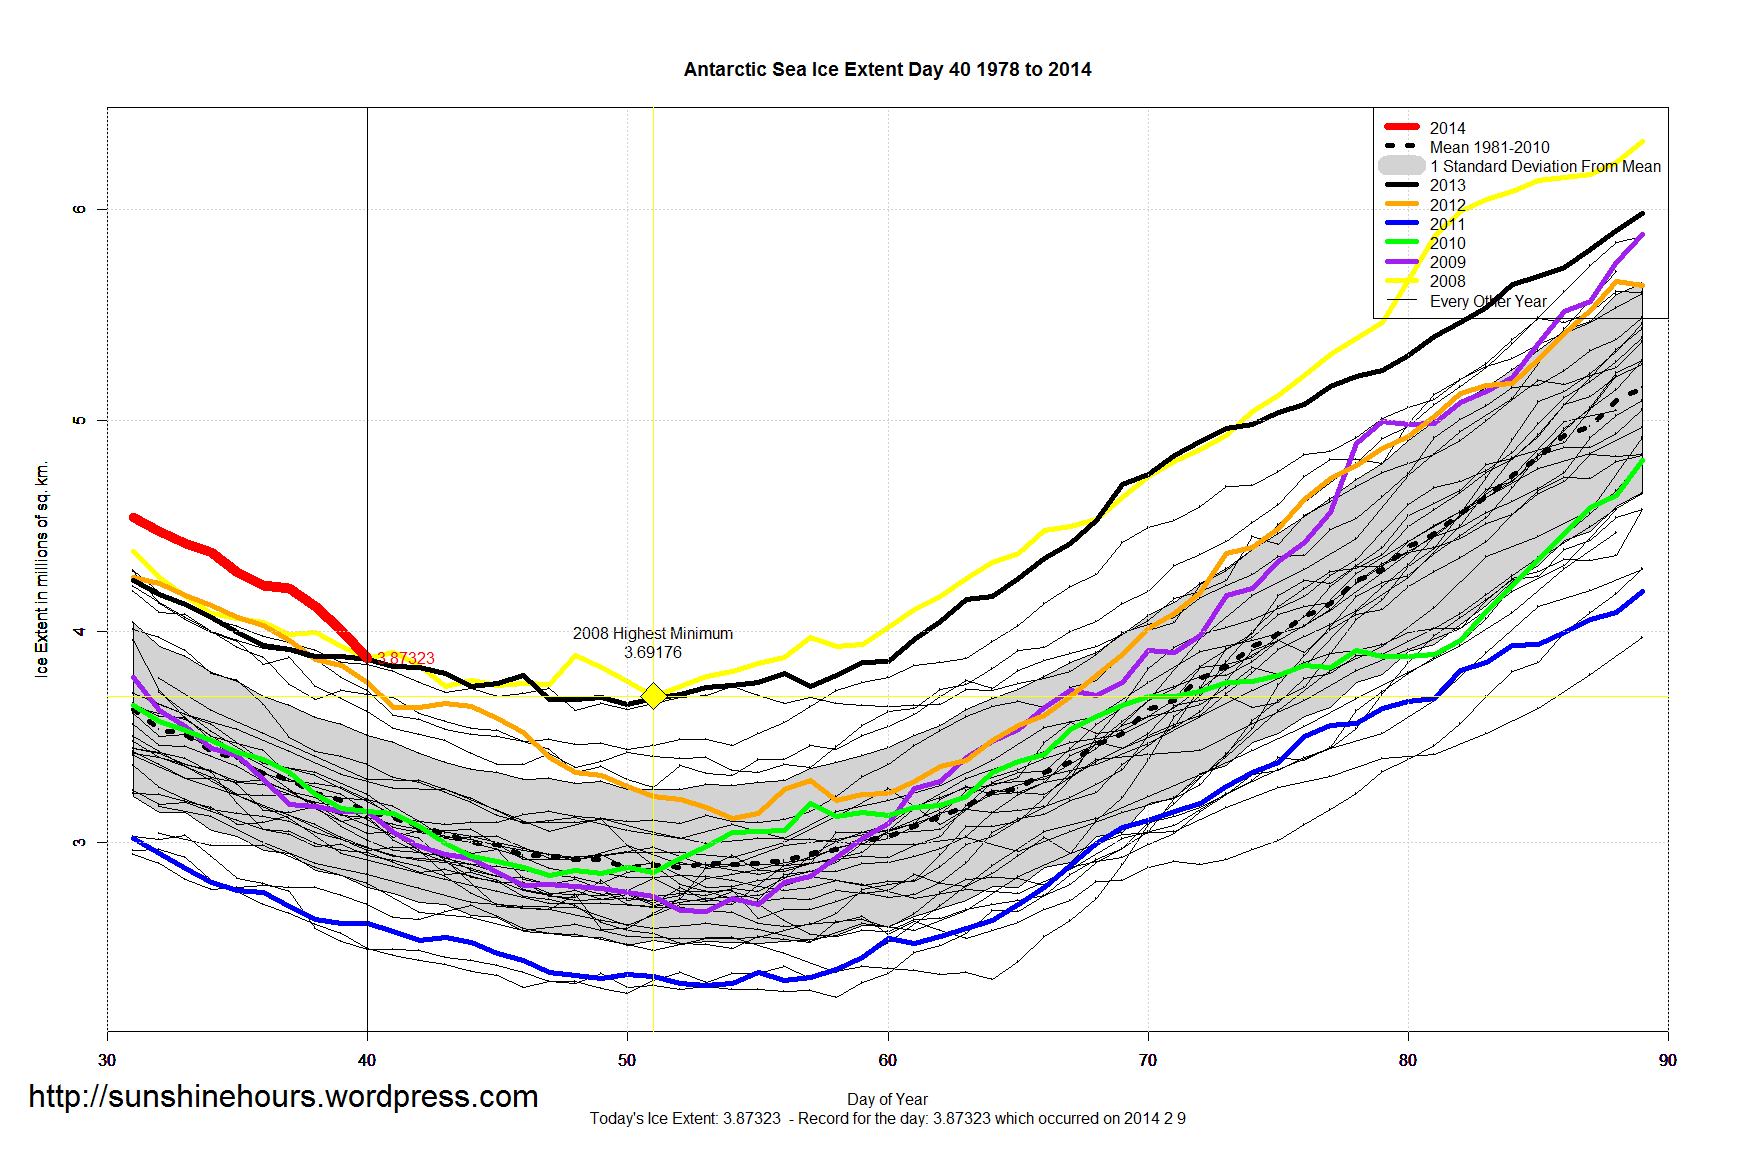
Antarctic Sea Ice is at record levels for this day and is 219,000 sq km above 2008 and 940,000 sq km above the 1981-2010 mean and on track to break the record for highest minimum.
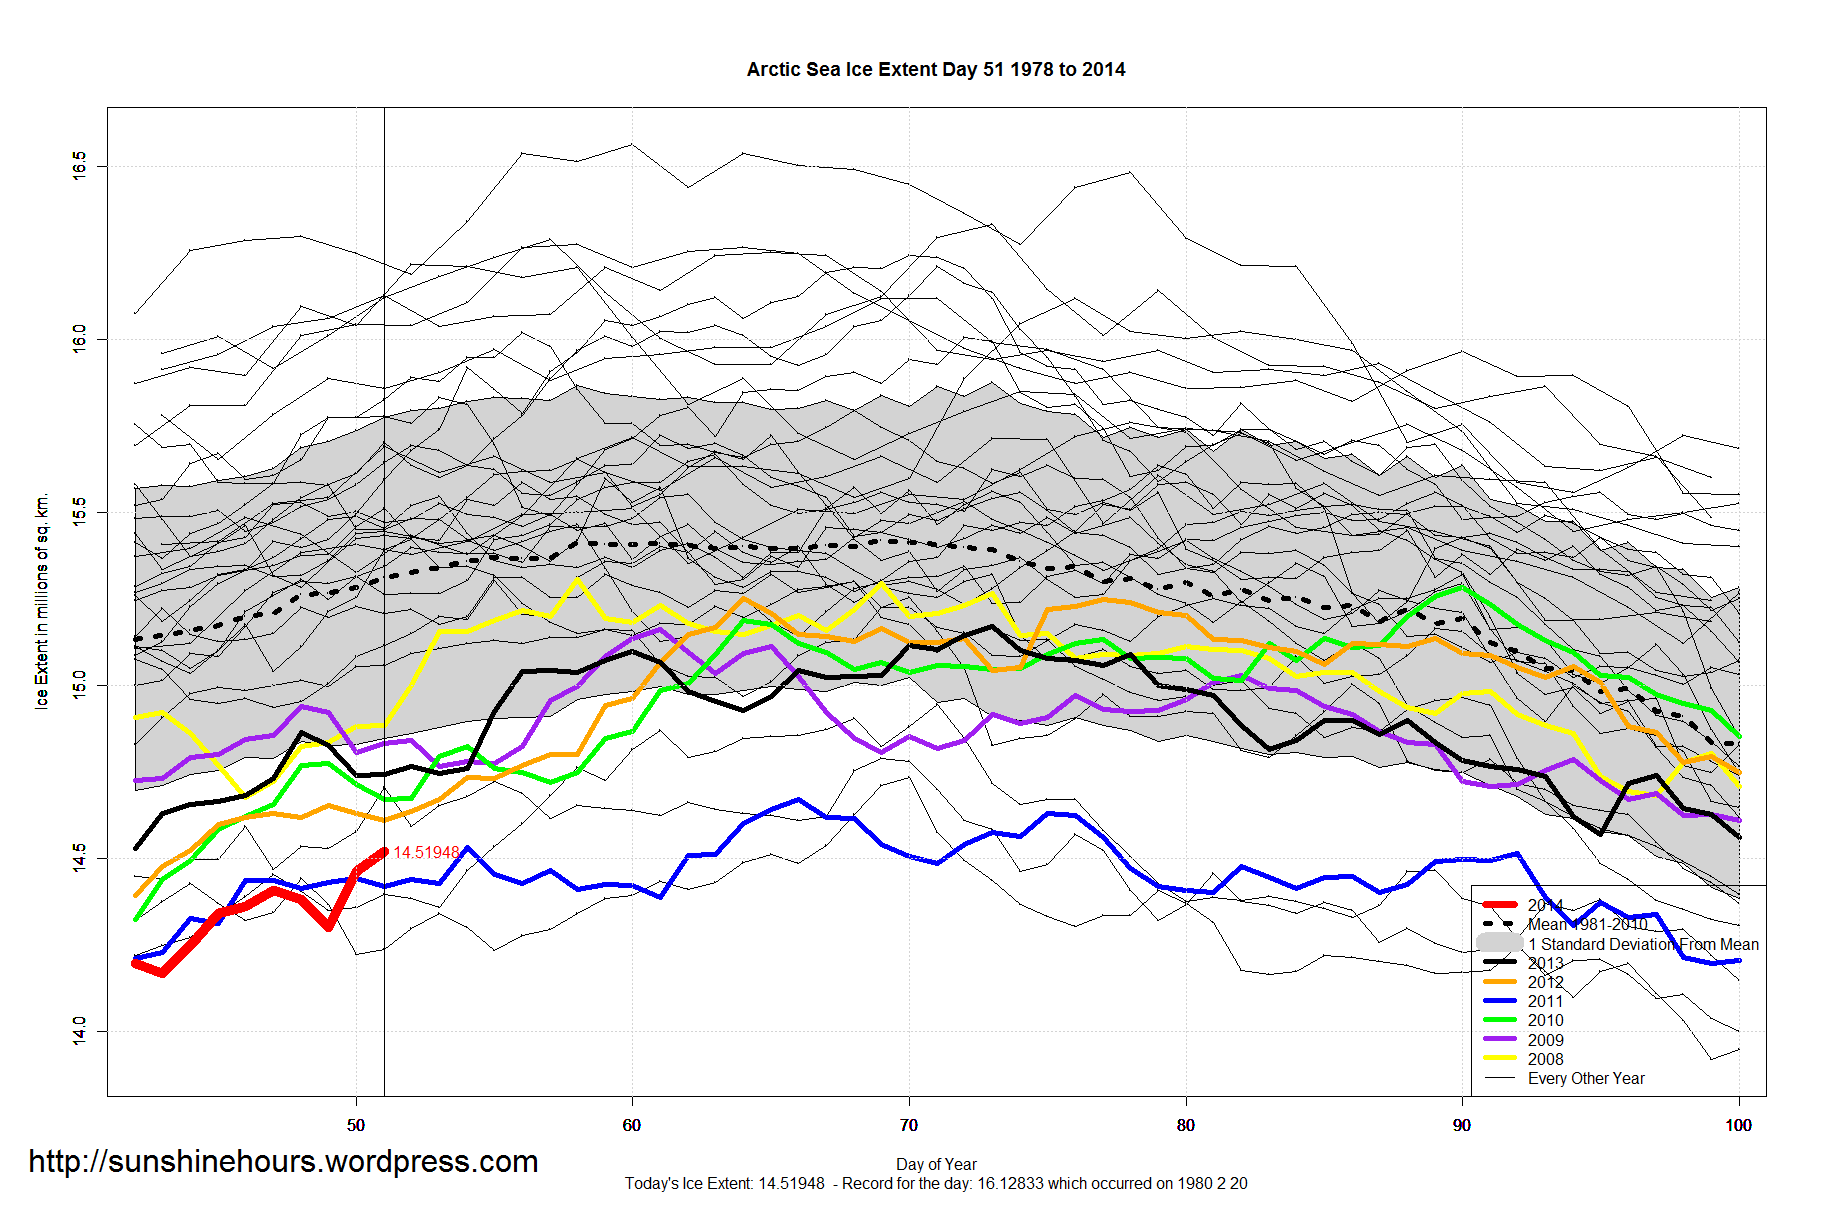
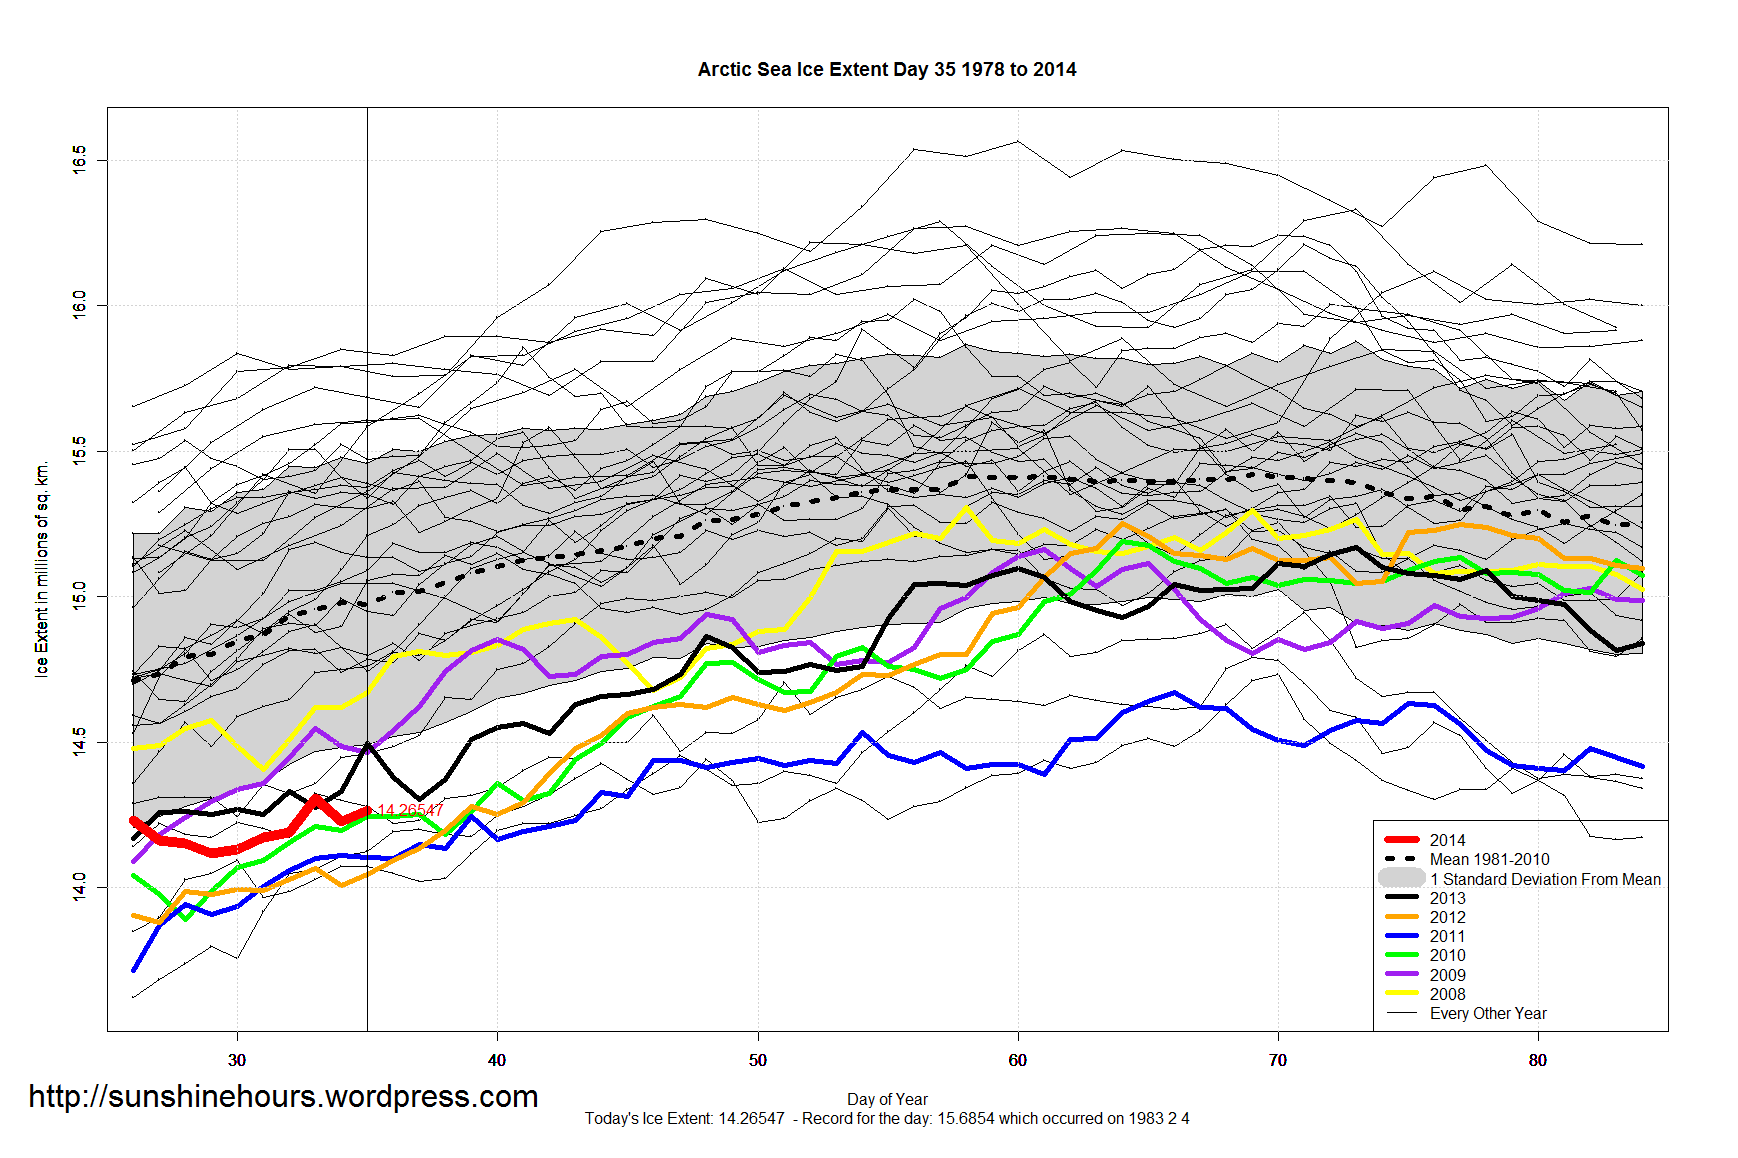
Arctic Sea Ice is 746,000 sq km below the 1981-2010 mean.
Graphs below. Click for bigger.


A quick update for sea ice extent:
Global Sea Ice is 560,000 sq km above normal.
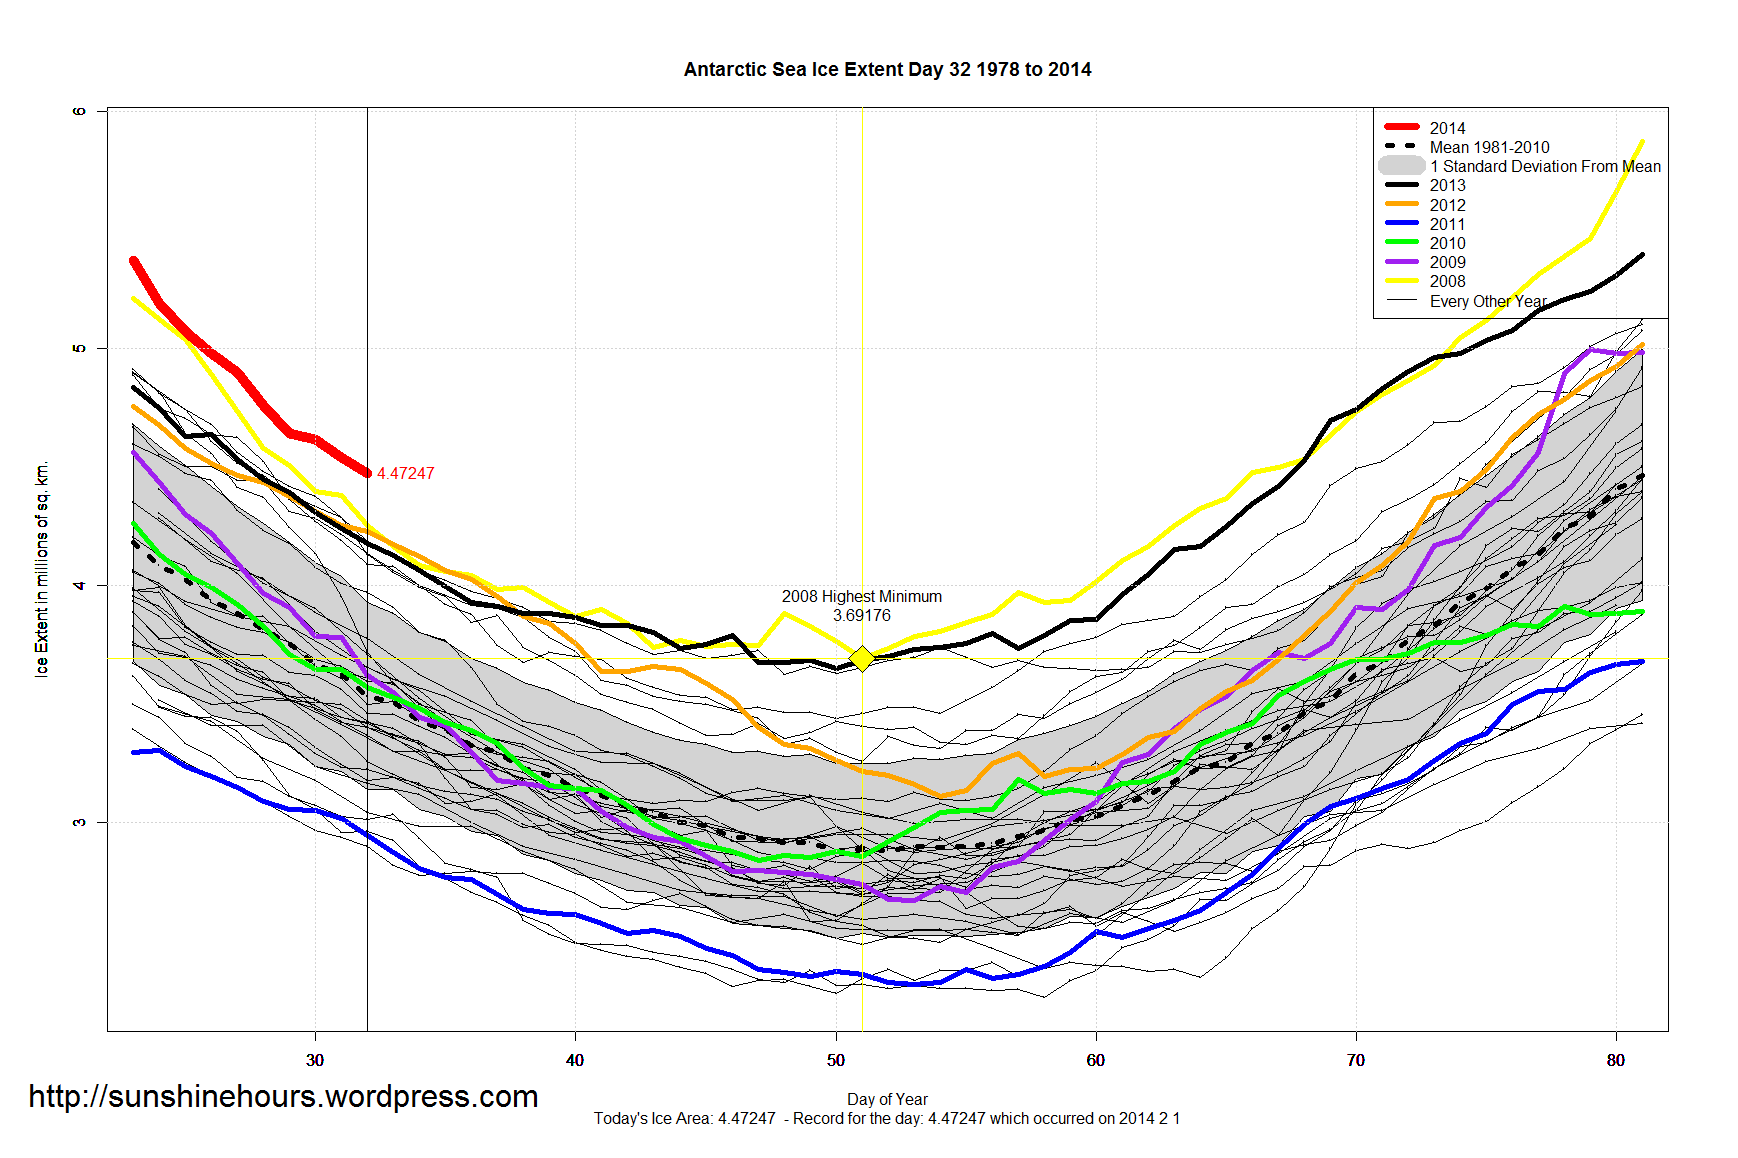
Antarctic Sea Ice is at record levels for this day and on track to possibly break the record for highest minimum.
Arctic Sea Ice has just crossed the one standard deviation line for the first time this year.
Graphs below. Click for bigger.


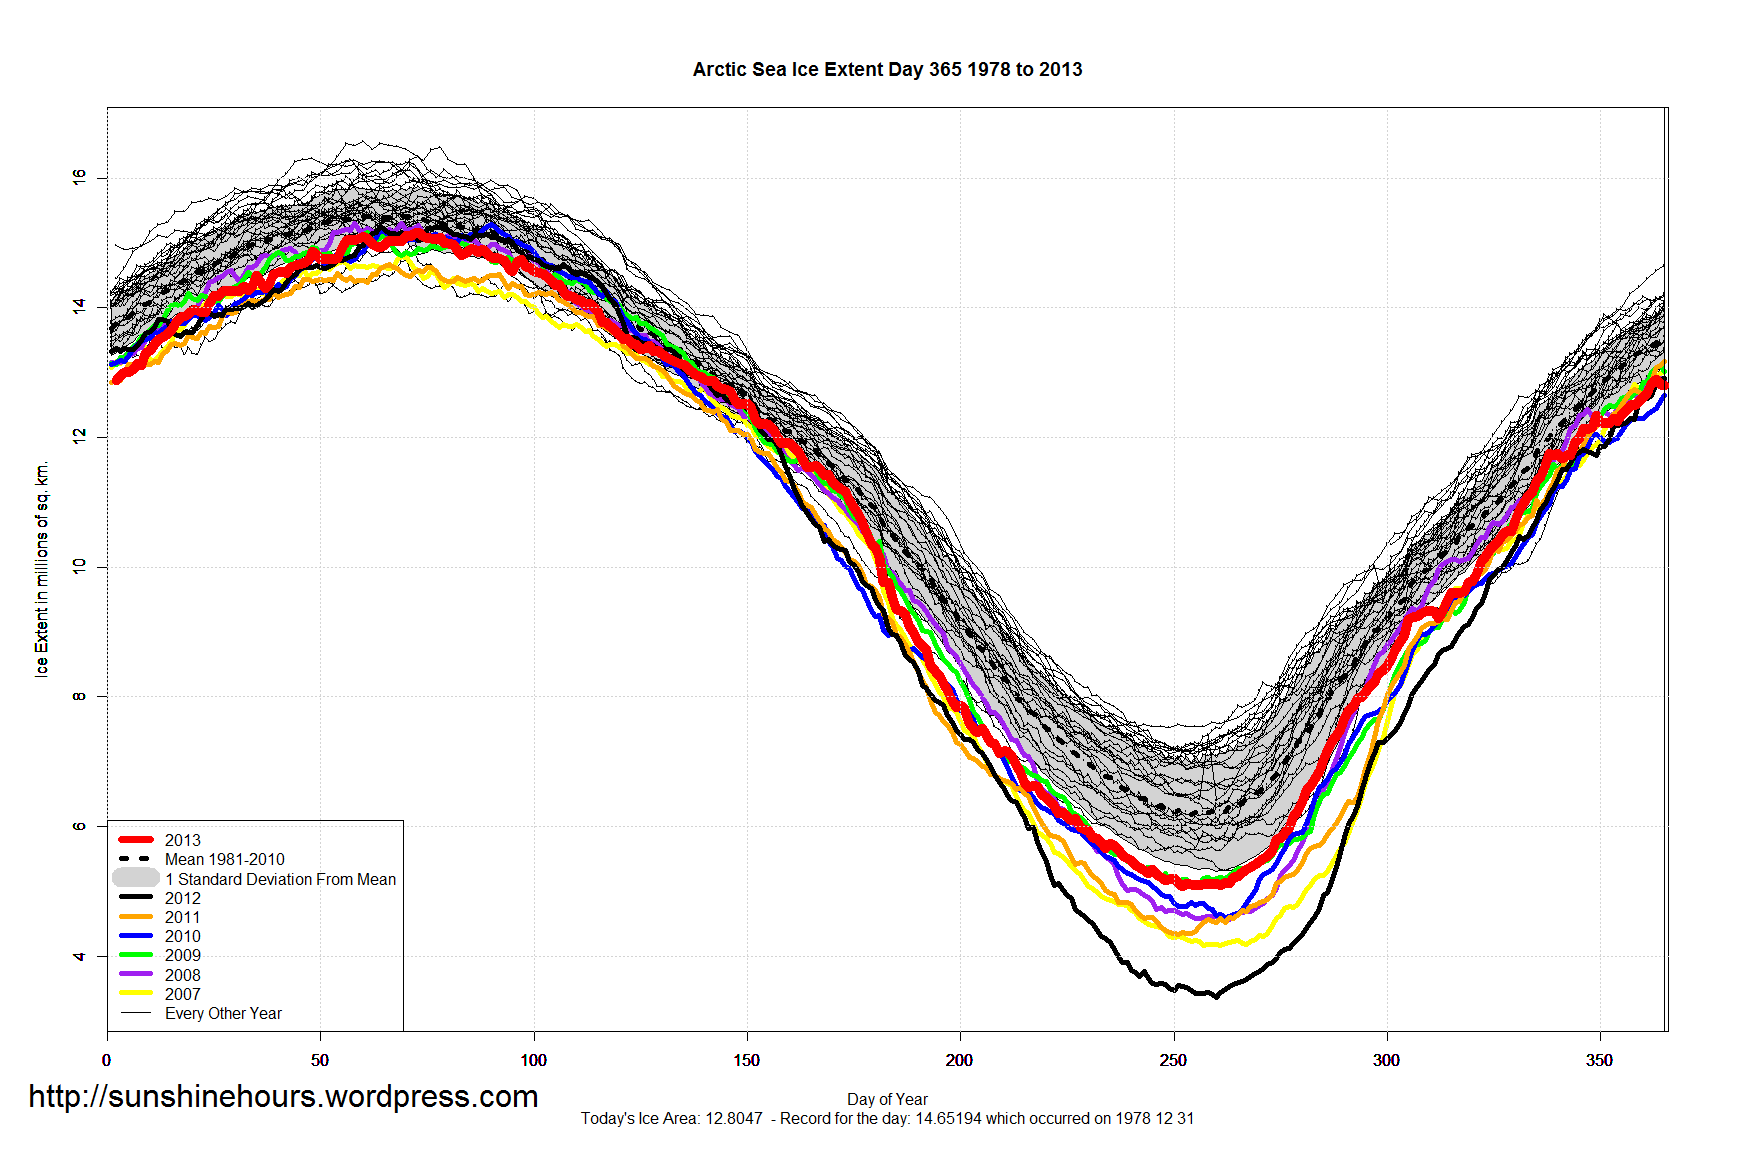
2013 was a well below average year for Arctic Sea Ice Extent .
Max Extent of 15.16969 For Whole Year Occurred On Day: 73 March 14
Max Anomaly For Whole Year Occurred On Day: 145 May 25 = -0.05969577
Max Anomaly % For Whole Year Occurred On Day: 145 May 25 = -0.4662094
Mean Anomaly For Whole Year: = -0.6446271
2013 was ranked 30th out of 36 years for average anomaly above the 1981-2010 mean – just below 2009, but 530,000 sq km above 2012.
30 2013 -0.64
31 2005 -0.66
32 2006 -0.79
33 2010 -0.86
34 2011 -1.08
35 2007 -1.09
36 2012 -1.17
There were zero daily records set and no 2nd places.
Number of daily records sorted by Top 2
| Year | First | Second | Top 2 |
| 1982 | 54 | 69 | 123 |
| 1983 | 48 | 38 | 86 |
| 1980 | 42 | 39 | 81 |
| 1979 | 59 | 19 | 78 |
| 1992 | 22 | 54 | 76 |
| 1996 | 39 | 17 | 56 |
| 1981 | 26 | 12 | 38 |
| 1988 | 6 | 29 | 35 |
| 1978 | 24 | 5 | 29 |
| 1987 | 5 | 23 | 28 |
| 1985 | 15 | 12 | 27 |
| 1986 | 15 | 9 | 24 |
| 1989 | 7 | 11 | 18 |
| 1993 | 4 | 13 | 17 |
Here are the key stats for each year. Min/Max/Anomaly in millions sq km.
| Year | Min | Max | day of Max | day of Min | Avg Anomaly |
| 1979 | 6.89236 | 16.56457 | 60 | 264 | 0.75 |
| 1980 | 7.52476 | 16.25042 | 65 | 249 | 0.76 |
| 1981 | 6.88784 | 15.71365 | 73 | 253 | 0.56 |
| 1982 | 7.15423 | 16.27475 | 58 | 256 | 0.87 |
| 1983 | 7.19145 | 16.33207 | 73 | 251 | 0.76 |
| 1984 | 6.39916 | 15.76157 | 78 | 260 | 0.34 |
| 1985 | 6.4799 | 16.11716 | 76 | 250 | 0.42 |
| 1986 | 7.12351 | 16.11934 | 69 | 249 | 0.63 |
| 1987 | 6.89159 | 16.21724 | 52 | 245 | 0.7 |
| 1988 | 7.04905 | 16.24163 | 70 | 255 | 0.6 |
| 1989 | 6.88931 | 15.72295 | 65 | 265 | 0.4 |
| 1990 | 6.0191 | 16.21077 | 71 | 264 | 0.12 |
| 1991 | 6.26027 | 15.58803 | 56 | 259 | 0.18 |
| 1992 | 7.16324 | 15.53258 | 72 | 251 | 0.53 |
| 1993 | 6.15699 | 16.00491 | 72 | 249 | 0.35 |
| 1994 | 6.92645 | 15.72226 | 61 | 248 | 0.44 |
| 1995 | 5.98945 | 15.32238 | 59 | 252 | -0.16 |
| 1996 | 7.15283 | 15.42074 | 52 | 254 | 0.26 |
| 1997 | 6.61353 | 15.63647 | 79 | 246 | 0.1 |
| 1998 | 6.29922 | 16.02091 | 56 | 260 | 0.19 |
| 1999 | 5.68009 | 15.55755 | 89 | 255 | 0.12 |
| 2000 | 5.9442 | 15.44482 | 63 | 255 | -0.07 |
| 2001 | 6.56774 | 15.66664 | 63 | 262 | 0.03 |
| 2002 | 5.62456 | 15.57345 | 68 | 256 | -0.2 |
| 2003 | 5.97198 | 15.58678 | 80 | 260 | -0.17 |
| 2004 | 5.77608 | 15.25548 | 70 | 263 | -0.33 |
| 2005 | 5.31832 | 14.94615 | 71 | 265 | -0.66 |
| 2006 | 5.74877 | 14.73298 | 70 | 257 | -0.79 |
| 2007 | 4.1607 | 14.78963 | 69 | 257 | -1.09 |
| 2008 | 4.55469 | 15.30522 | 58 | 262 | -0.59 |
| 2009 | 5.05488 | 15.16275 | 61 | 255 | -0.63 |
| 2010 | 4.59918 | 15.28449 | 90 | 262 | -0.86 |
| 2011 | 4.33028 | 14.67084 | 66 | 251 | -1.08 |
| 2012 | 3.36973 | 15.25102 | 64 | 260 | -1.17 |
| 2013 | 5.07939 | 15.16969 | 73 | 252 | -0.64 |
The Year End Graph.
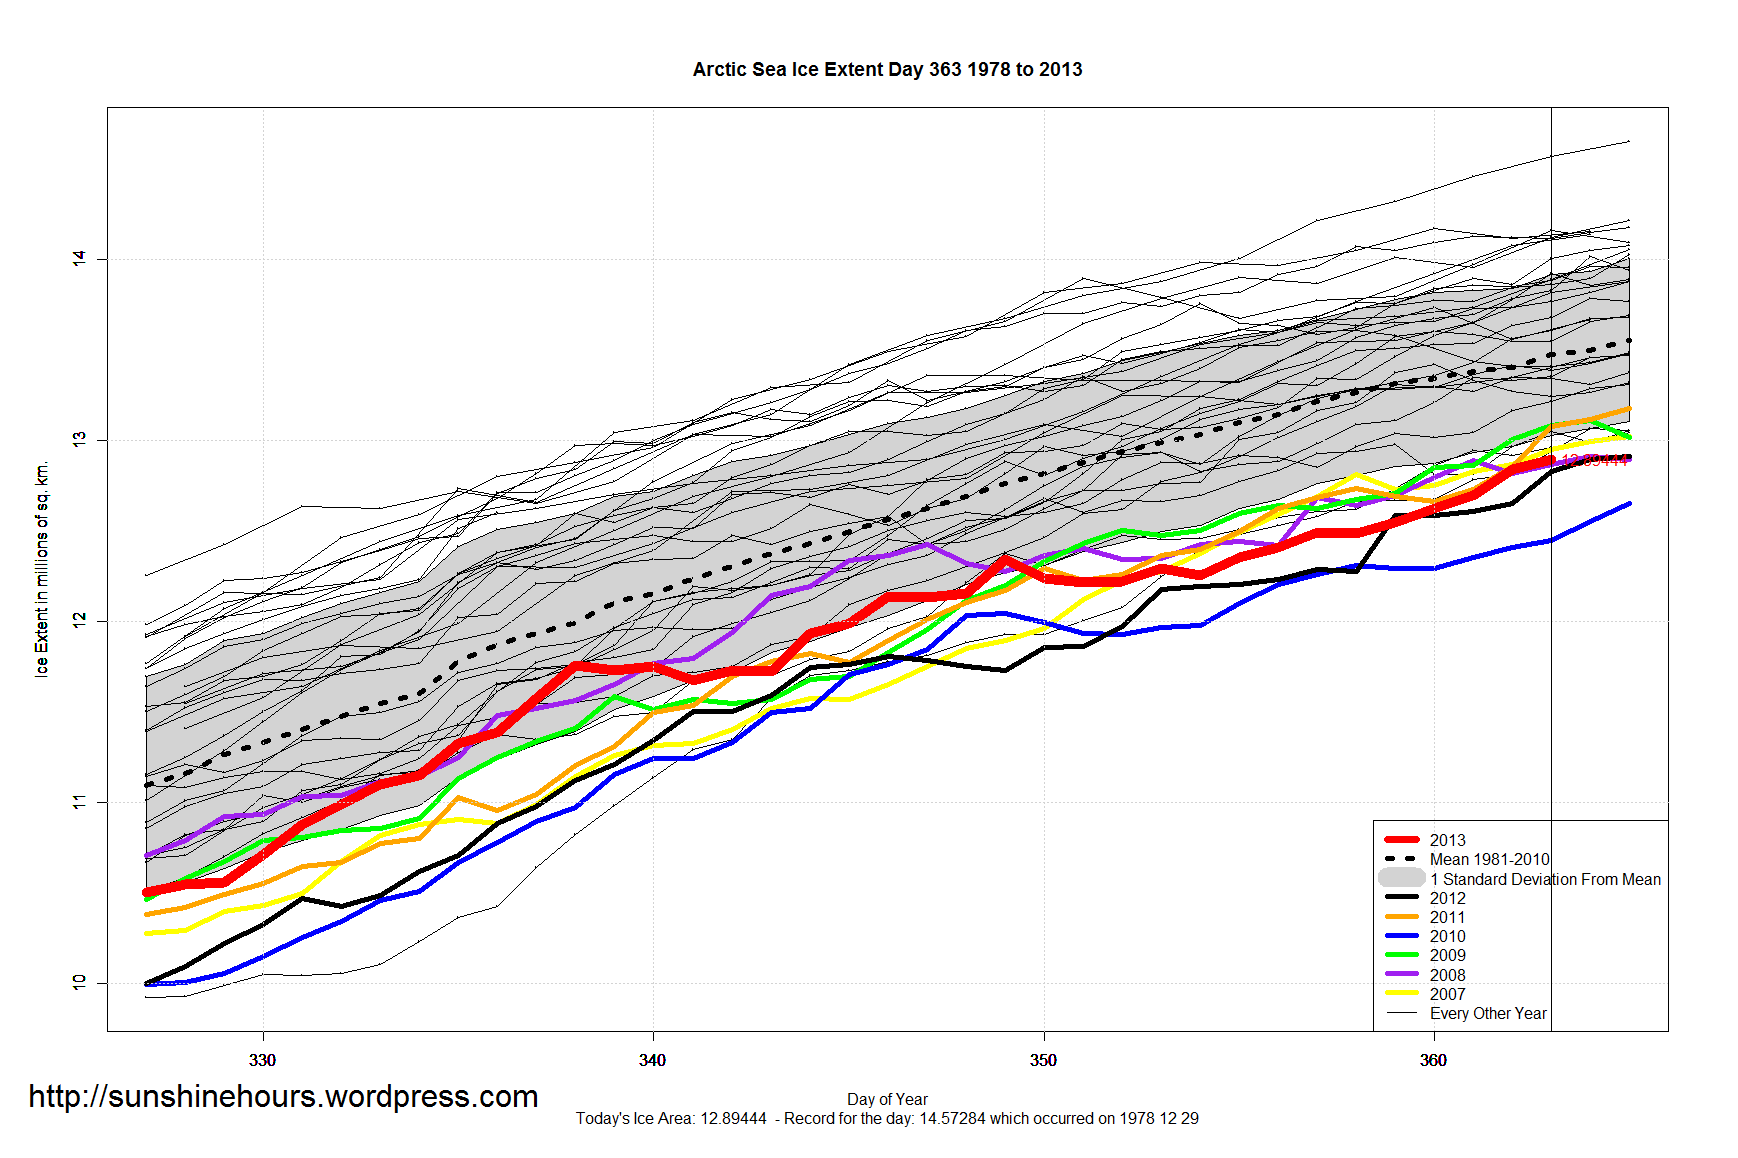
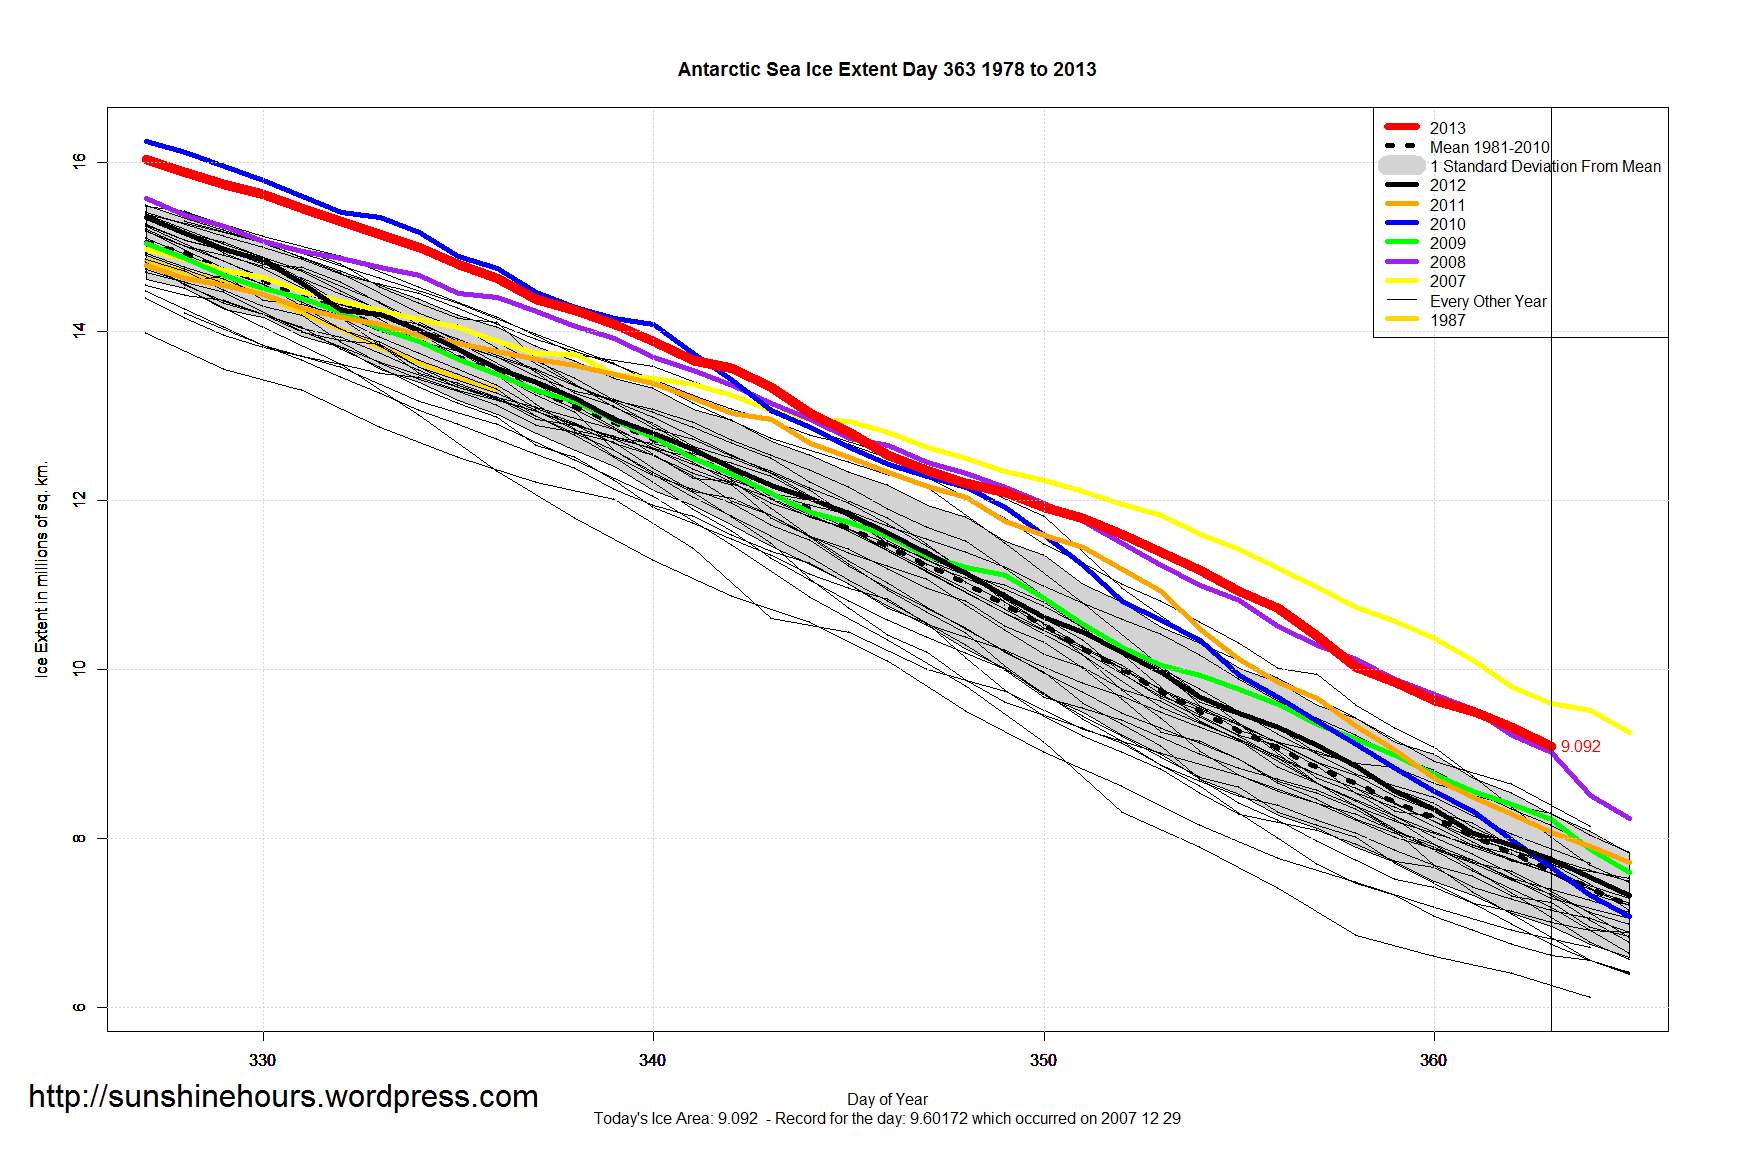
Did you know Global Sea Ice Extent is 900,000 sq km above the 1981-2010 mean?
Yes, Arctic Sea Ice Extent is 580,000 sq km below the 1981-2010 mean.
But Antarctic Sea Ice Extent is 1.47 million sq km above the 1981-2010 mean (the 2nd highest on this day ever).

Arctic Sea Ice Volume in 2013 Up 50%. (h/t NorthWest Passage 2013 blog)
“Measurements from ESA’s CryoSat satellite show that the volume of Arctic sea ice has significantly increased this autumn.
The volume of ice measured this autumn is about 50% higher compared to last year.
In October 2013, CryoSat measured about 9000 cubic km of sea ice – a notable increase compared to 6000 cubic km in October 2012.”
“90% of the increase is due to growth of multiyear ice”
“This year’s multiyear ice is now on average about 20%, or around 30 cm, thicker than last year.”
“the volume of ice year-to-year was not varying anything like as much as the ice extent”
