This dataset only has 30 days of data. I leave out the NH total otherwise the all of the other lines would look kind of flat.

This dataset only has 30 days of data. I leave out the NH total otherwise the all of the other lines would look kind of flat.
Apologies. Global Sea Ice is actually 5th highest. Not 3rd as I wrote. Back from a trip. Brain rusty.I misread. Antarctic Sea Ice Extent is 3rd. Global is not 3rd. It is 5th.
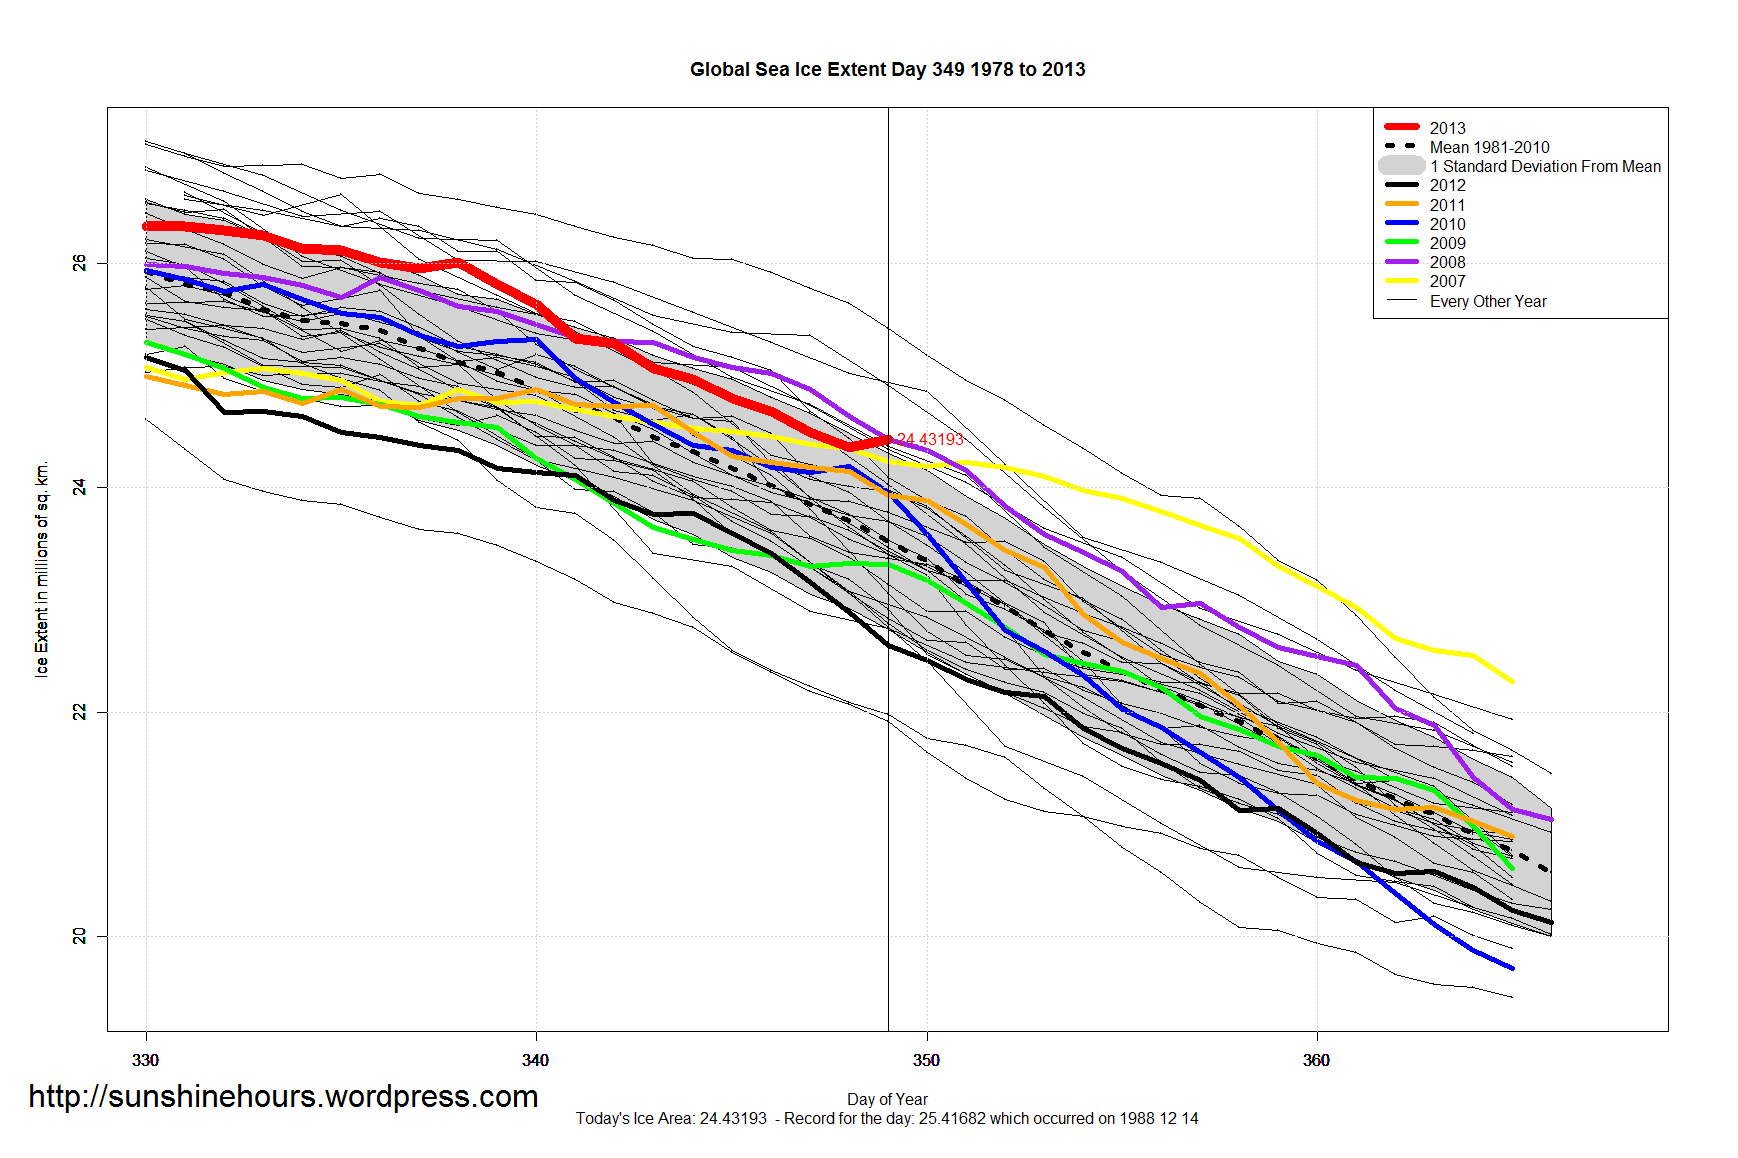
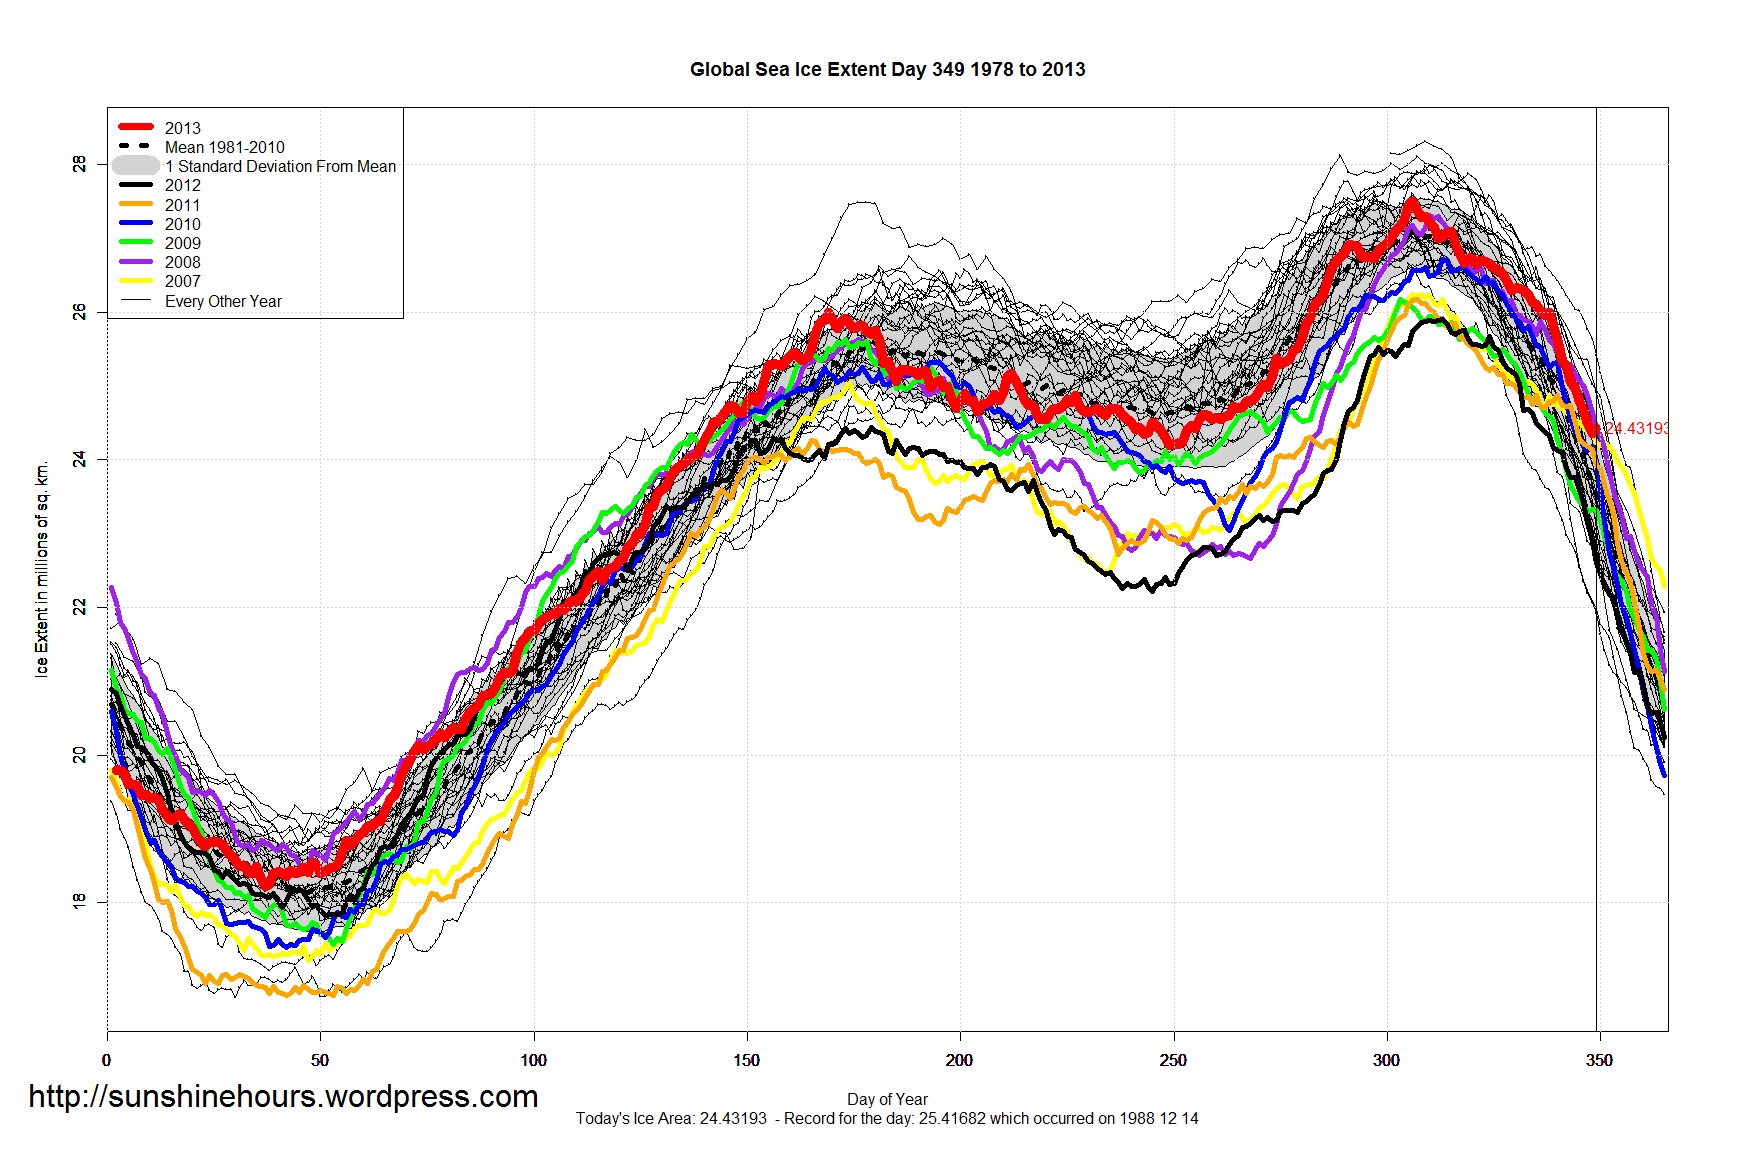
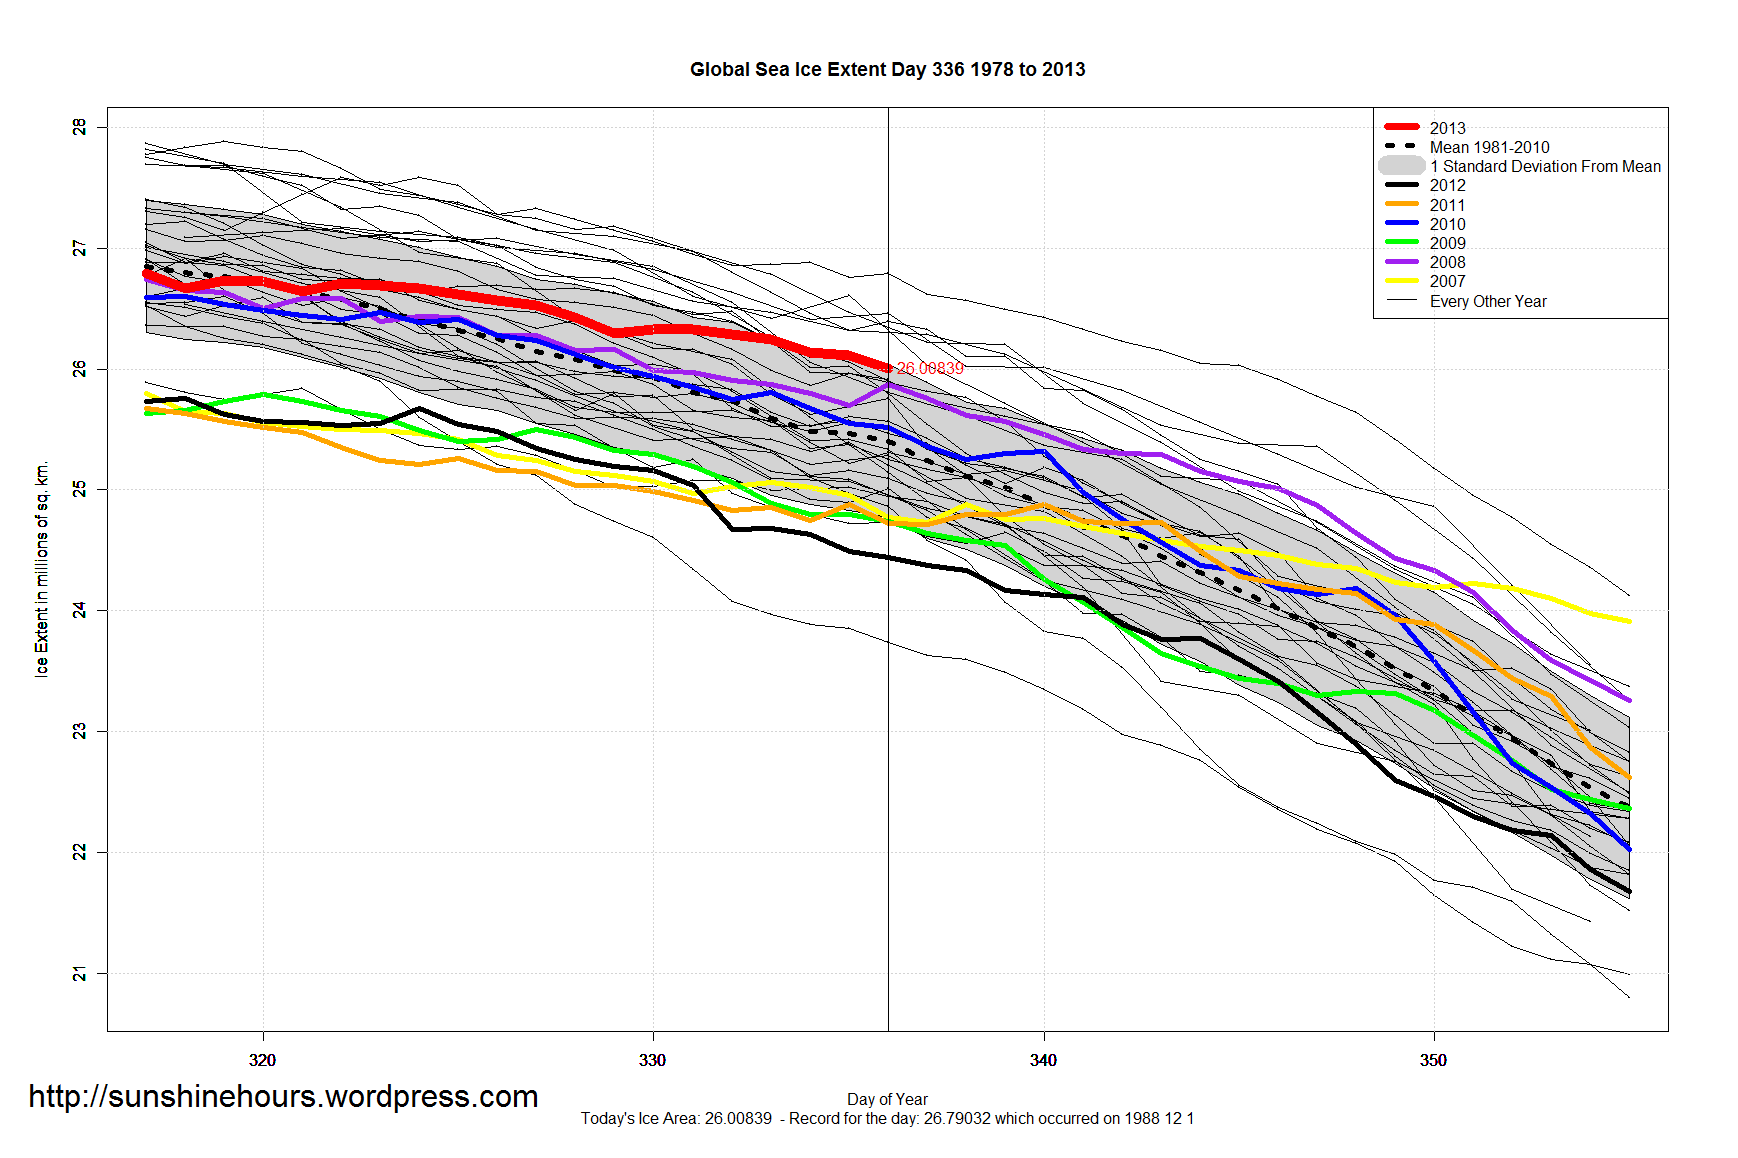
As of Dec 16 2013, Global Sea Ice is the 5th highest for the day, and above the 1981-2010 mean by 900,000 sq km.
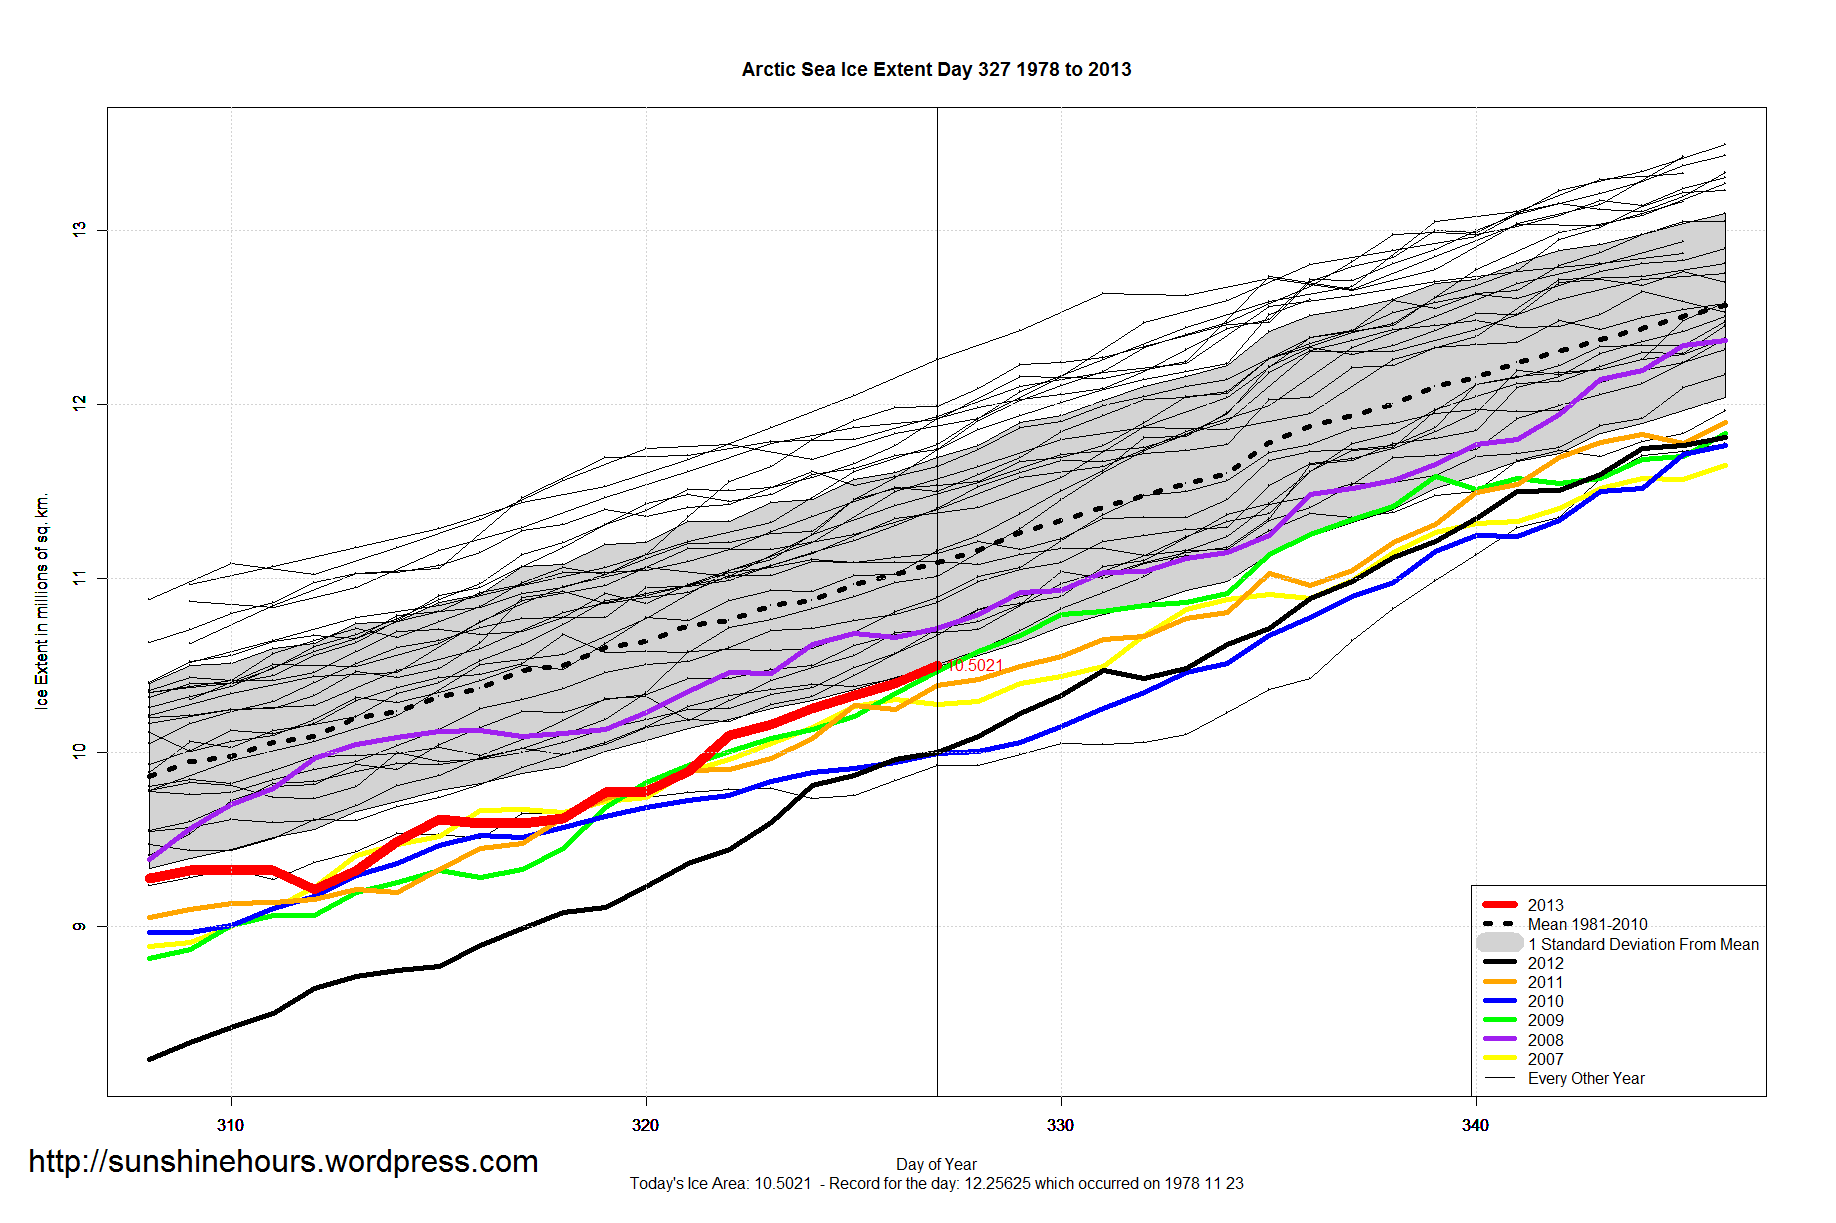
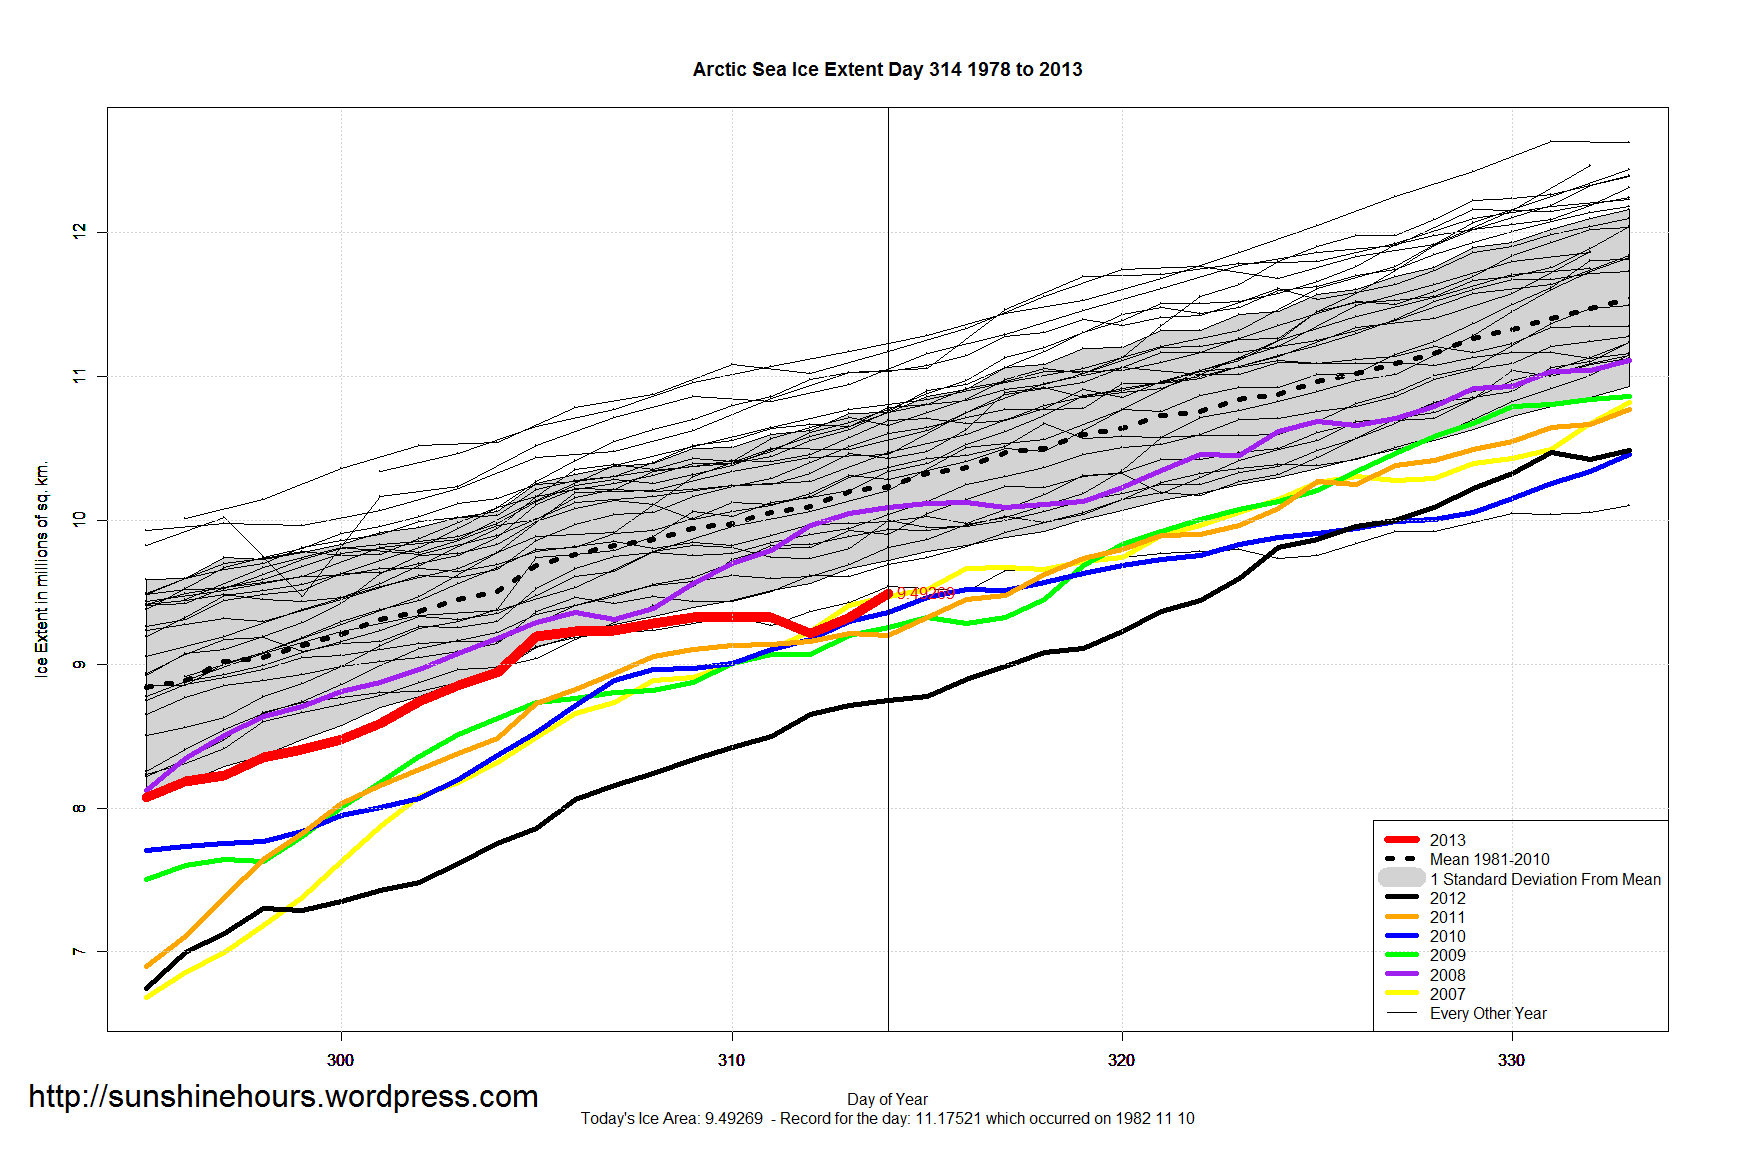
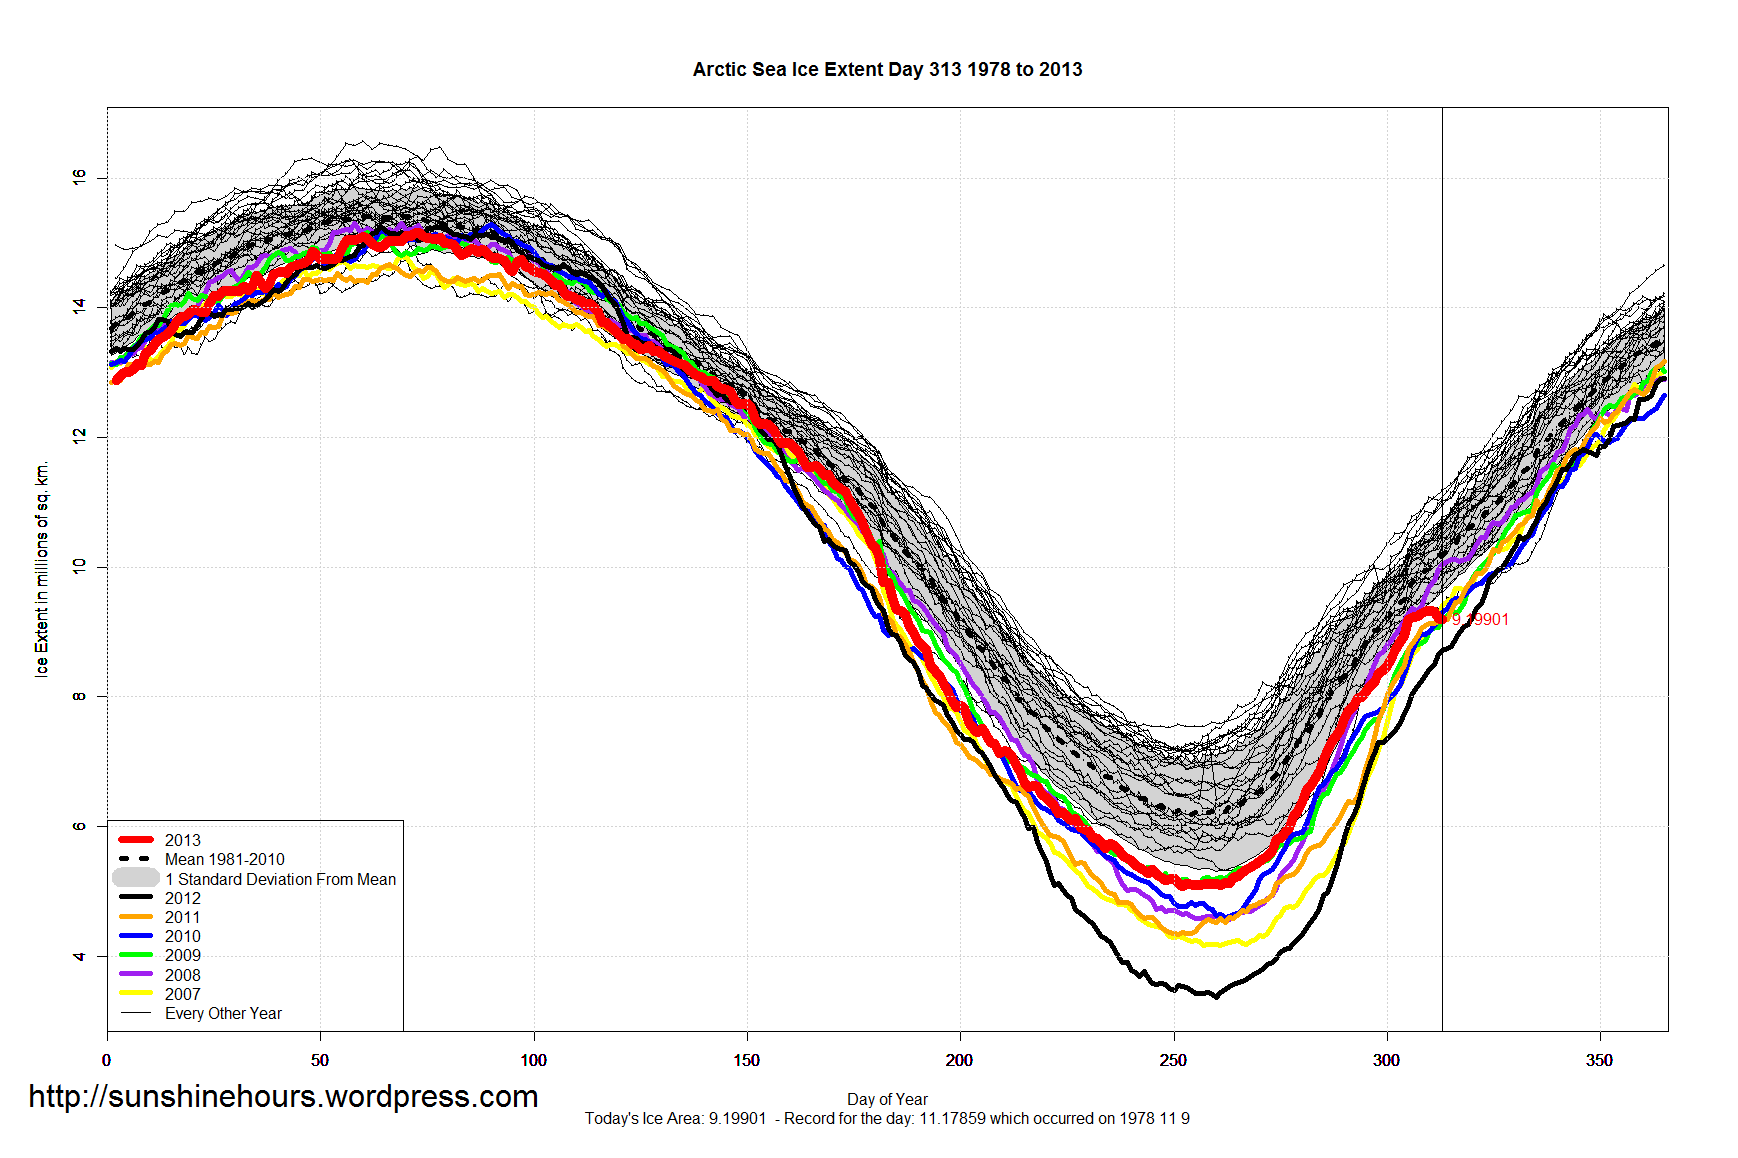
Arctic Sea Ice Extent is Only 240,000 sq km Below 1981-2010 Mean. Which is 2%. And now 2013 is higher than 2 years in the 1990s: 1996 and 1998.
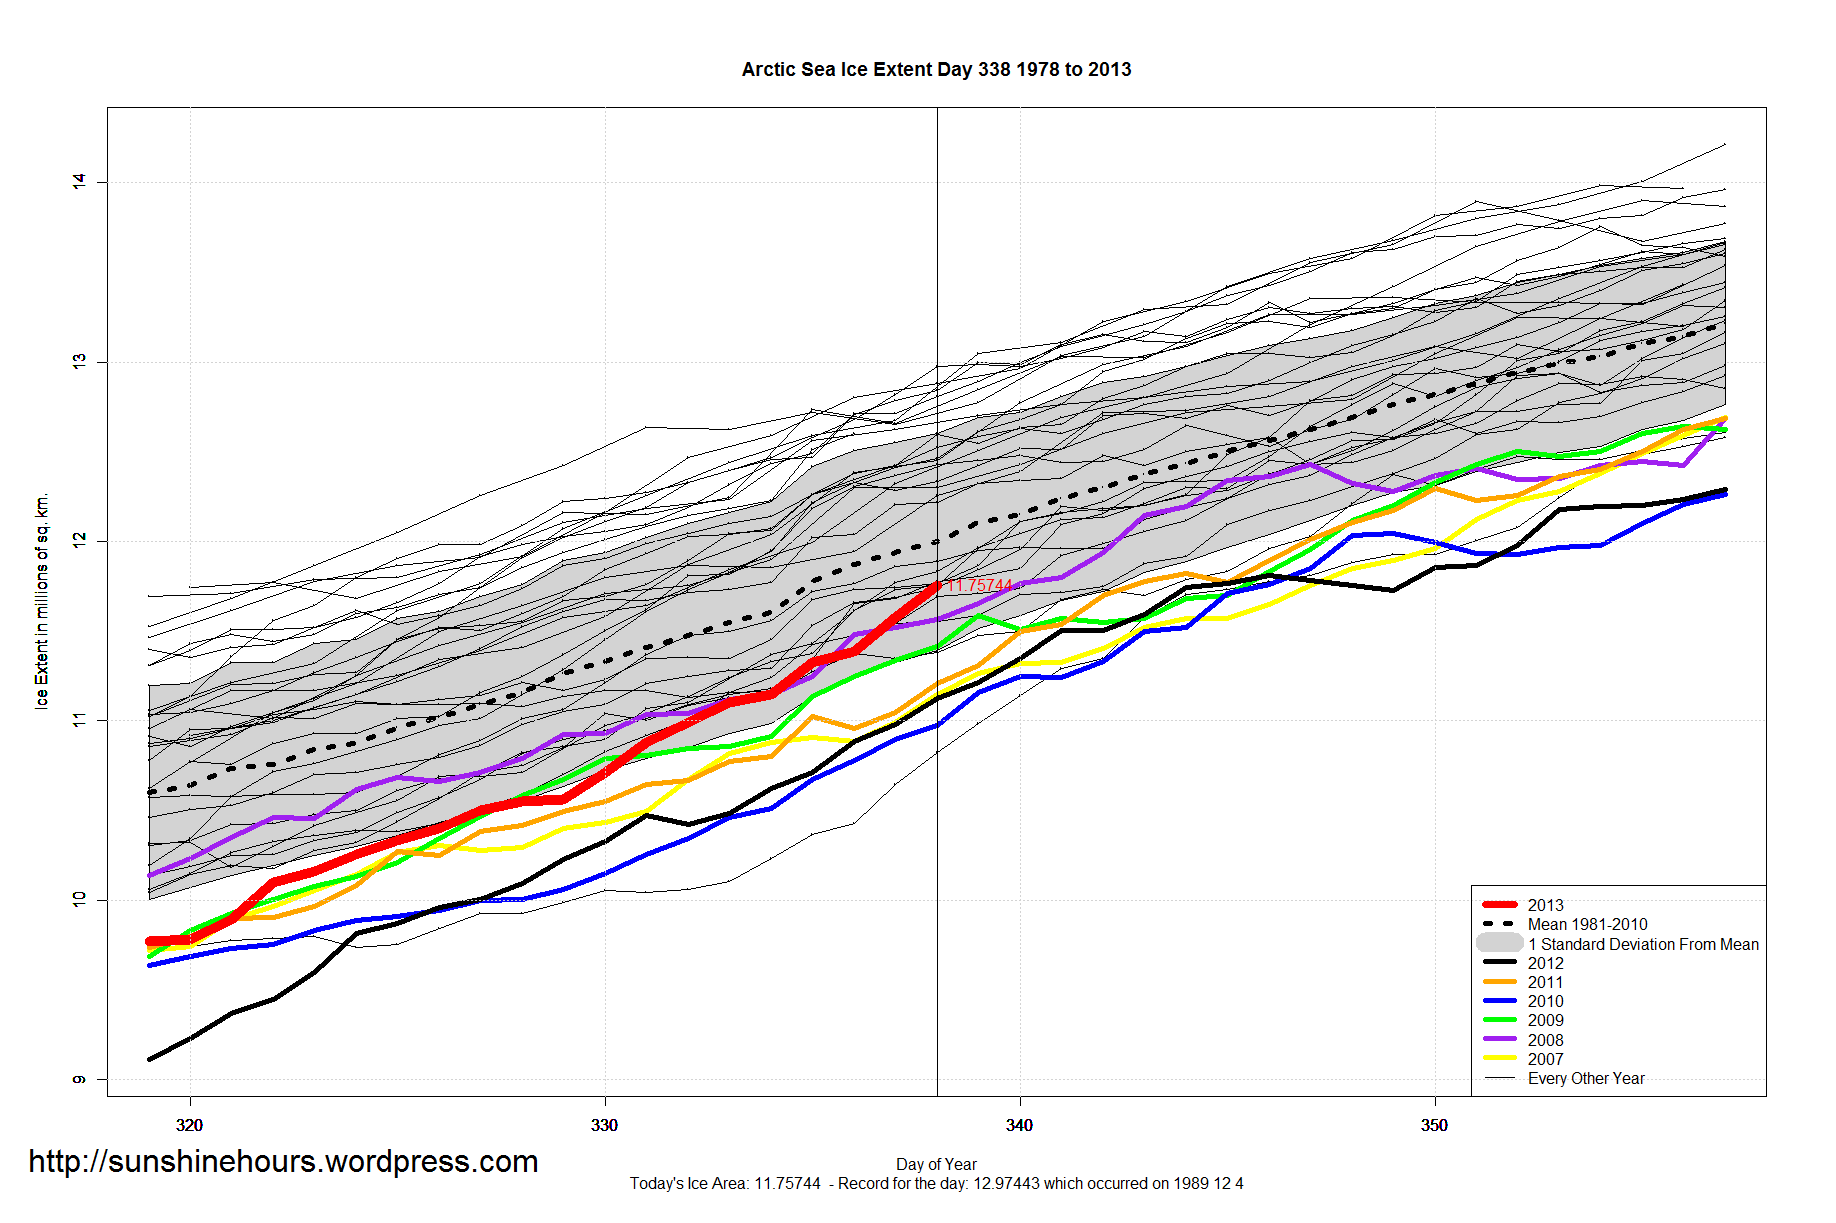
Arctic Sea Ice Extent is well within one standard deviation for this day, and is now heading for the 1981-2010 mean.
2004 was the last time it was higher for this day.


Global Sea Ice is above the 1981-2010 mean by 600,000 sq km.
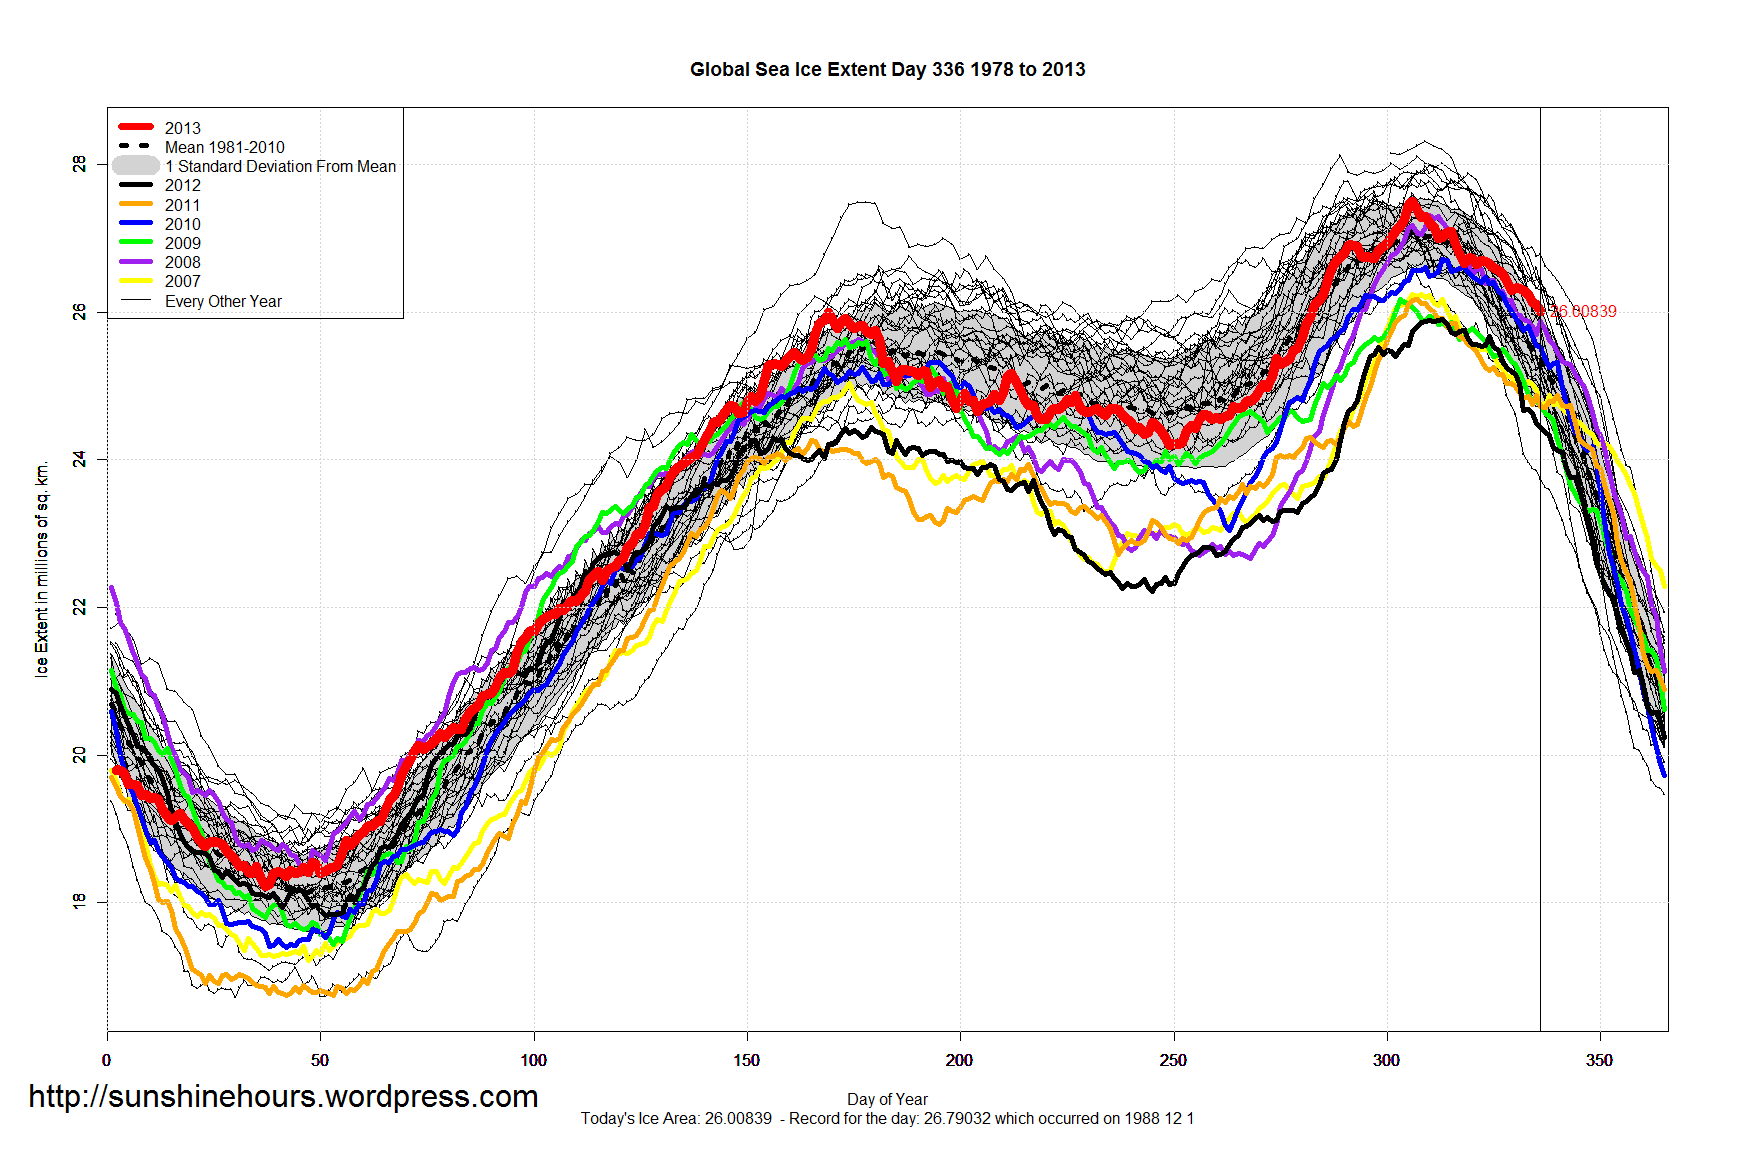
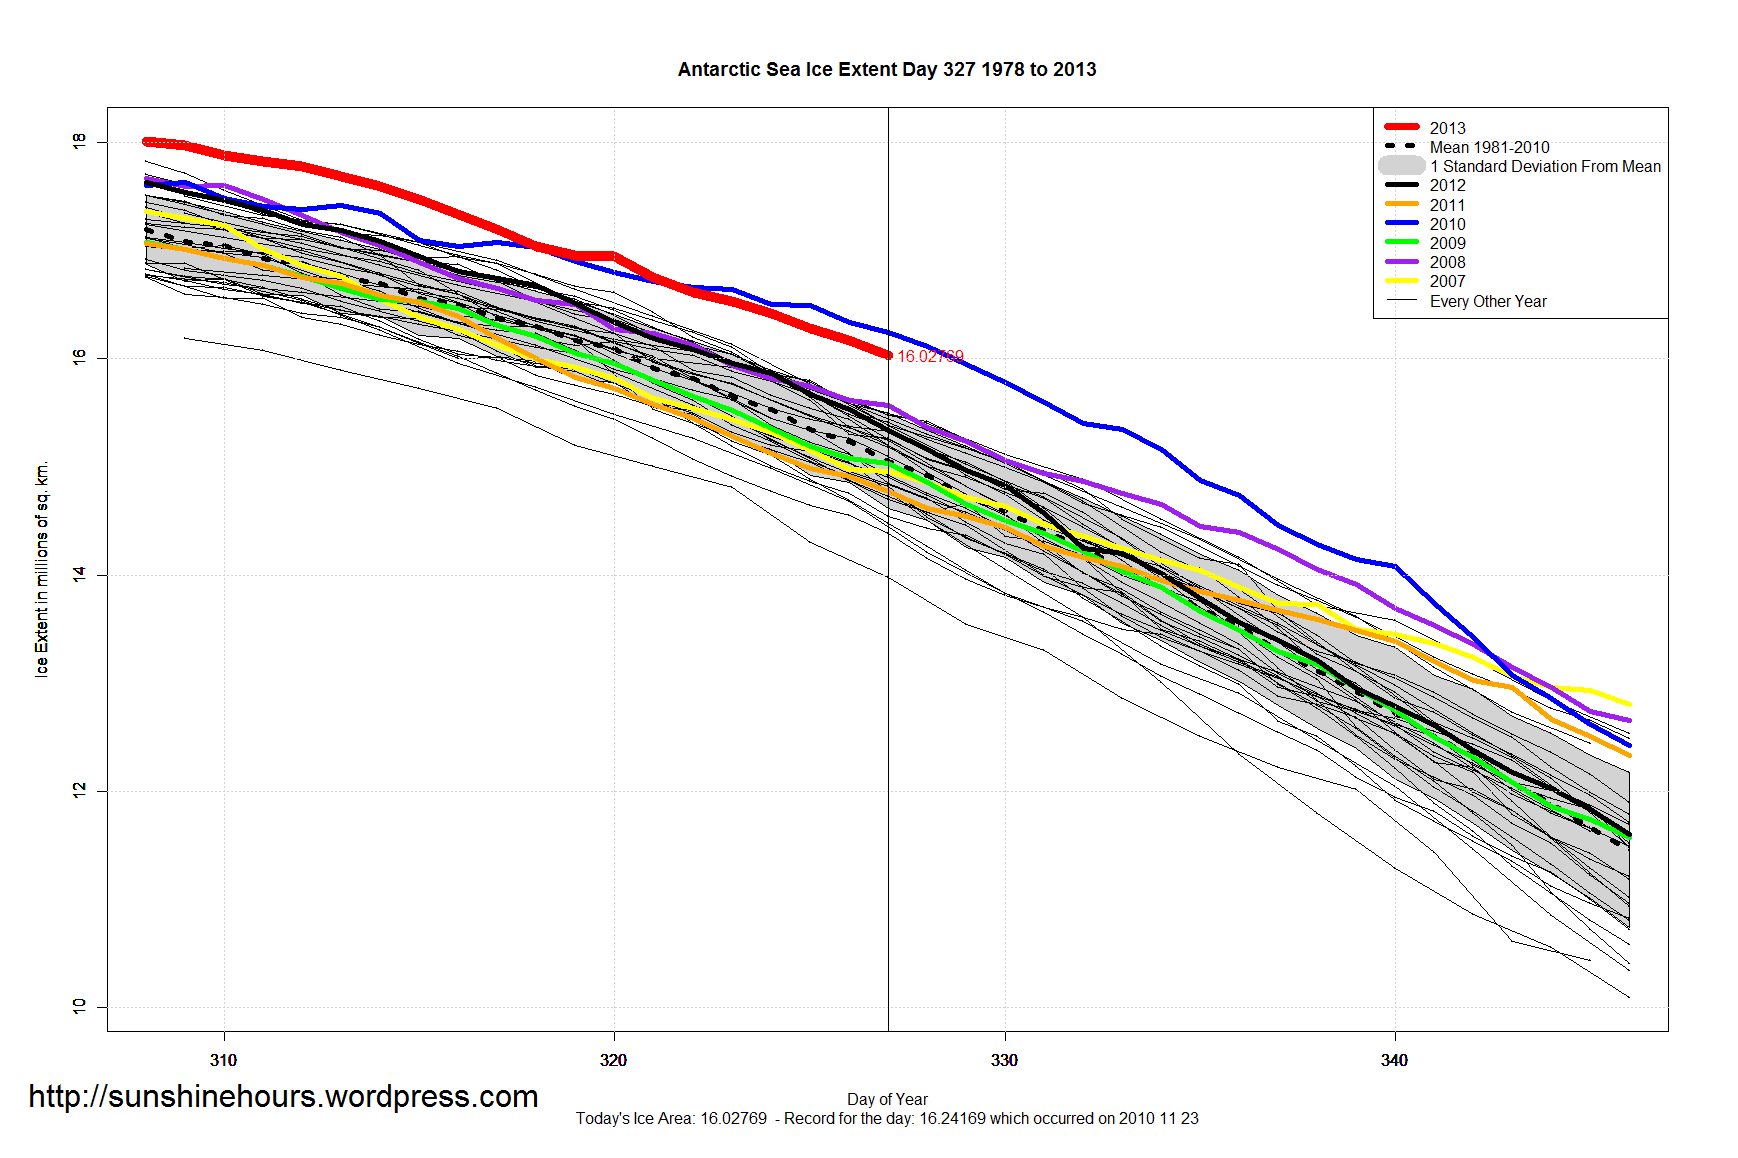
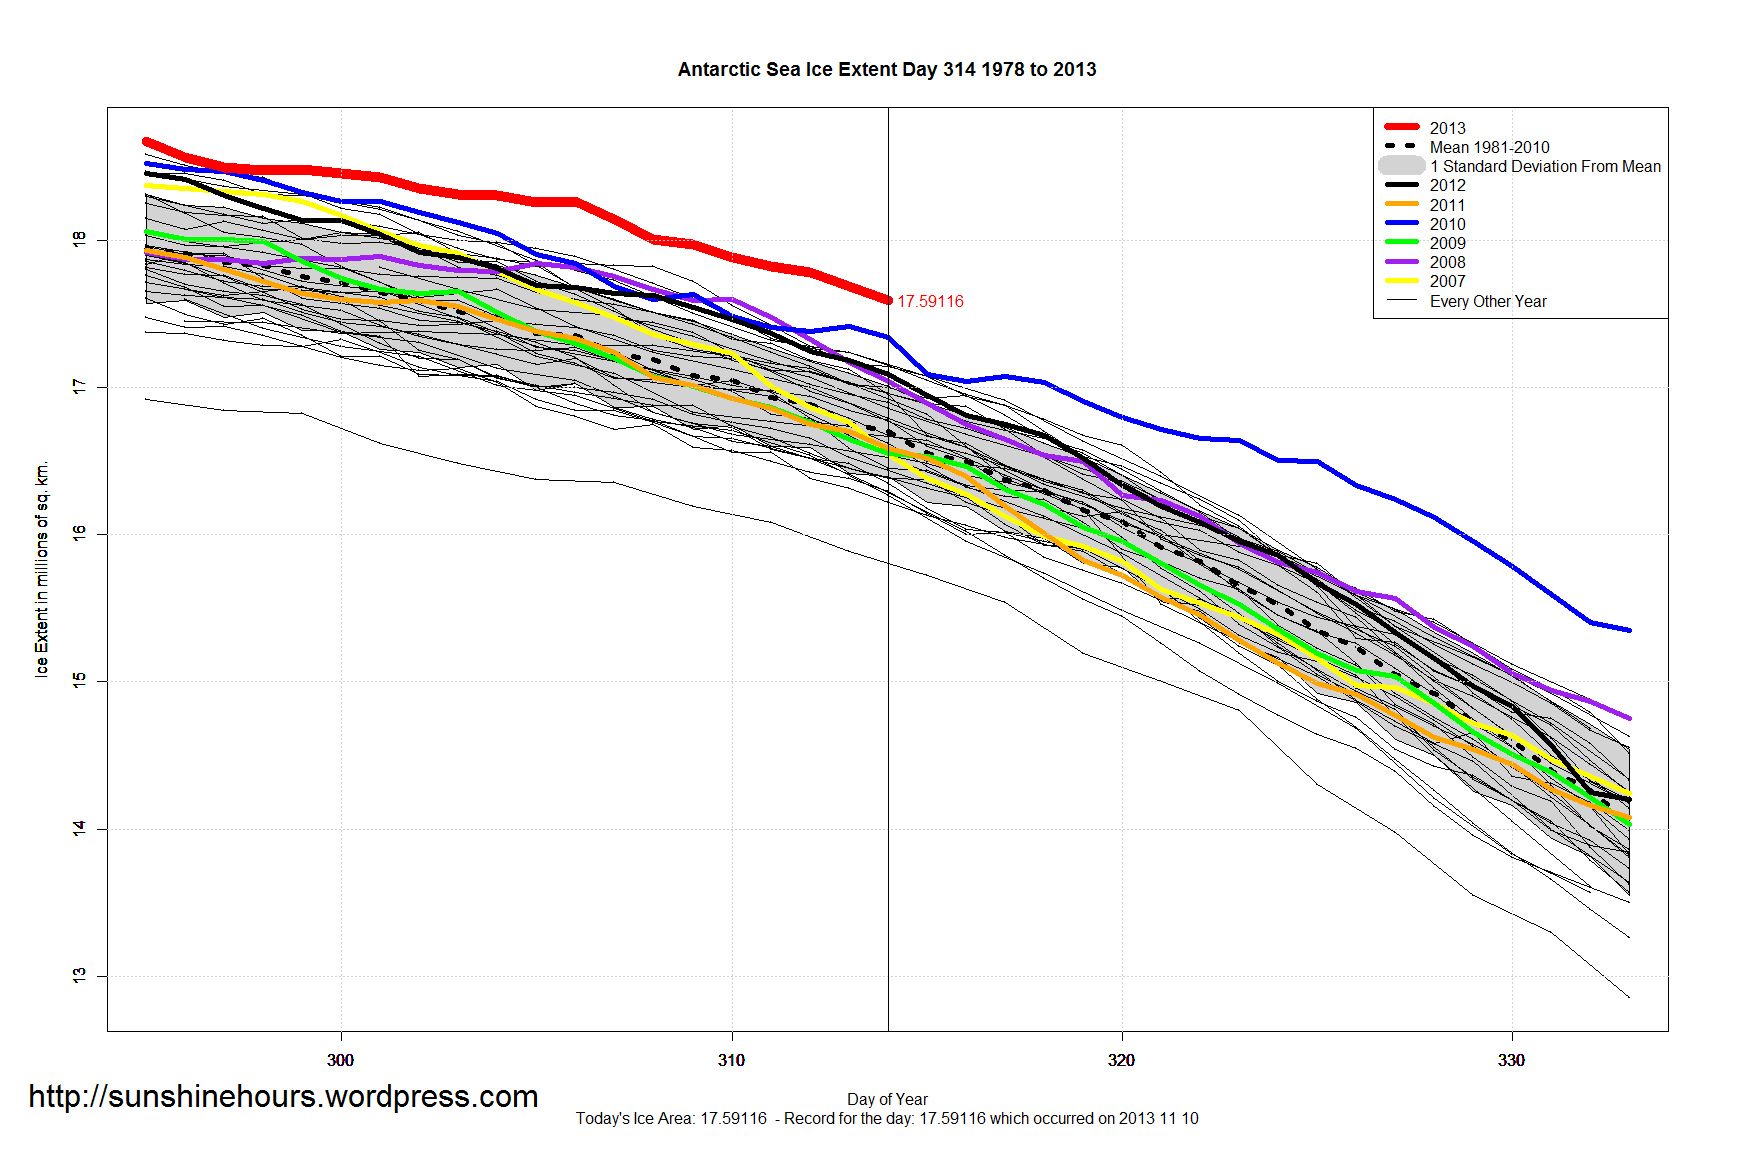
Antarctic Sea Ice Extent is 977,000 sq km above normal – but below the daily record set in 2010 (and probably will be for a while).
Arctic Sea Ice Extent is 591,000 sq km below normal, but within one standard deviation.
Global Sea Ice Extent is 385,000 sq km above normal.
Yesterday some of the NSIDC data for Arctic Sea Ice Extent and Antarctic Sea Ice Extent was missing, resulting in some strange graphs.
Today things appear back to normal except the data for Nov 11 is missing completely. The data is usually updated at 7:50am every day. Todays data is missing.
The current data is dated 3:46:00 PM Nov 11, 2013 (yesterday).
Update: The NSIDC dataset has a column called “Missing”. It never has any data in it. Until now.
In the Arctic the only data with data in the Missing column:
| Year | Month | Day | Extent | Missing |
| 2013 | 11 | 9 | 9.27397 | 0.00049 |
| 2013 | 11 | 10 | 7.1533 | 5.13051 |
Antarctic
| Year | Month | Day | Extent | Missing |
| 2013 | 1 | 14 | 5.58306 | 0.00109 |
| 2013 | 11 | 9 | 17.73409 | 0.01129 |
| 2013 | 11 | 10 | 11.16475 | 16.20944 |
Actual data from NSIDC. I think they missed some ….
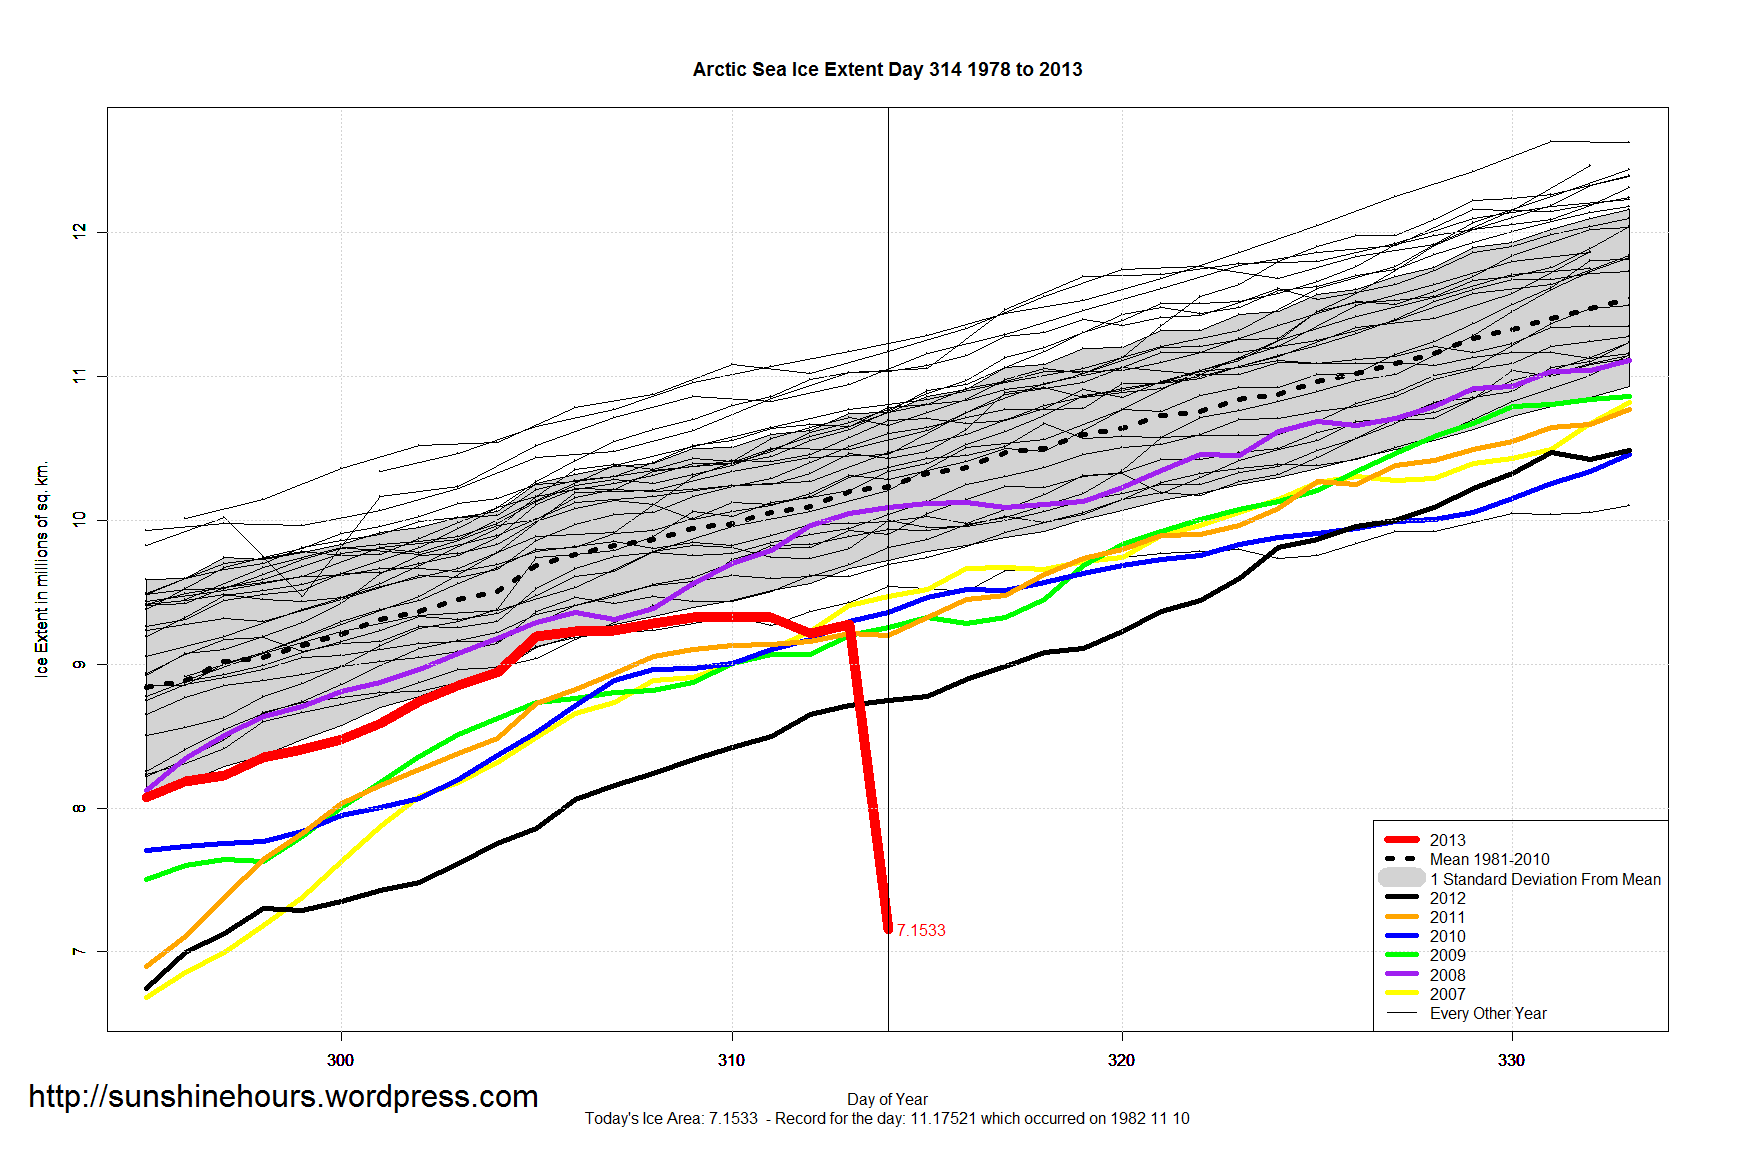
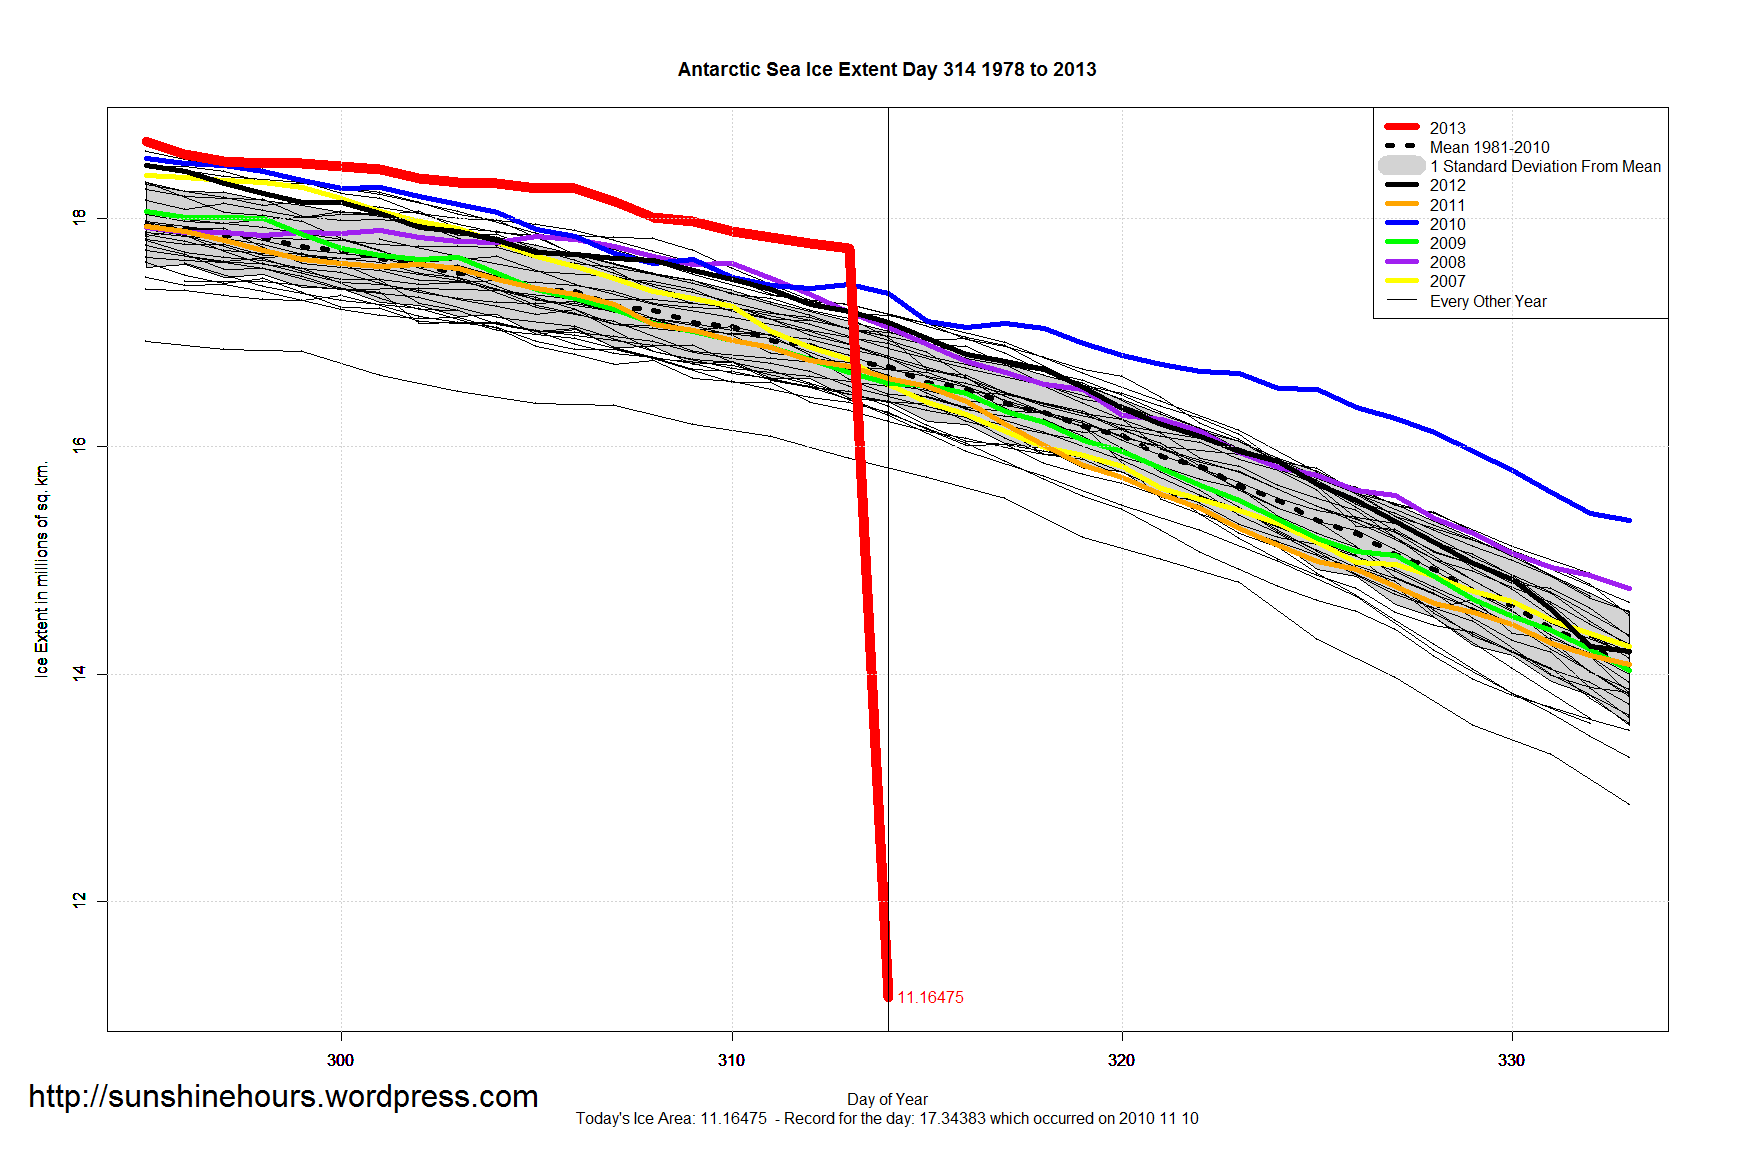
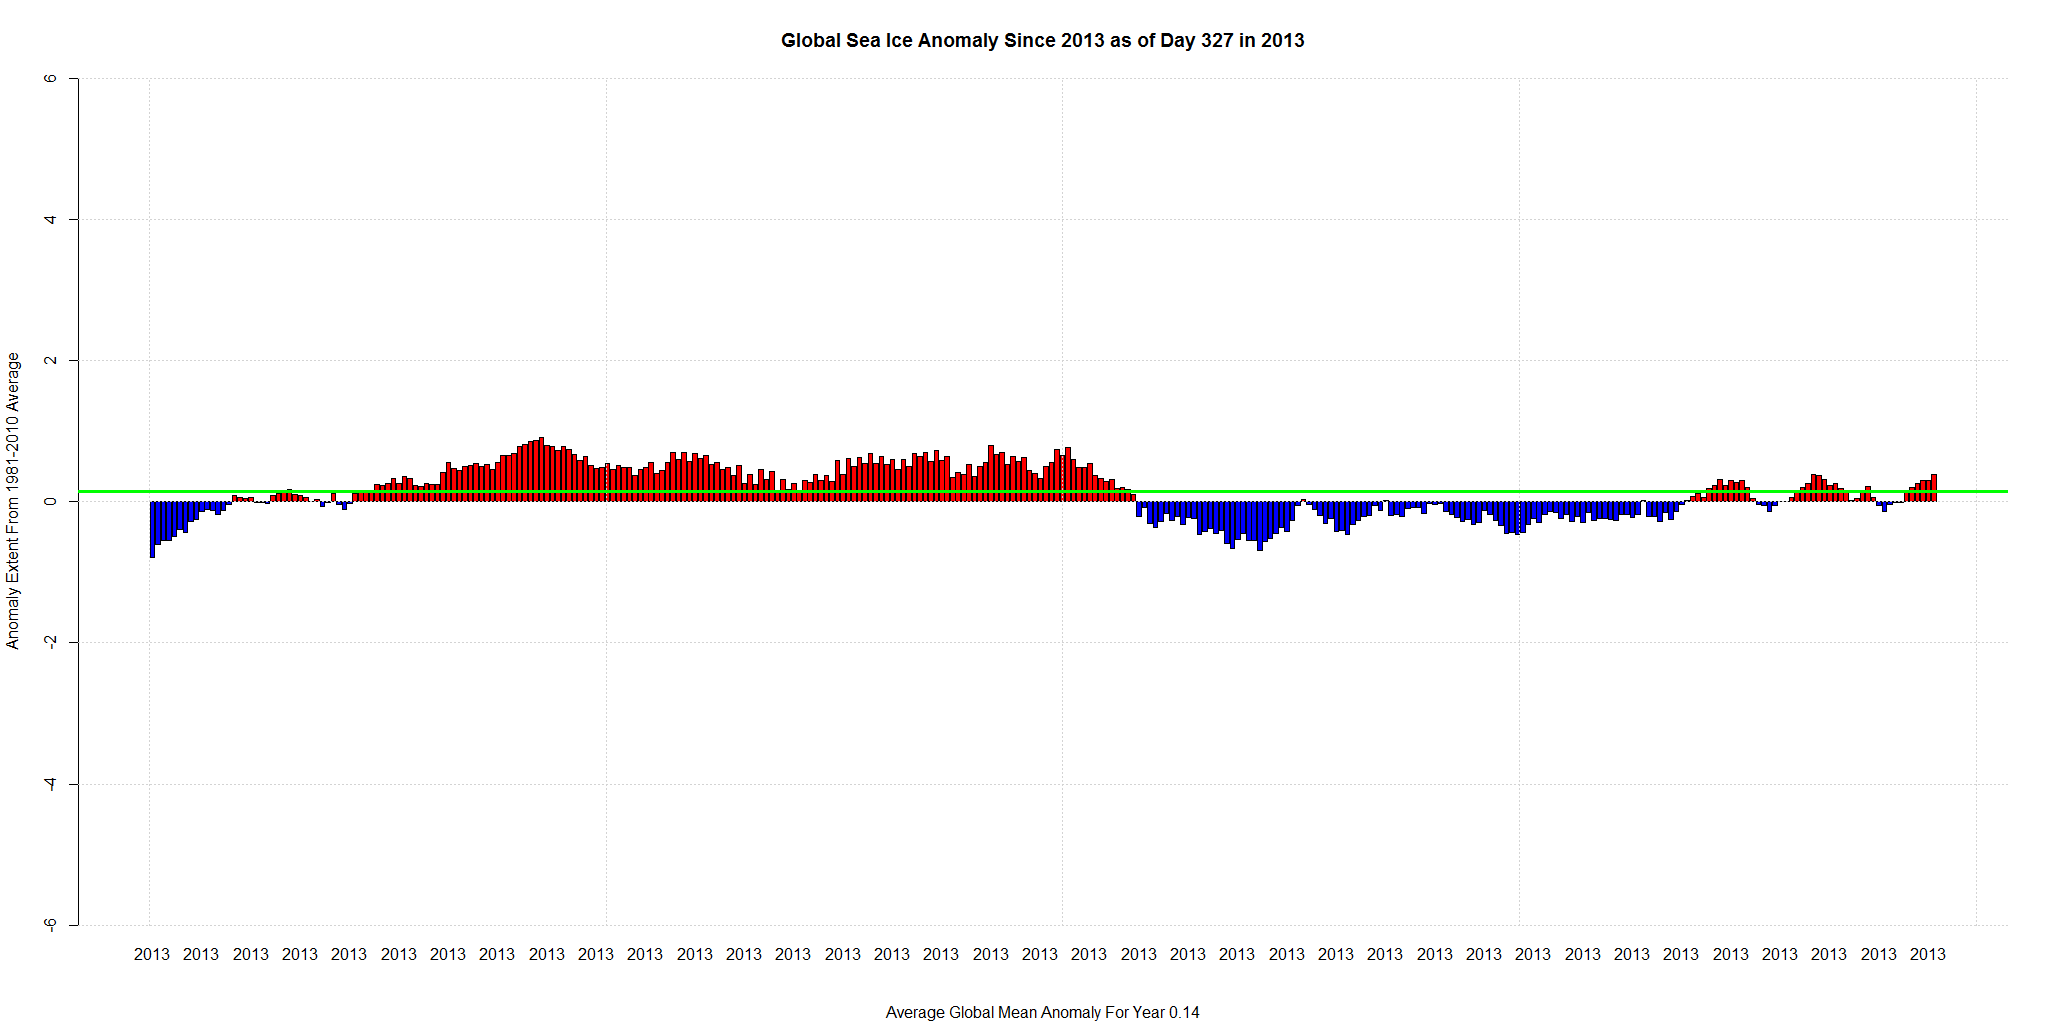
Very strange goings on in the arctic. It looks very dramatic in the bottom graph.
Possibly this monstrous tropical cyclone that smashed in the Bering Sea?
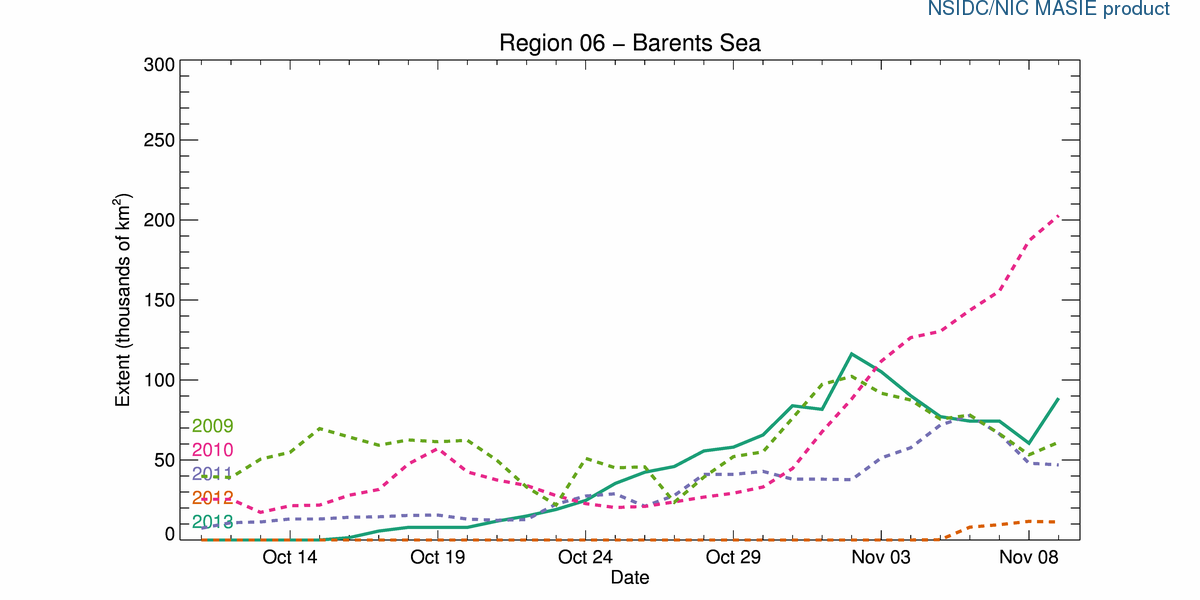
Update: Barents Sea Ice did take a tumble starting Nov 2. Which is nowhere near the Bering Sea.

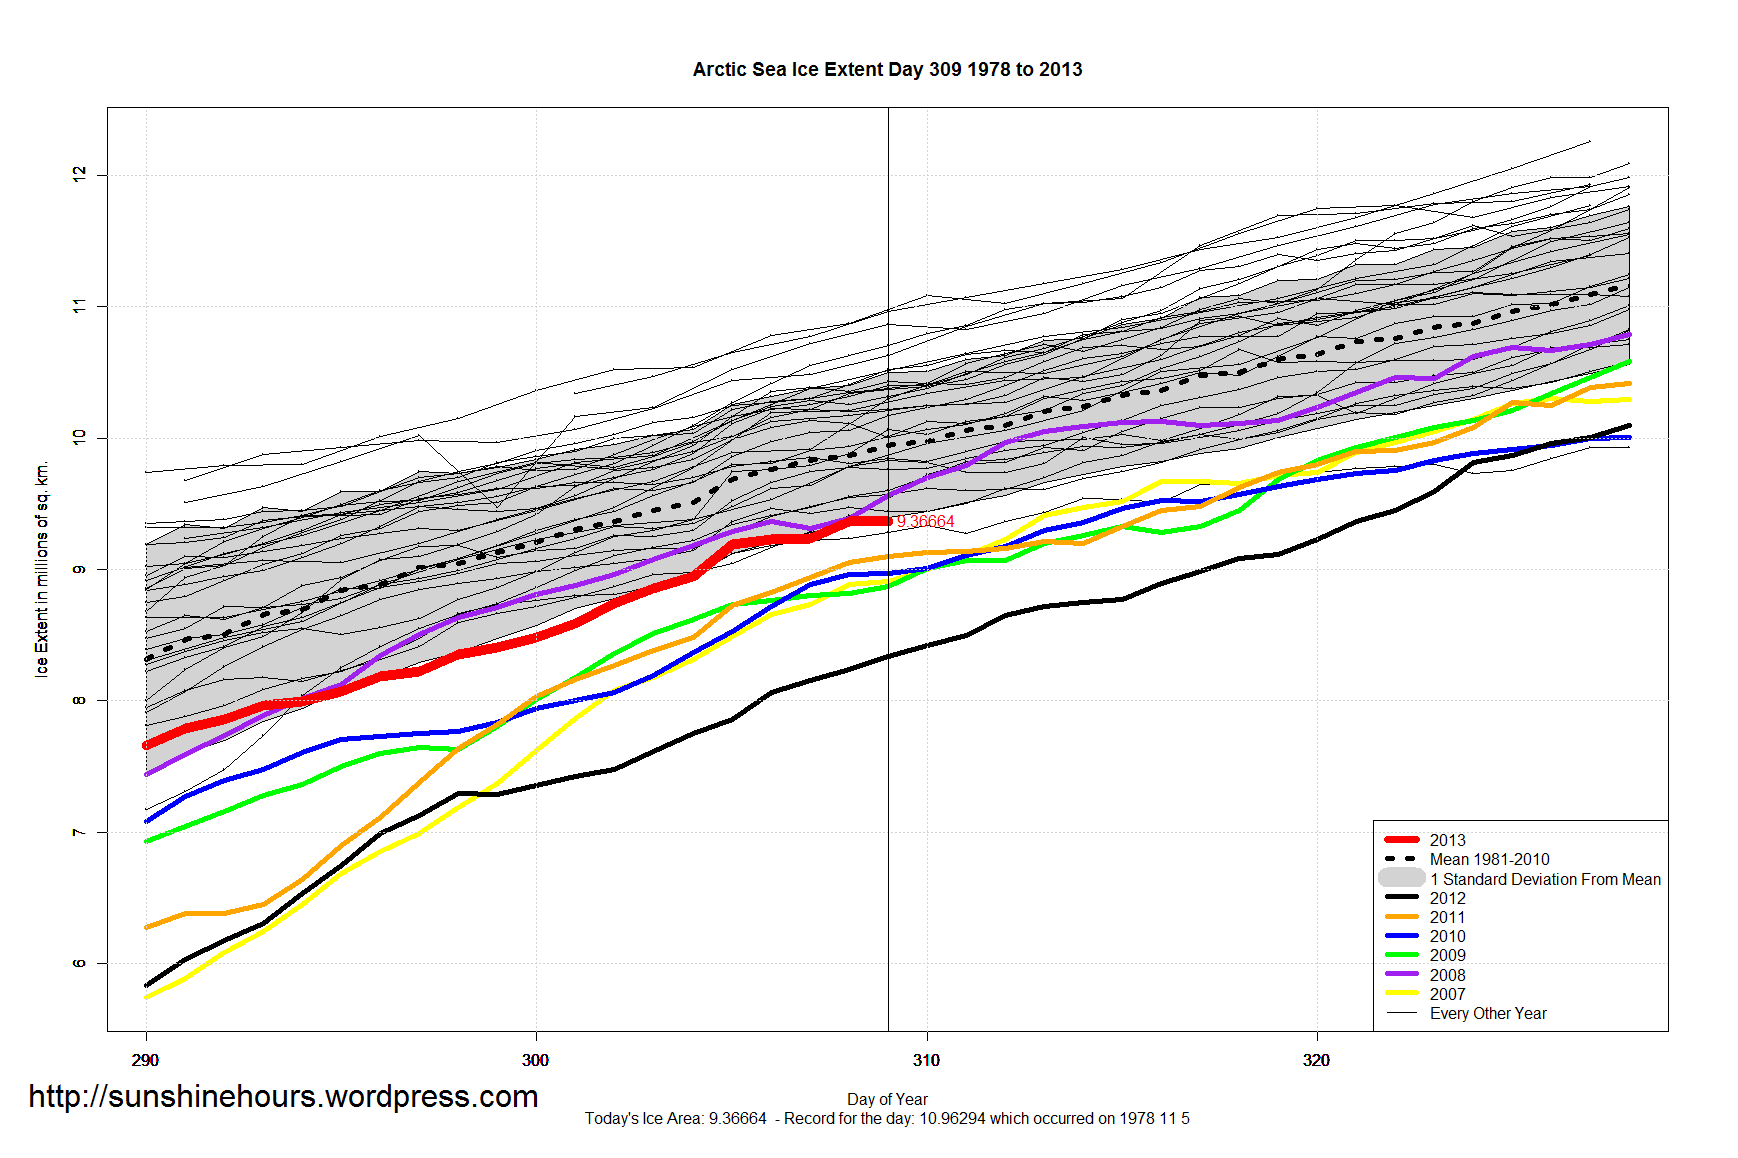
Arctic Sea Ice Extent is just skimming along the bottom of the one standard deviation from the 1981-2010 mean on day 309.
Sea Ice is 580,000 sq km below the mean. Which happens to be about 5.8% since the mean for the day is almost exactly 10 million sq km.
On this day in 2012 Sea Ice was 16% below the mean.
