There have been no updates to NSIDC Sea Ice Extent for two days. Data is usually found here and here.
I am guessing it is because of the recent intense solar flares and activity.
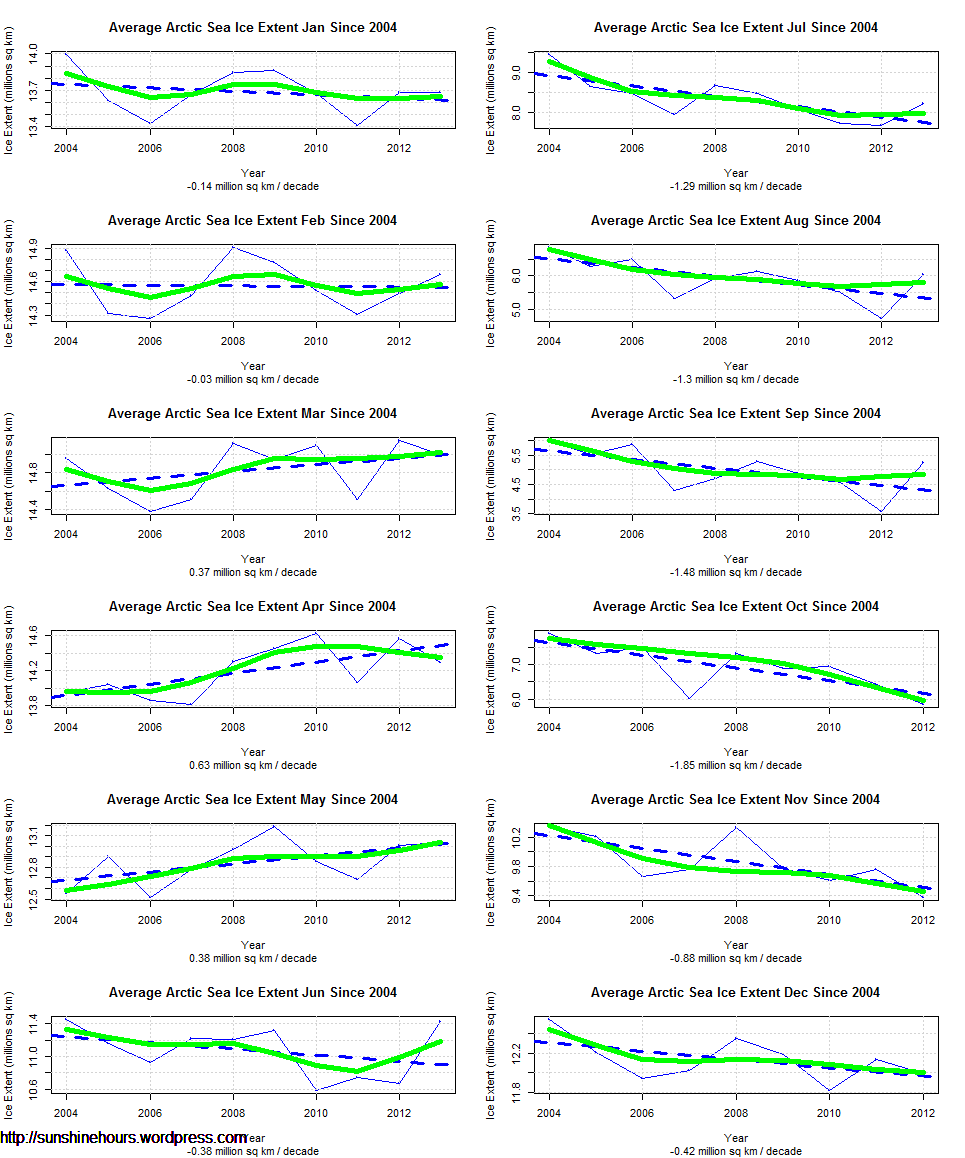
It is interesting to look at the mean Arctic Sea Extent for each month (for the last 10 years) all on one page.
The decadal trend is at the bottom of each graph. The dashed blue line is the linear trend. The green line is the loess trend.
January is dropping slightly, February is flat, March April and May are all climbing.
June is sropping but it has a major uptick from 2010.
July to September are dropping (but with an uptick at the end)
There is no data for Oct/Nov/Dec 2013 because of the shutdown. But all 3 will have an uptick for 2013.
There were no NSIDC sea ice updates today. I emailed NSIDC to ask why and got this prompt and polite reply.
“Thank you for contacting the National Snow and Ice Data Center.Because our data provider, the National Oceanic and Atmospheric Administration (NOAA), has shut down the data stream as part of the government shutdown, we are temporarily unable to update the product.
I apologize for the inconvenience.
Best regards,
xxxxxxxx xxxxxxxxxx
NSIDC User Services”
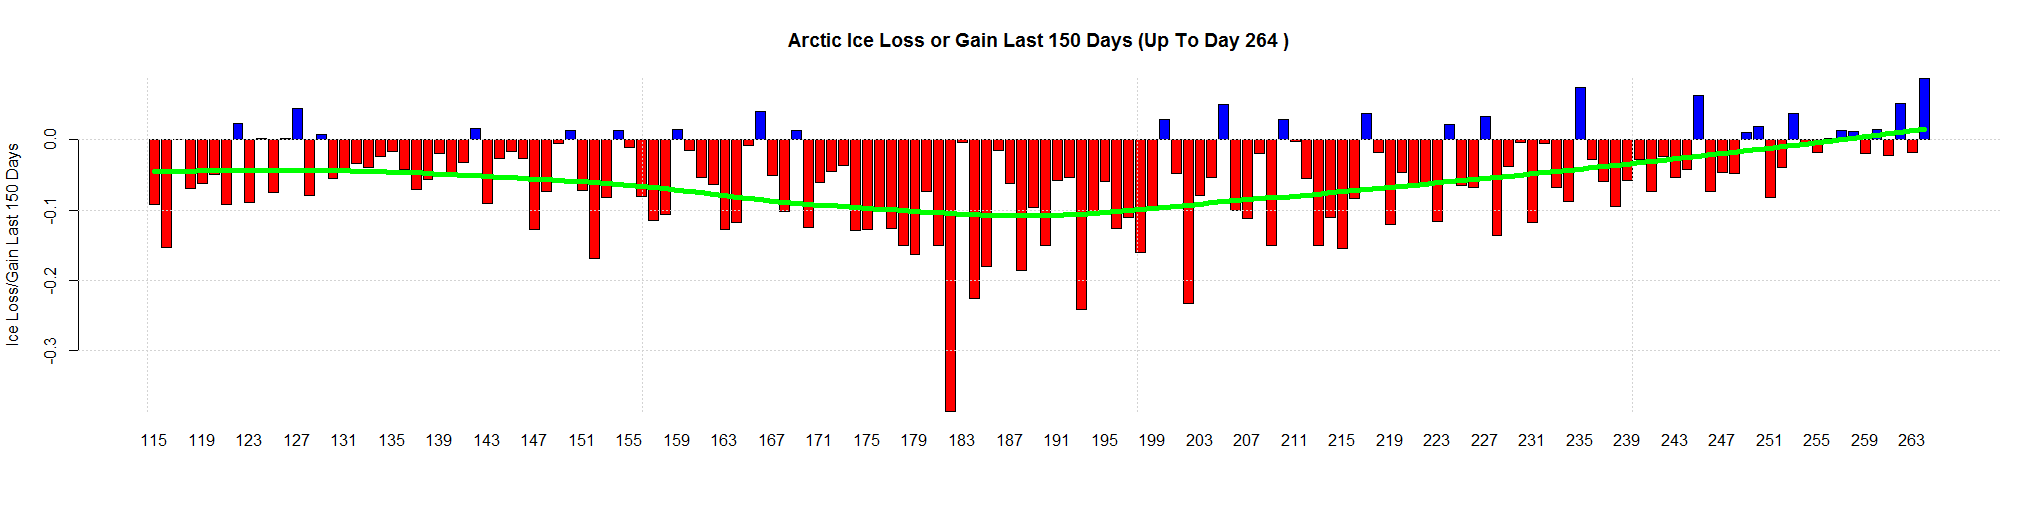
Arctic Sea Ice Extent gained 86,000 sq km. on day 264. Thats the 2nd major gain on 3 days. The minimum was back on day 252 and it is very unlikely that will change.

The melting of the Arctic Sea Ice may be over. Here are some stats for NSIDC Extent. The stats for 2013 could change.
Lowest Minimum 3.36973 2012
Highest Minimum 7.52476 1980
Lowest day of Minimum 245 1987
Highest day of Minimum 265 1989 and 2005
Lowest Maximum 14.67084 2011
Highest Maximum 16.56457 1979
Lowest day of Maximum 52 1987
Highest day of Maximum 90 2010
| Year | Min | Max | day of Max | day of Min |
| 2013 | 5.07939 | 15.16969 | 73 | 252 |
| 2012 | 3.36973 | 15.25102 | 64 | 260 |
| 2011 | 4.33028 | 14.67084 | 66 | 251 |
| 2010 | 4.59918 | 15.28449 | 90 | 262 |
| 2009 | 5.05488 | 15.16275 | 61 | 255 |
| 2008 | 4.55469 | 15.30522 | 58 | 262 |
| 2007 | 4.1607 | 14.78963 | 69 | 257 |
| 2006 | 5.74877 | 14.73298 | 70 | 257 |
| 2005 | 5.31832 | 14.94615 | 71 | 265 |
| 2004 | 5.77608 | 15.25548 | 70 | 263 |
| 2003 | 5.97198 | 15.58678 | 80 | 260 |
| 2002 | 5.62456 | 15.57345 | 68 | 256 |
| 2001 | 6.56774 | 15.66664 | 63 | 262 |
| 2000 | 5.9442 | 15.44482 | 63 | 255 |
| 1999 | 5.68009 | 15.55755 | 89 | 255 |
| 1998 | 6.29922 | 16.02091 | 56 | 260 |
| 1997 | 6.61353 | 15.63647 | 79 | 246 |
| 1996 | 7.15283 | 15.42074 | 52 | 254 |
| 1995 | 5.98945 | 15.32238 | 59 | 252 |
| 1994 | 6.92645 | 15.72226 | 61 | 248 |
| 1993 | 6.15699 | 16.00491 | 72 | 249 |
| 1992 | 7.16324 | 15.53258 | 72 | 251 |
| 1991 | 6.26027 | 15.58803 | 56 | 259 |
| 1990 | 6.0191 | 16.21077 | 71 | 264 |
| 1989 | 6.88931 | 15.72295 | 65 | 265 |
| 1988 | 7.04905 | 16.24163 | 70 | 255 |
| 1987 | 6.89159 | 16.21724 | 52 | 245 |
| 1986 | 7.12351 | 16.11934 | 69 | 249 |
| 1985 | 6.4799 | 16.11716 | 76 | 250 |
| 1984 | 6.39916 | 15.76157 | 78 | 260 |
| 1983 | 7.19145 | 16.33207 | 73 | 251 |
| 1982 | 7.15423 | 16.27475 | 58 | 256 |
| 1981 | 6.88784 | 15.71365 | 73 | 253 |
| 1980 | 7.52476 | 16.25042 | 65 | 249 |
| 1979 | 6.89236 | 16.56457 | 60 | 264 |
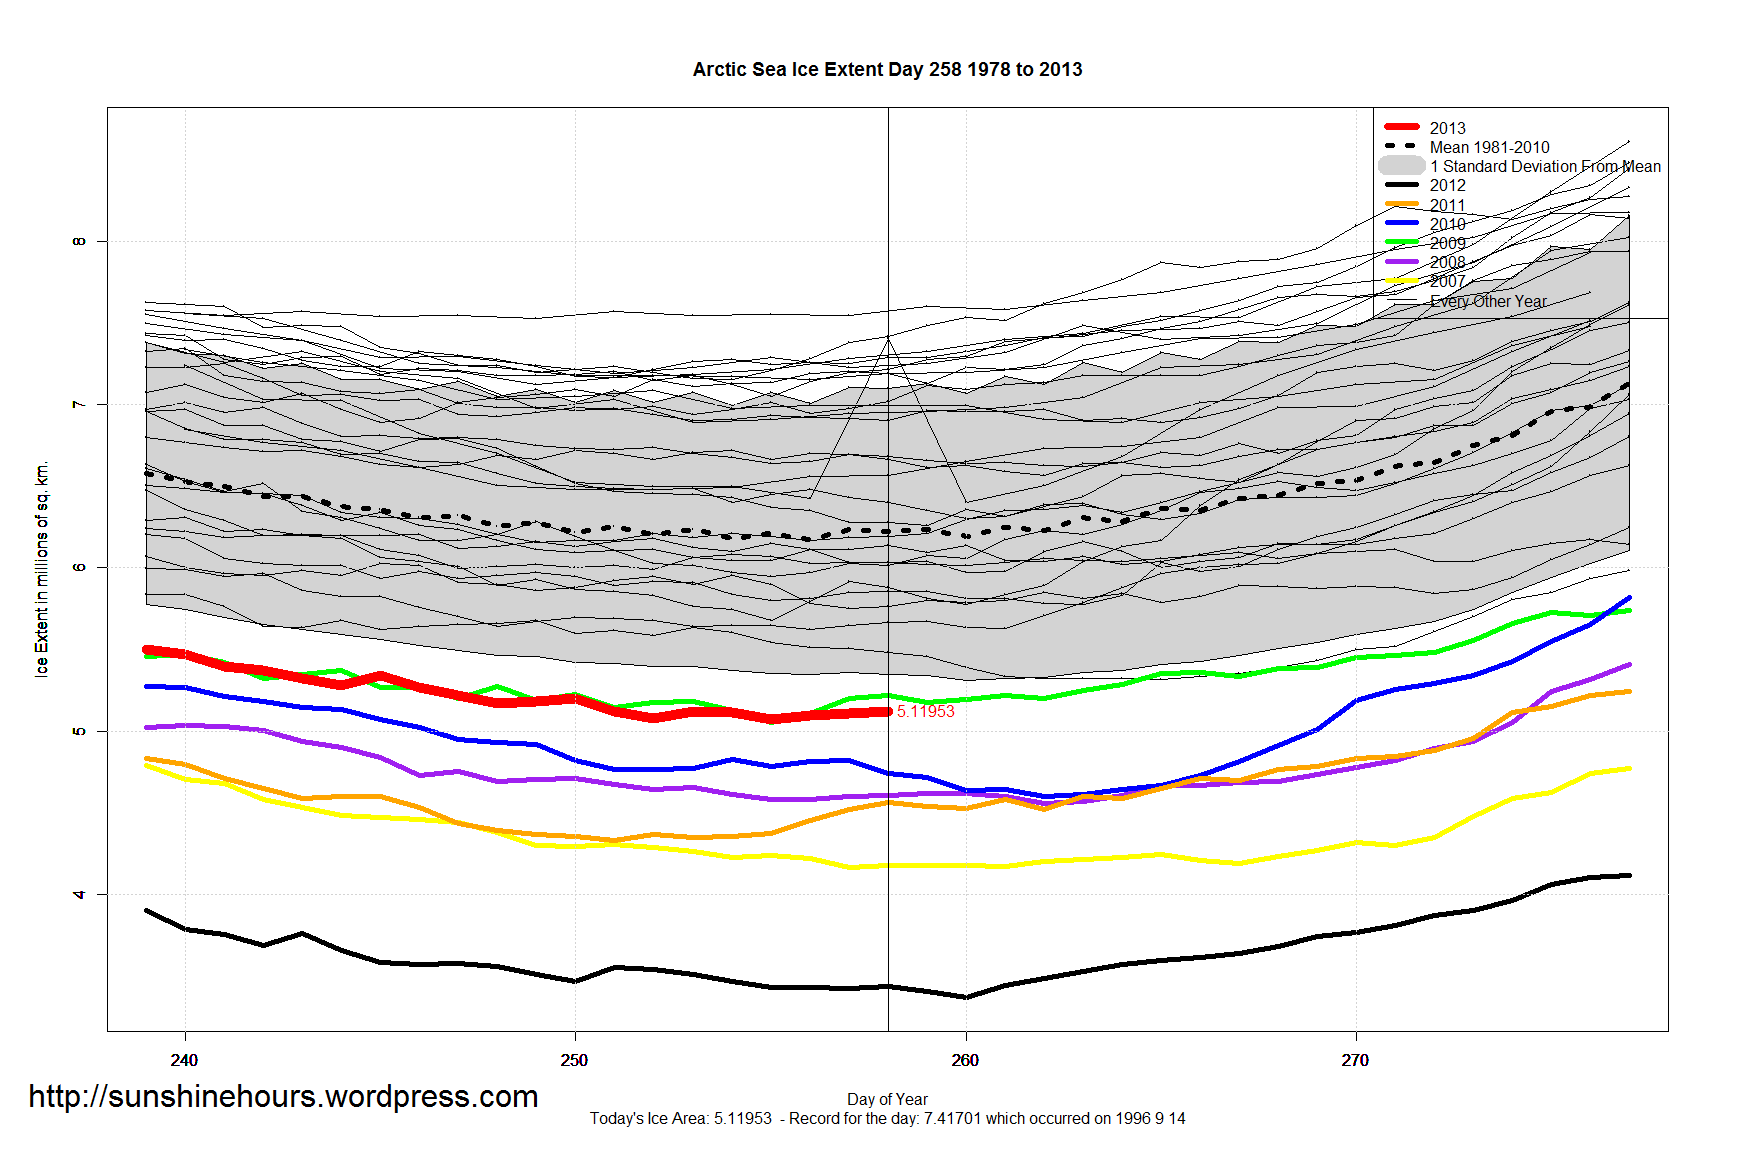
Arctic Sea Ice Extent Minimum 2013 may have occurred on Sept 12 (Day 255). I say “may have occurred” because there is a chance of more ice melt. The last 3 days have seen very small increases.
On Sept 12 (day 255) Arctic Sea Ice Extent was 5.07146 million sq km.
As of Sept 15 (day 258) Arctic Sea Ice Extent was 5.11953 million sq km.
If the minimum stays at day 255, it would be the 7th lowest minimum in the satellite record. The record was 3.36973 million sq km set in 2012. Which would make 2013’s minimum 1.7 million sq km’s higher.

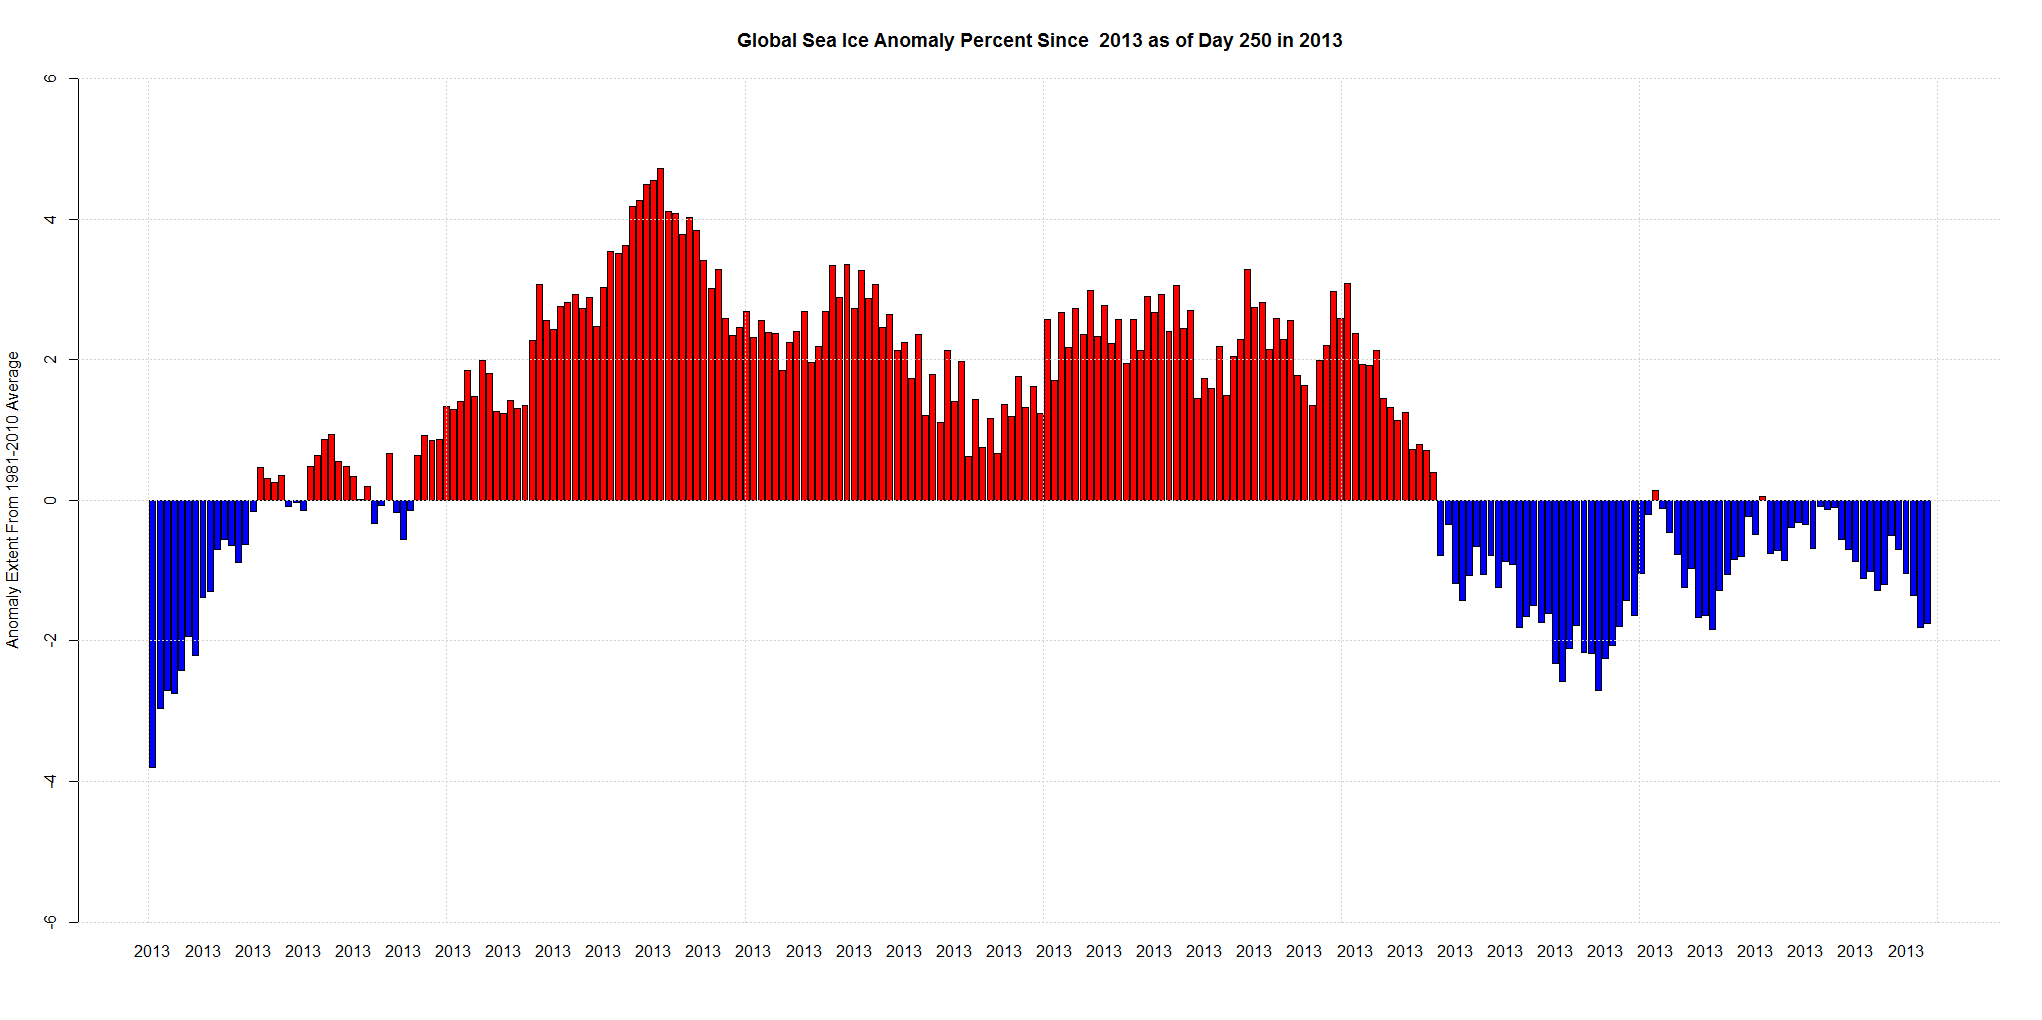
Right now the mean for the year for Global Sea Ice Anomaly percent is +0.9% above the 1981-2010 mean.
The anomaly have been over +4% earlier in the year and is now almost -2%.
Arctic Sea Ice Extent increased for the 2nd day in a row. The increase was 19,270 sq km. Minimum is getting close. Yesterday was day 250. Day 248 is the lowest value for 2013.
If day 248 turned out to be the minimum, it would be tied for third earliest with 1994. 1987’s minimum was day 245. 1997’s was 246.


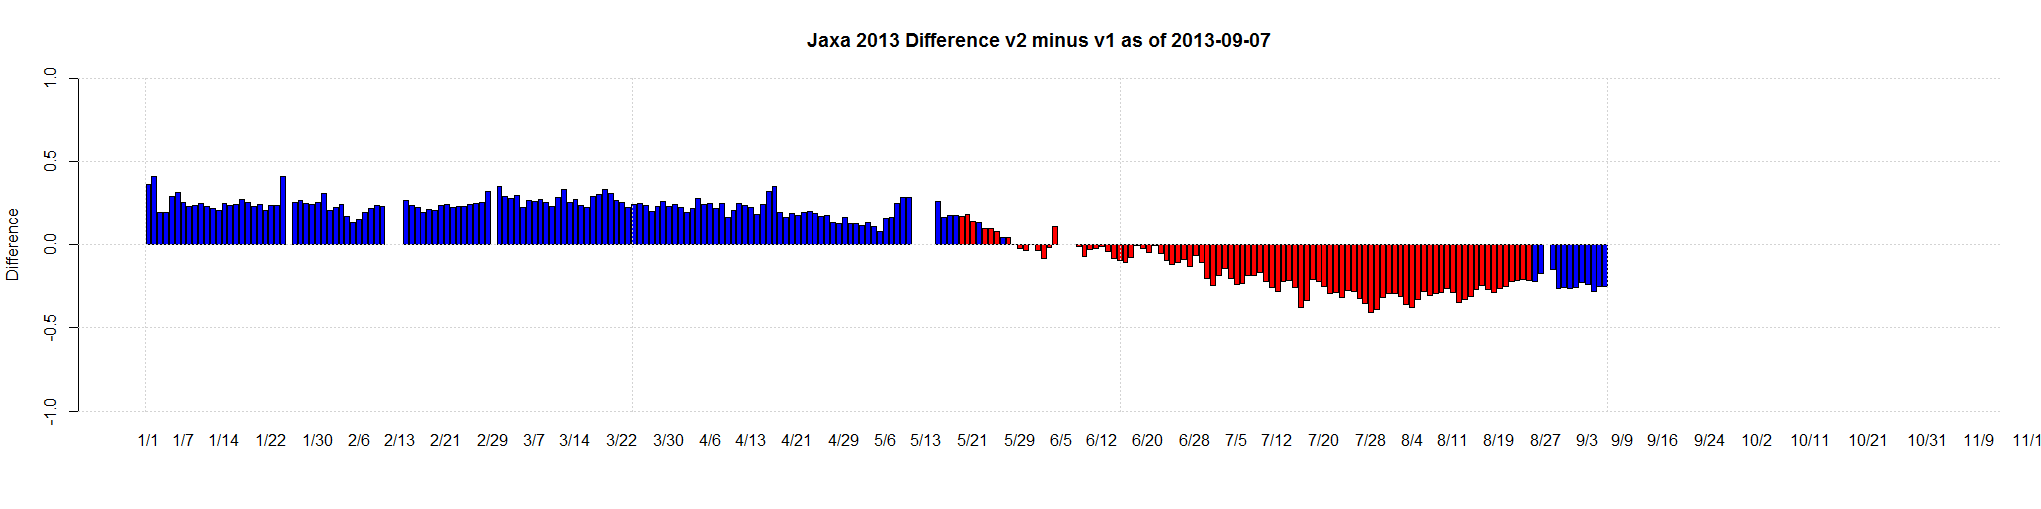
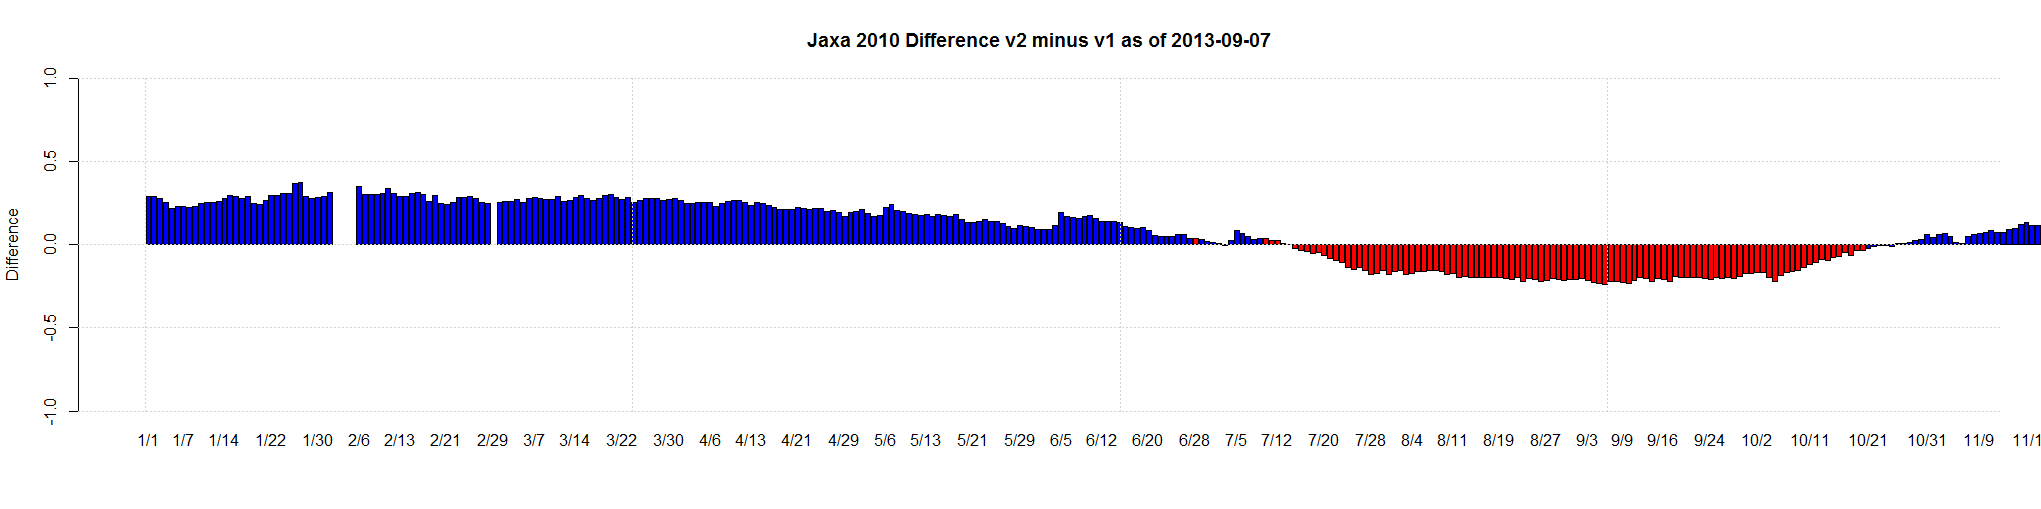
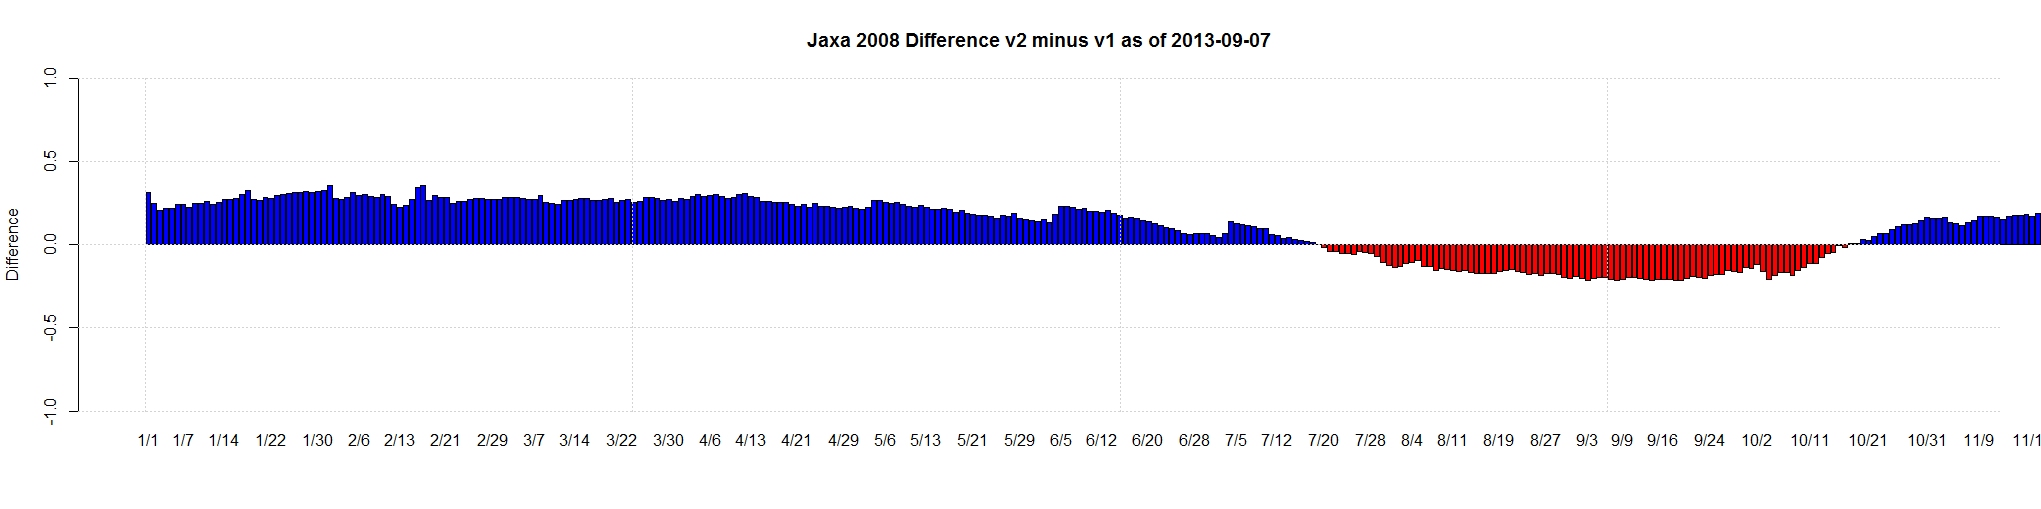
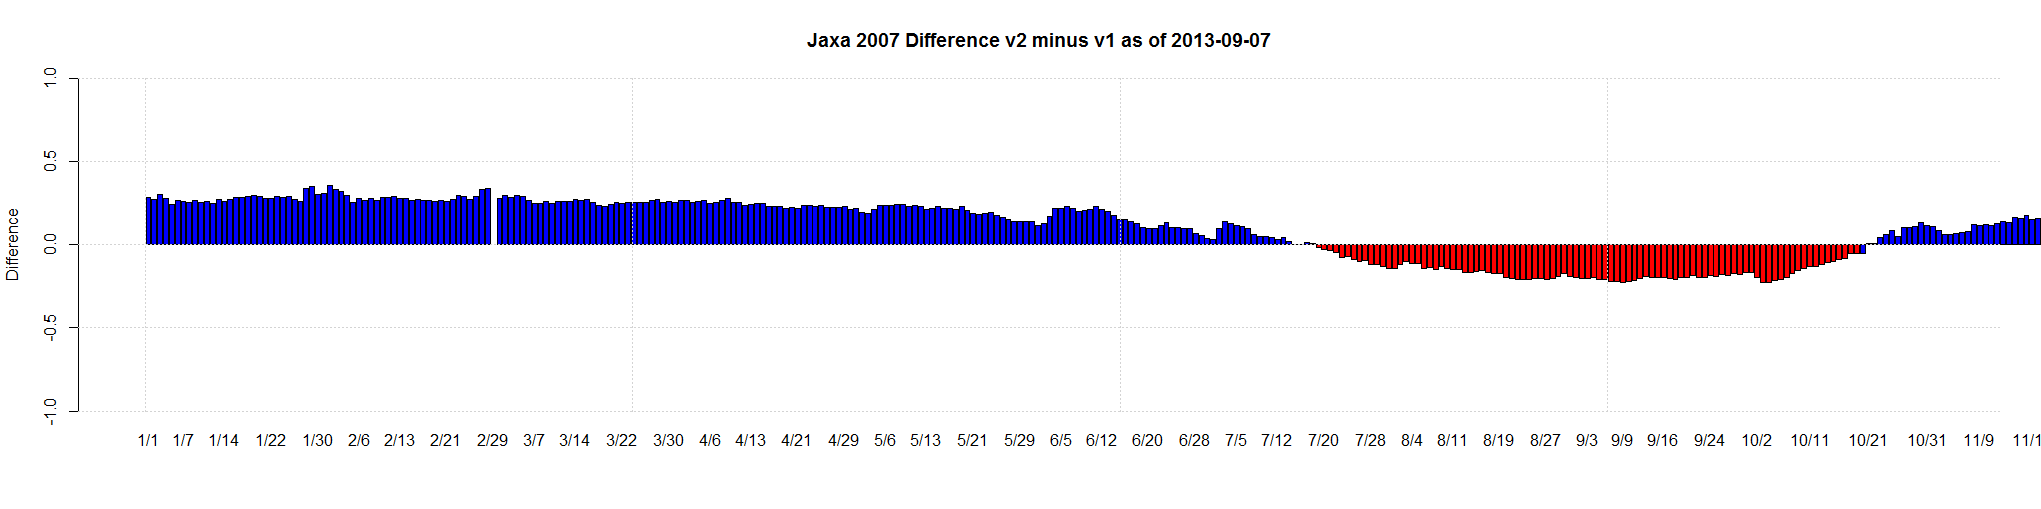
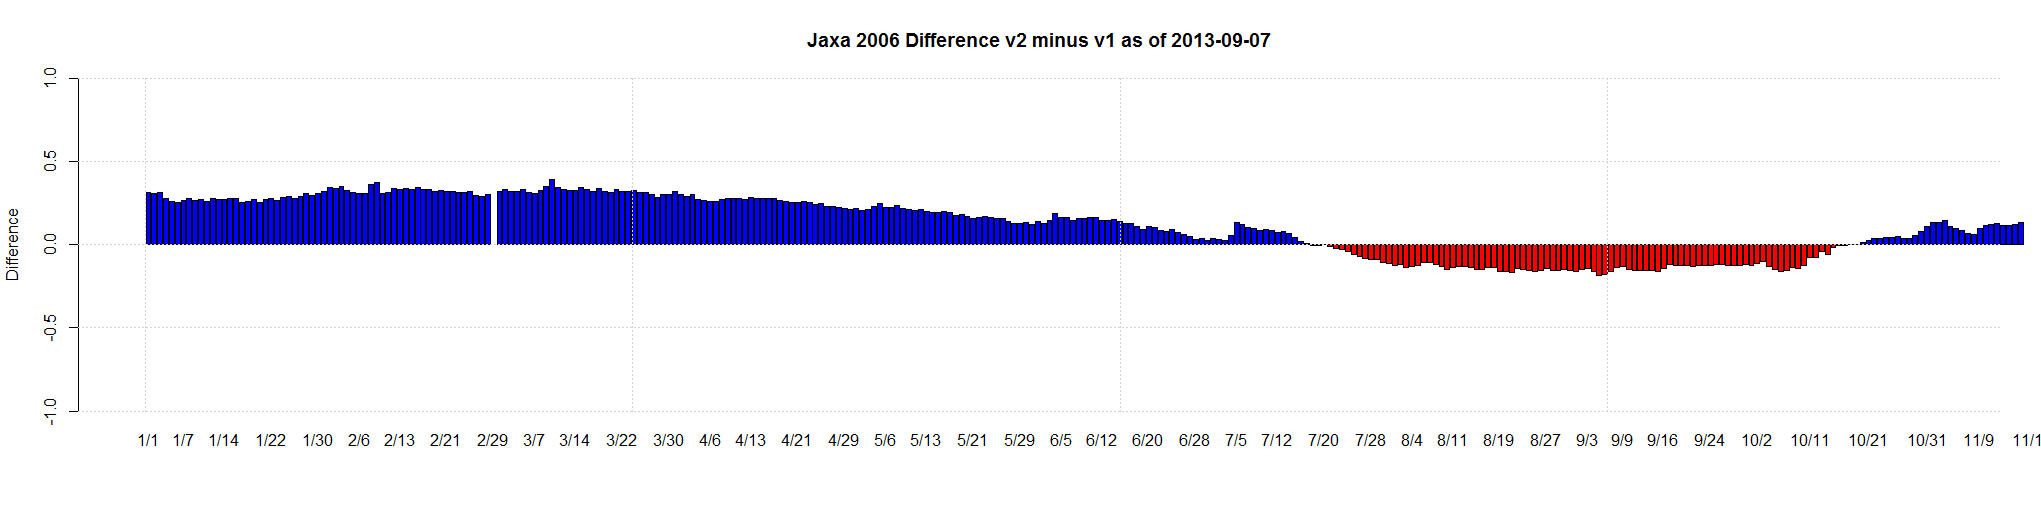
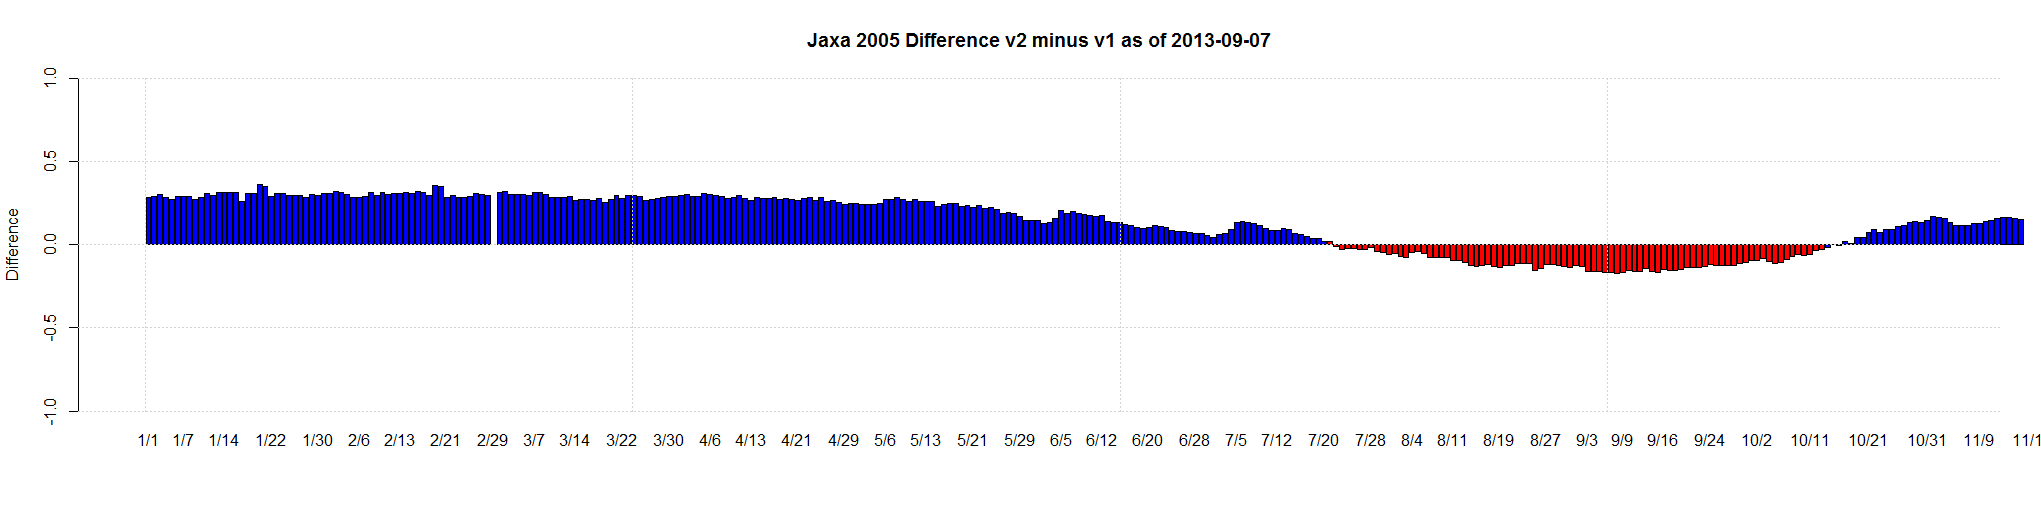
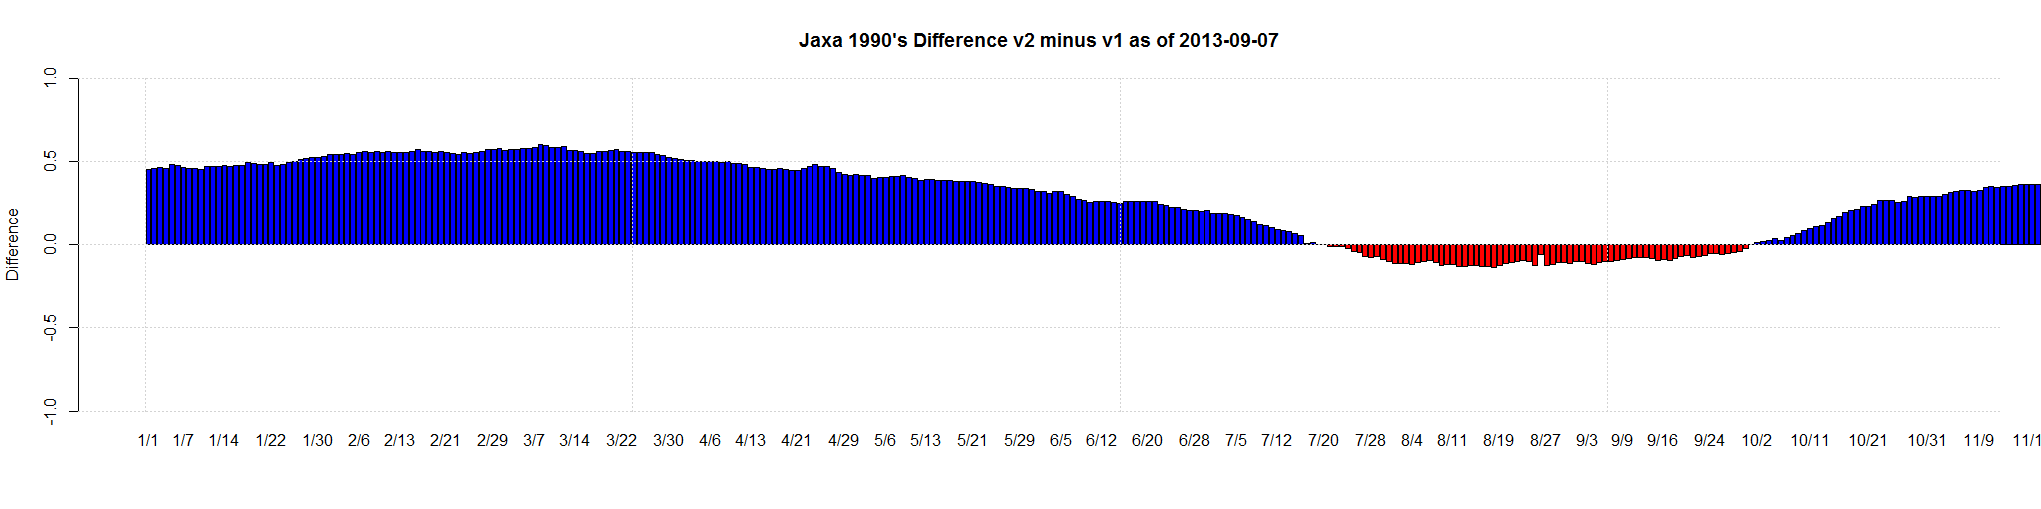
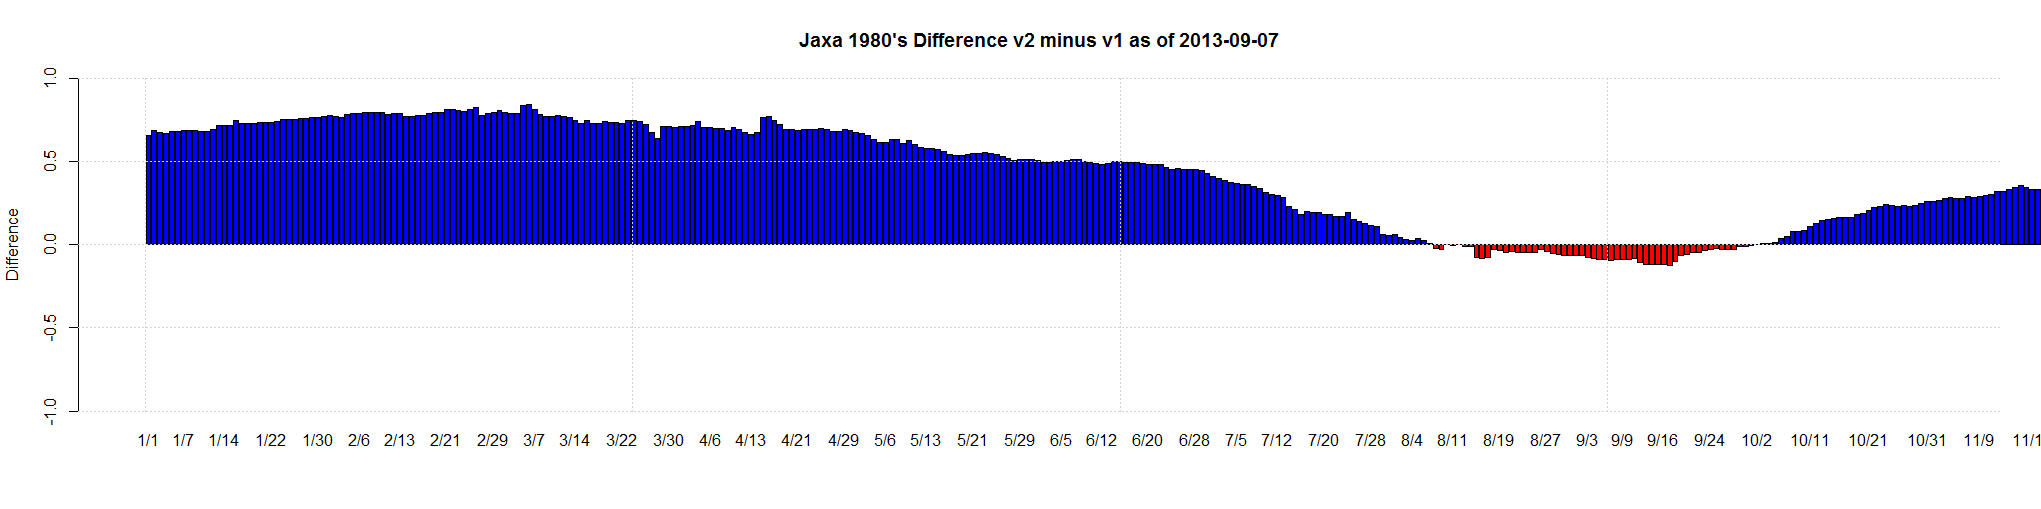
Yesterday I posted all the JAXA V2 versus V1 graphs. I was in a rush and I didn’t set the axis to be identical.
Here are the fixed graphs: