I’ve never seen Arctic Sea Ice go up 40,000 sq km in June before.
I’ve never seen Arctic Sea Ice go up 40,000 sq km in June before.
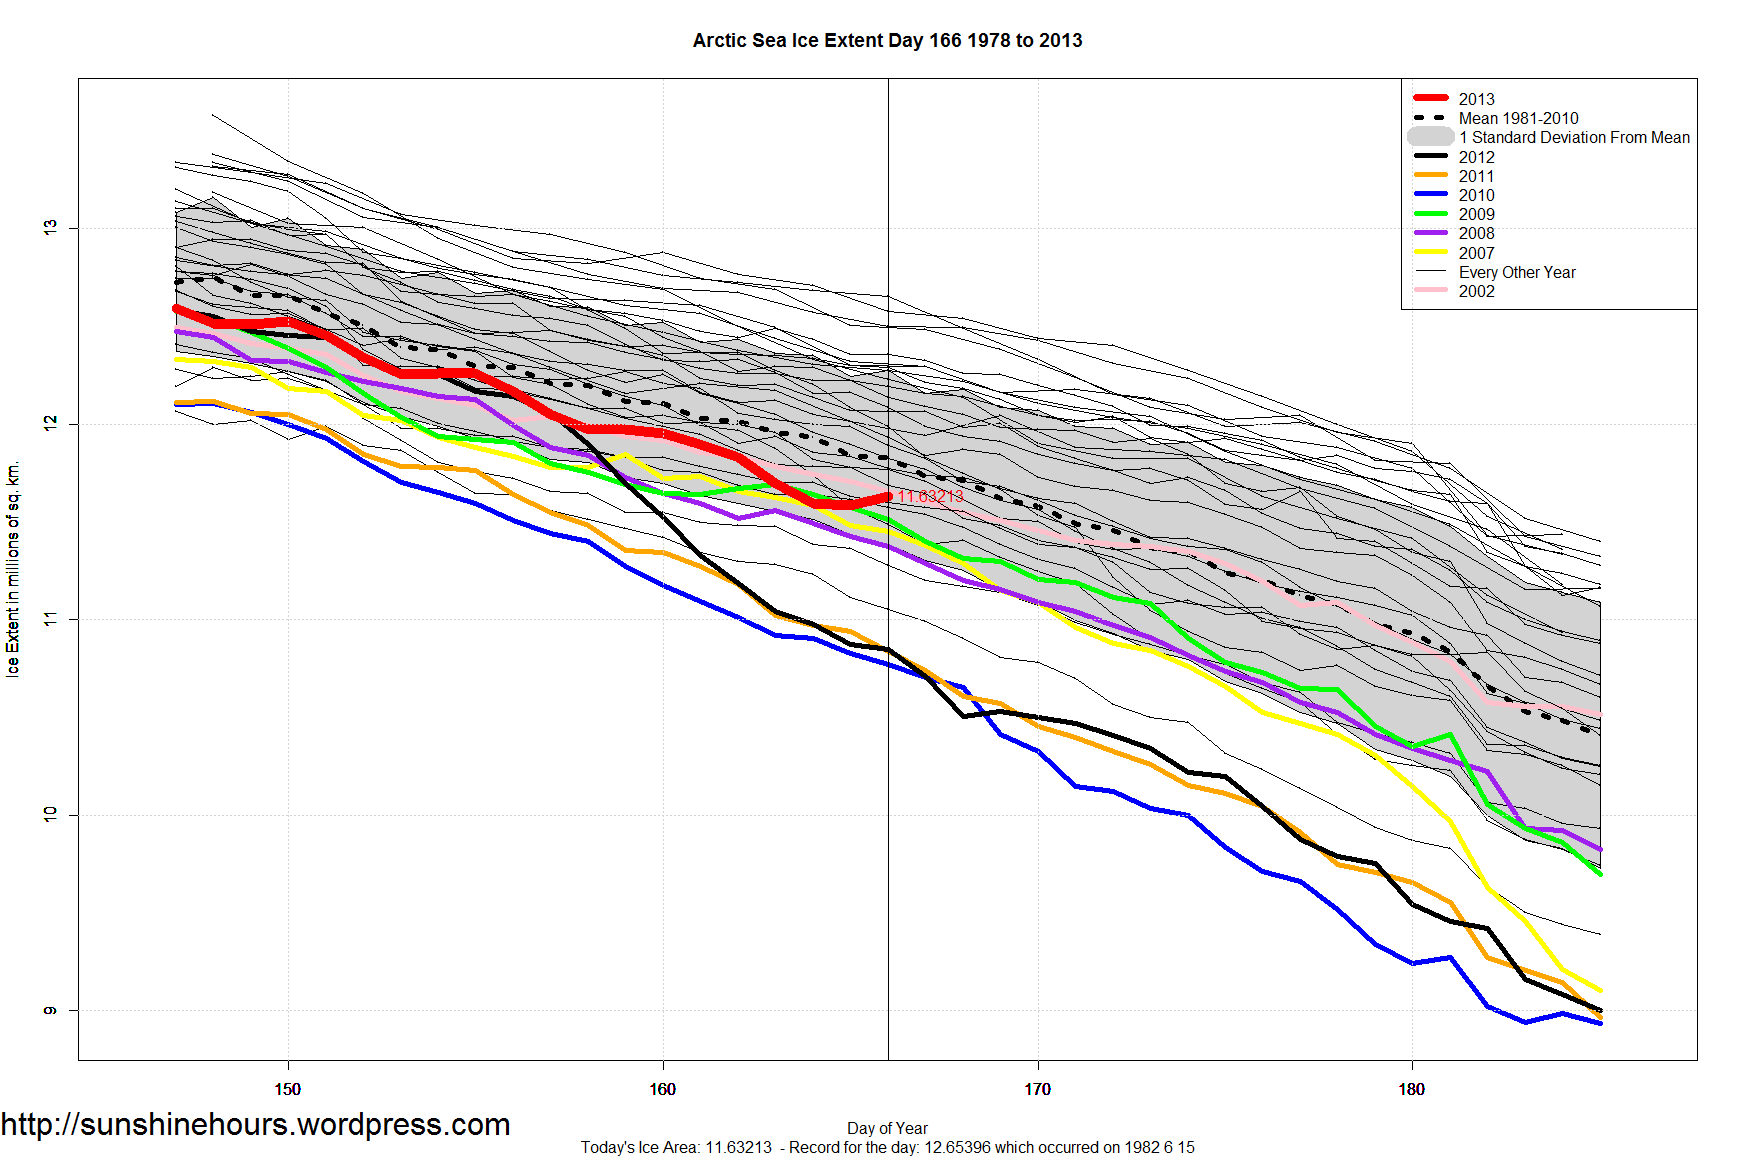
Arctic Sea Ice Extent 800,000 sq km Higher Than 2010 and Only 130,000 sq km Below Average
Red Line is 2013. Blue Line is 2010 which had the lowest sea ice for this day
The Arctic Sea Ice Extent stubbornly is refusing to die in the alleged “Death Spiral”.

Taking the mean of Arctic Sea Ice Extent for May (from 2004) results in a graph that goes up up up (admittedly in small jumps).
Dashed line is linear trend. Green line is loess trend. (NSIDC data here)

Arctic Sea Ice is 0.83% below the 1981-2010 Mean
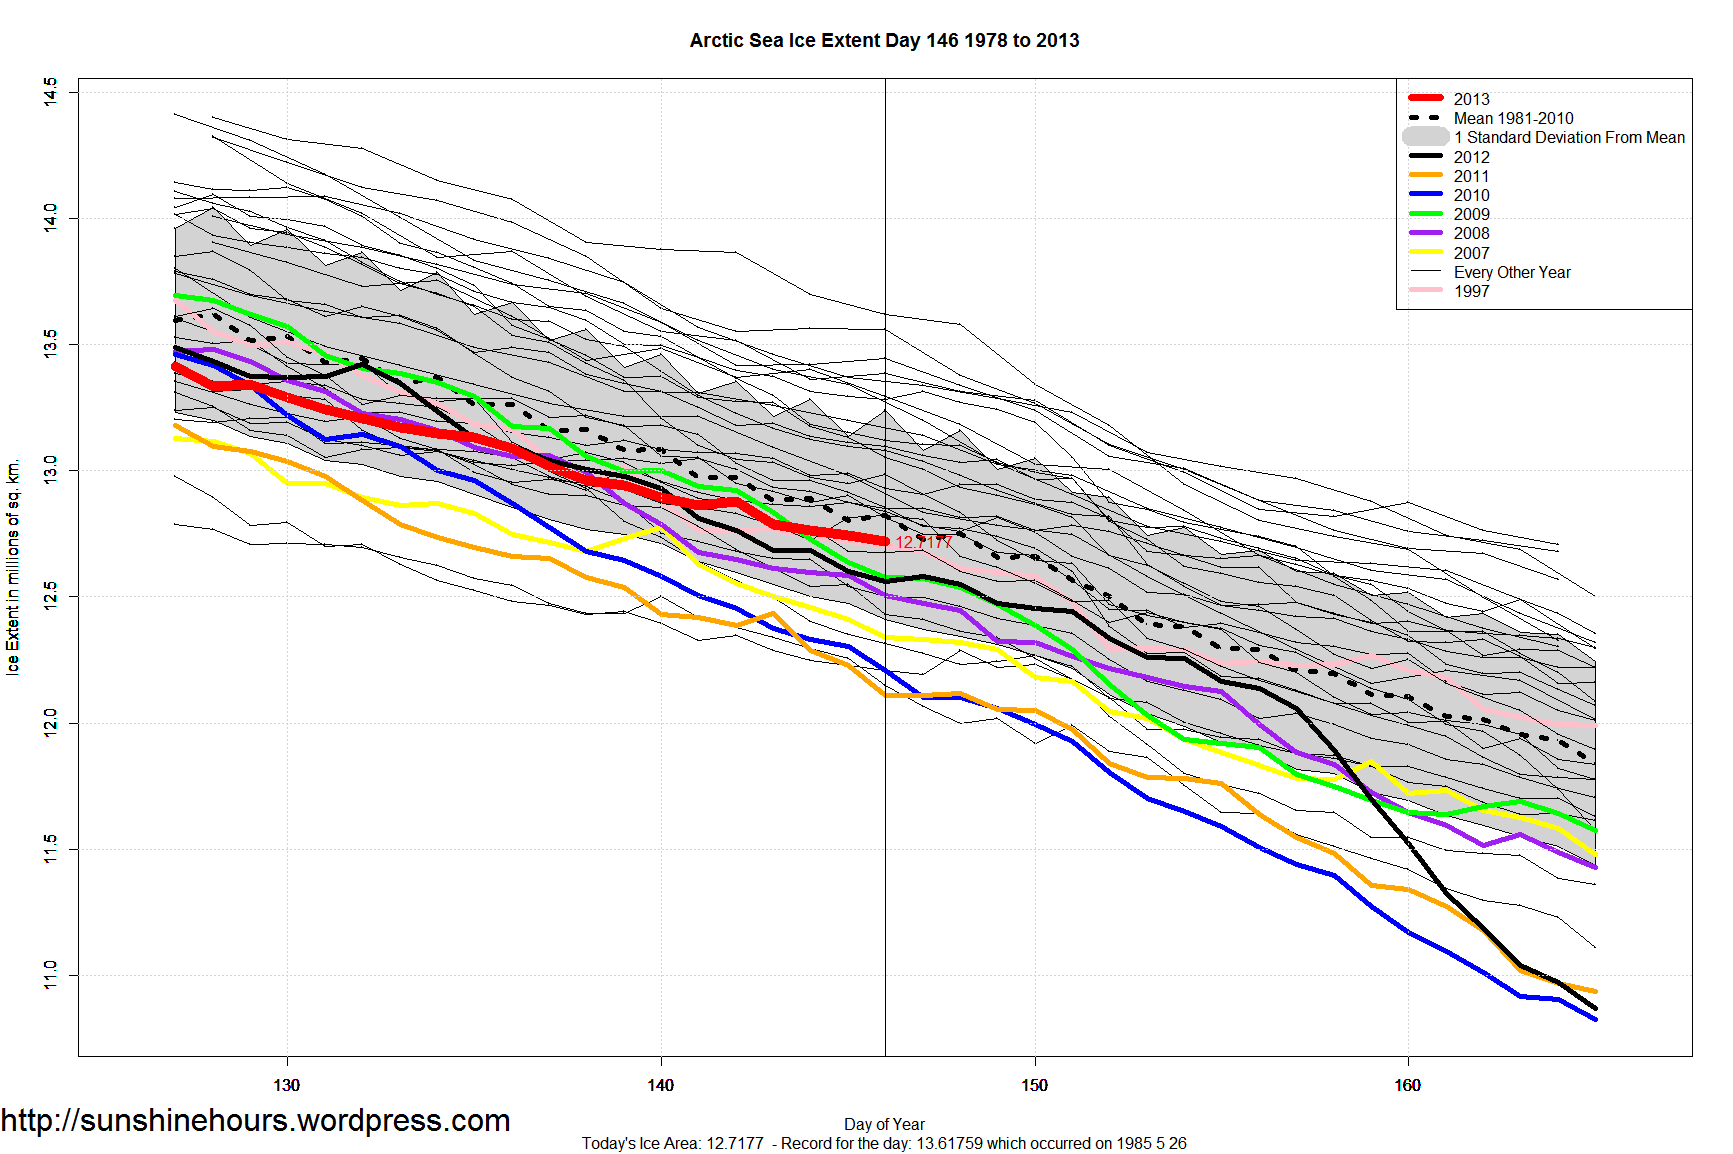
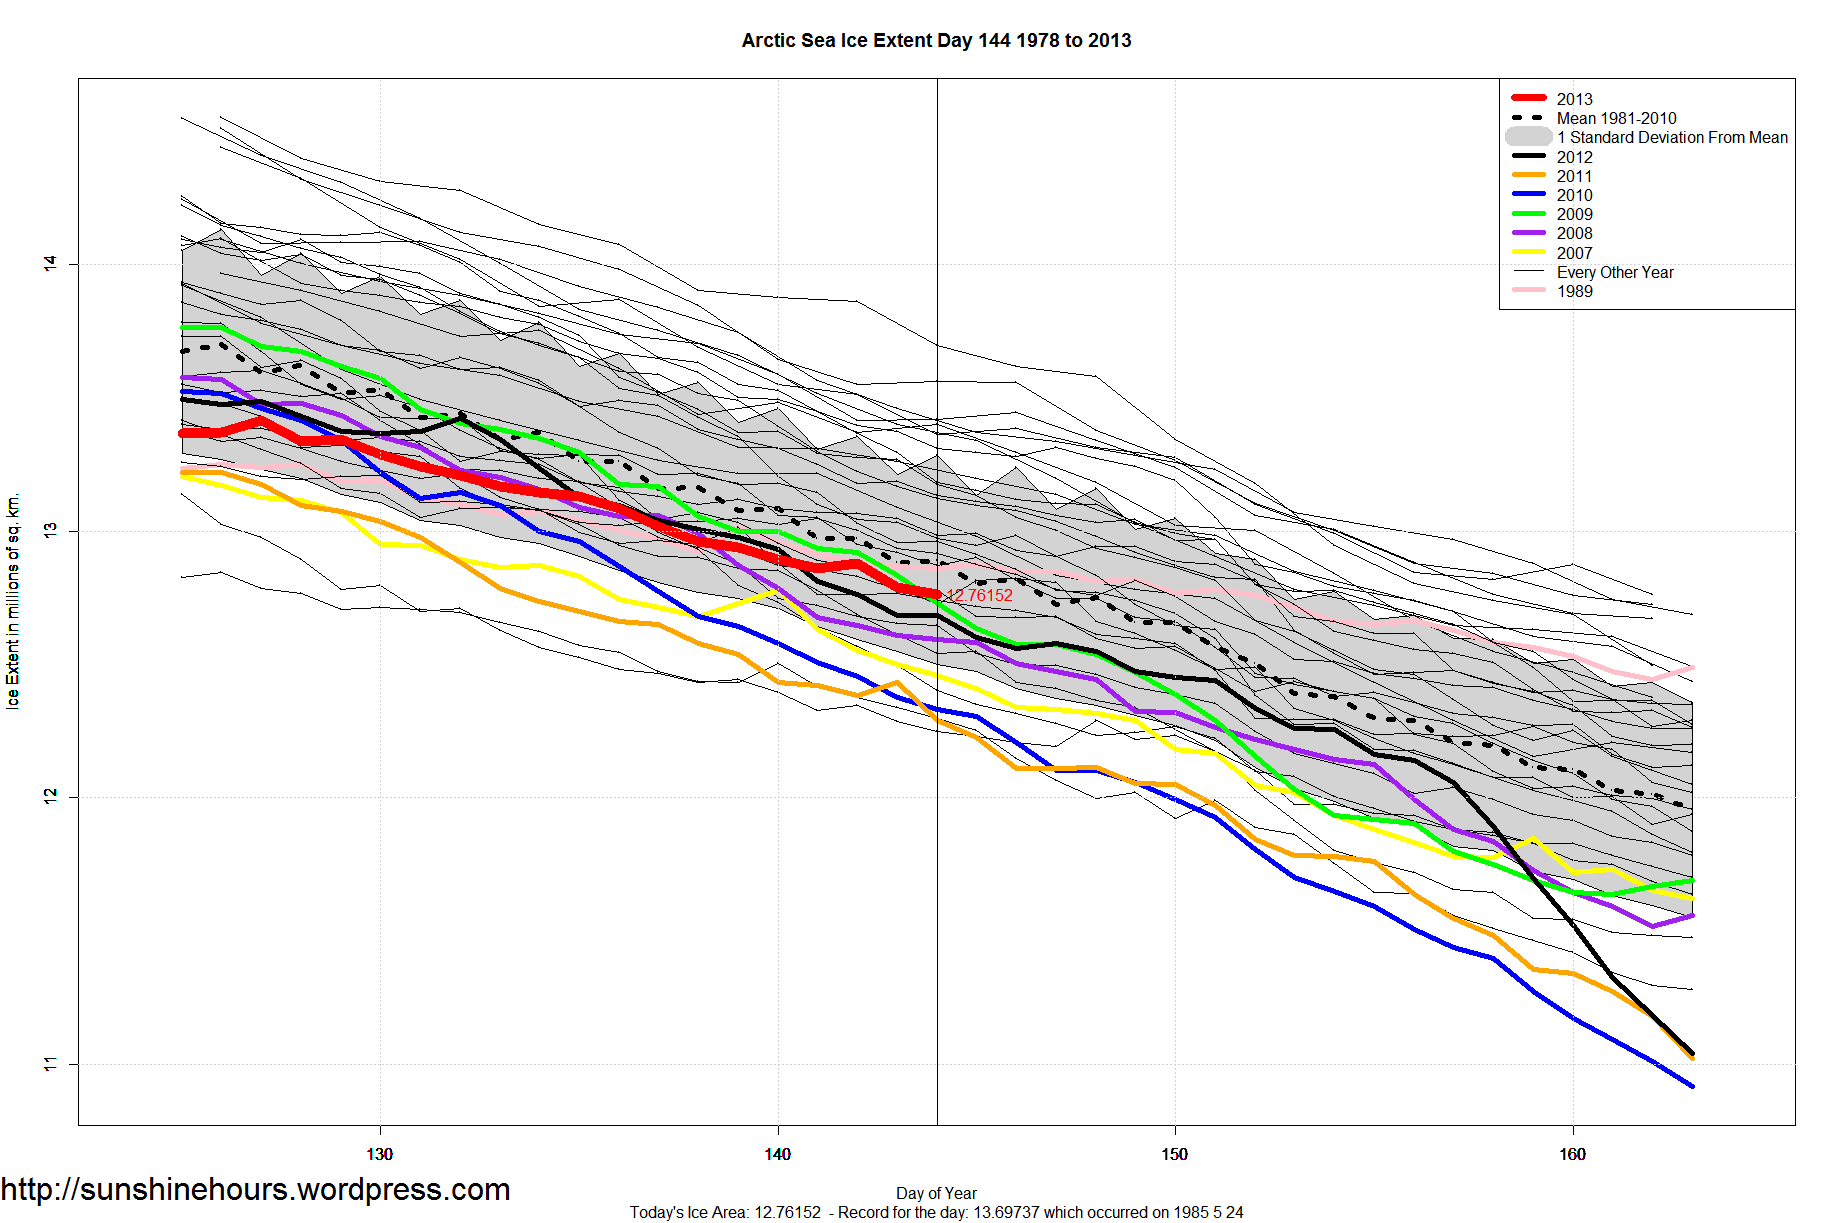
If someone claims Arctic Sea Ice is in a death spiral, you can mention that right now (Day 144 – May 24th) 2013 has the 14th smallest amount of sea ice and not the lowest.
13 Years With Less Arctic Sea Ice on Day 144: 2004, 2011, 2006, 2010, 1995, 2007, 2005, 2008, 2002, 2012, 2000, 2009, 1997
Arctic Sea Ice Extent is 13.09 million sq km on day 136.
Which makes it 170,000 sq km below the average (13.26 million sq km) for the day.
Which means it is a minuscule 1.3% below average.
12 other years on this day had less ice: 2004, 2006, 2011, 2007, 2010, 2005, 2003, 1989, 1996, 2002, 2008, 1995
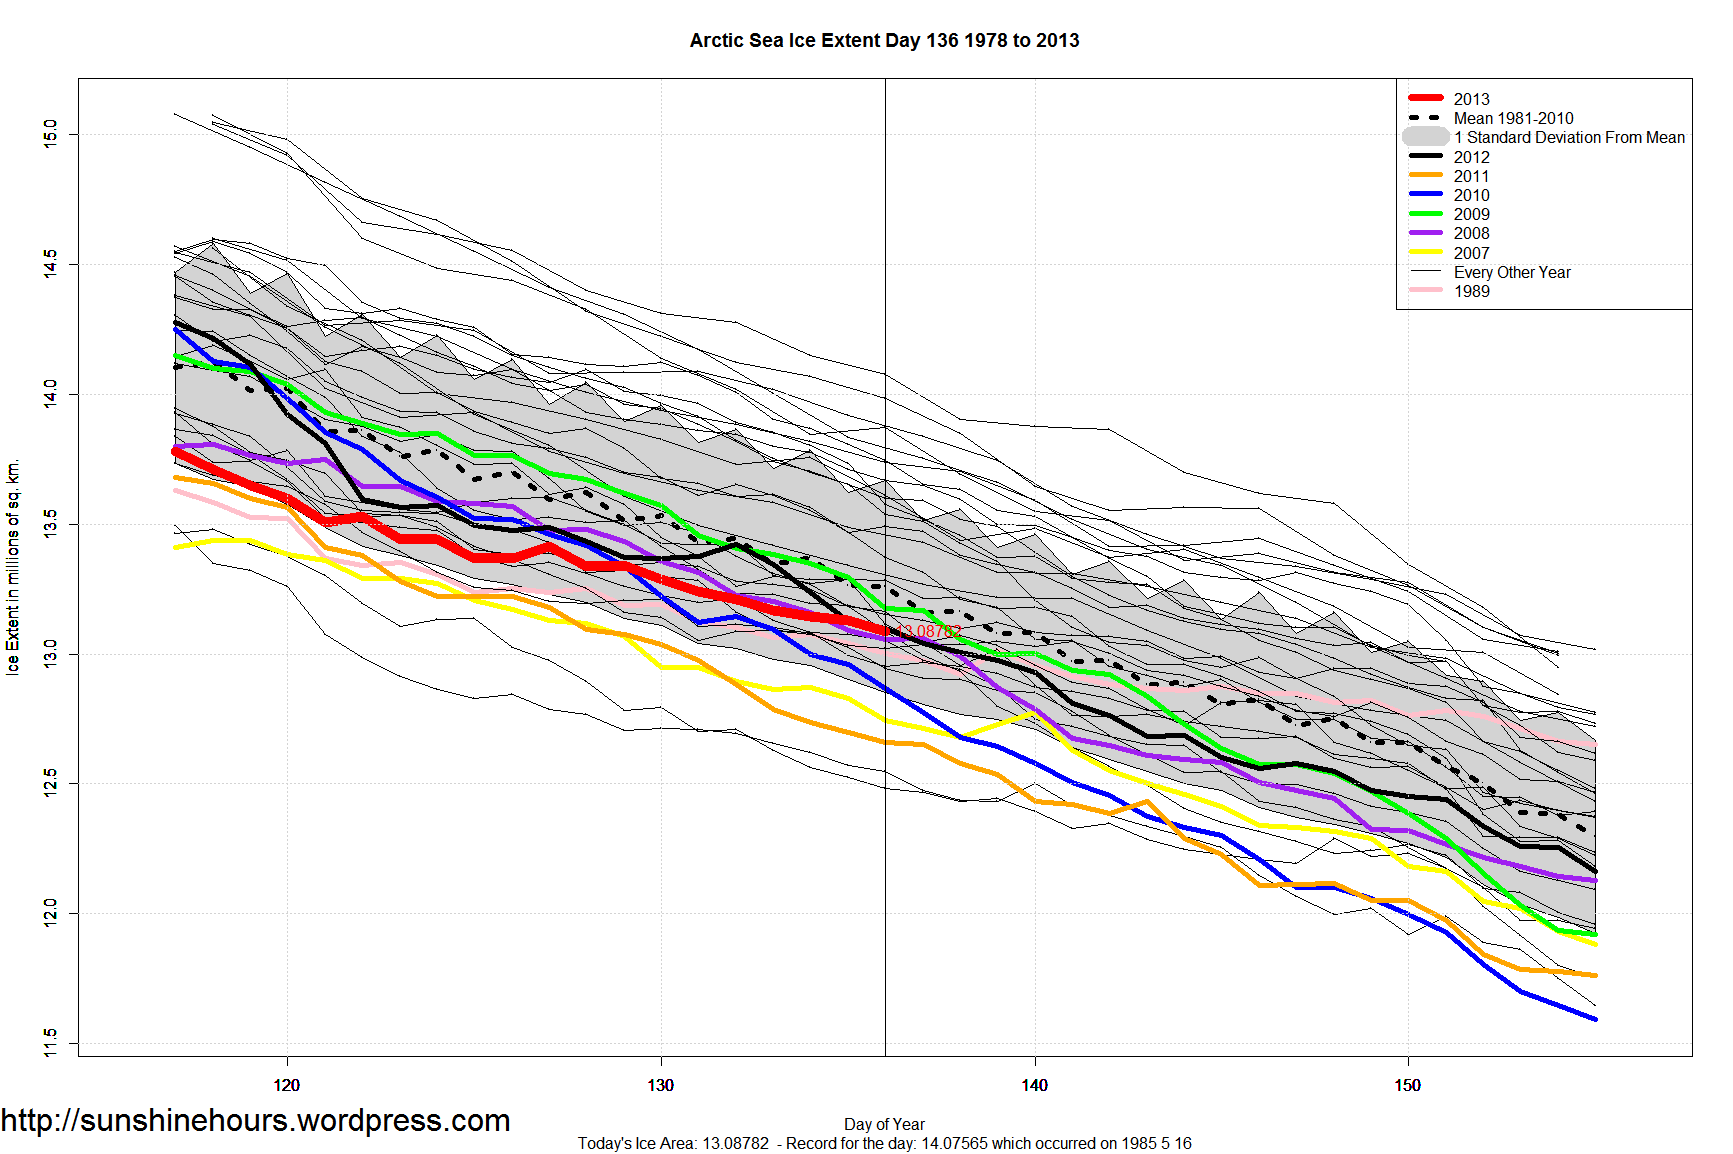
What a strange death spiral for Arctic Sea Ice.
There are 11 years with less ice at this day in the year: 2006, 2004, 2007, 2011, 2003, 1989, 2005, 2002, 1996, 2010 and 1995.
Click for bigger.
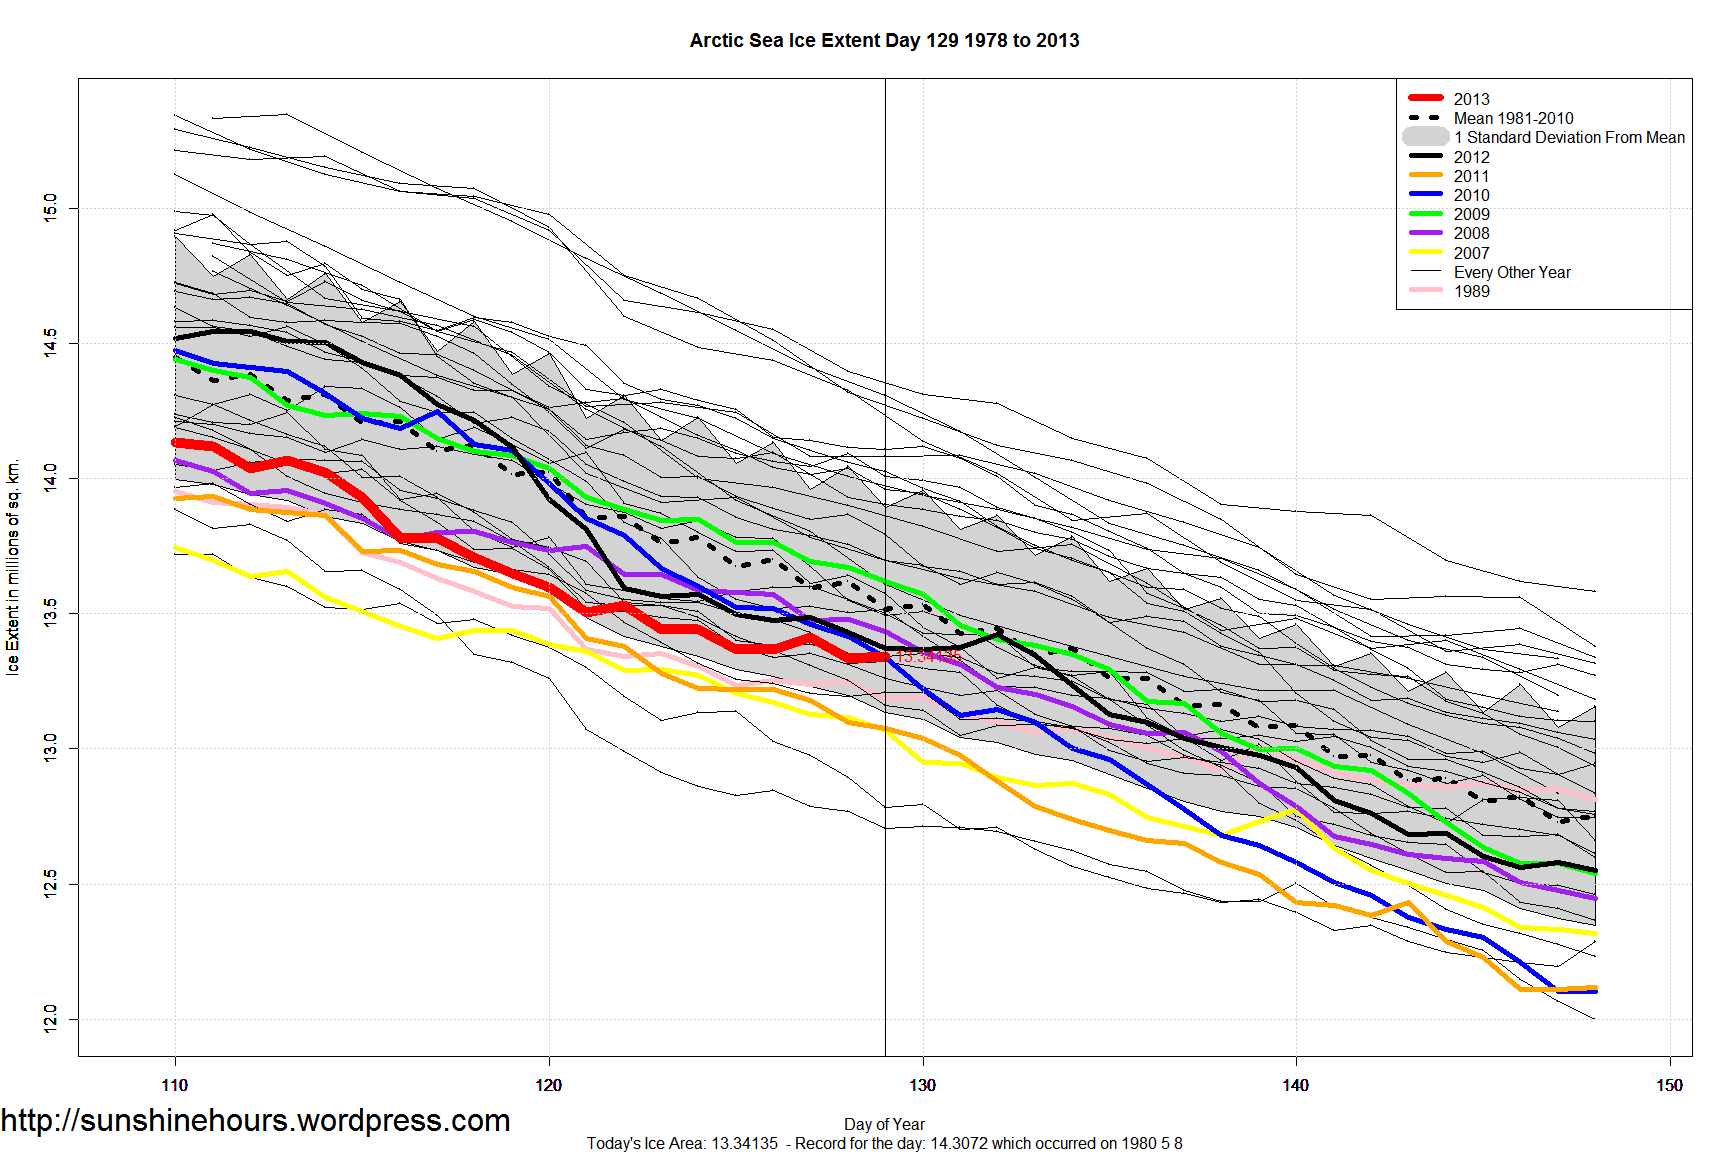
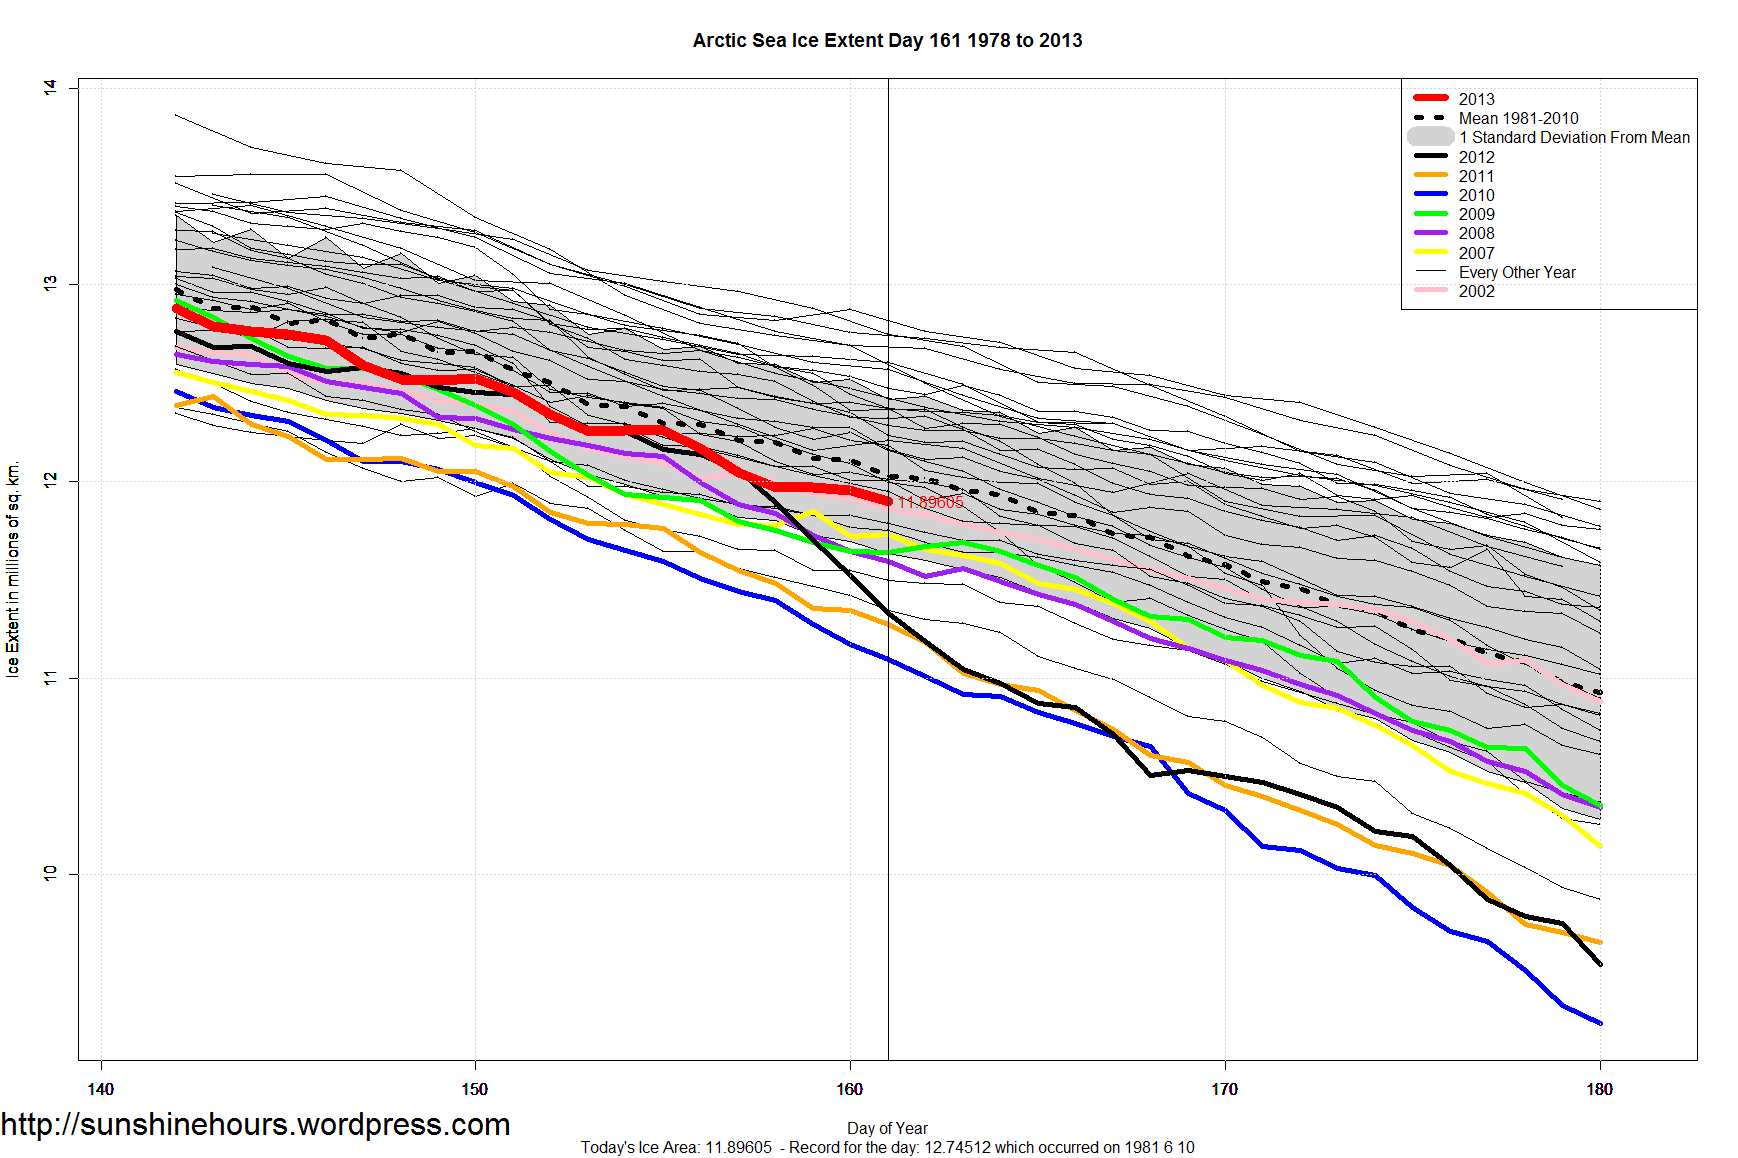
If someone claims Arctic Sea Ice is in a death spiral, you can mention that right now 2013 is the 7th lowest and not the lowest.
And that 2013 has even more ice than 1989 at this point in the year.
Lowest 7 = 2006 2004 2011 2007 1989 2005 2013
And that Extent is within one standard deviation of the 1981 – 2010 mean. And only 340,000 sq km below the mean which is about 2.5%.

I saw the following article at the NSIDC site about the trend for April Sea Ice Extent in the Arctic.

And I wondered what it would look like if I just graphed the last 10 years. And I thought … looking ok.

And then I though … how about the last 20 years with a loess curve? Don’t you think the NSIDC articles words are misleading?

