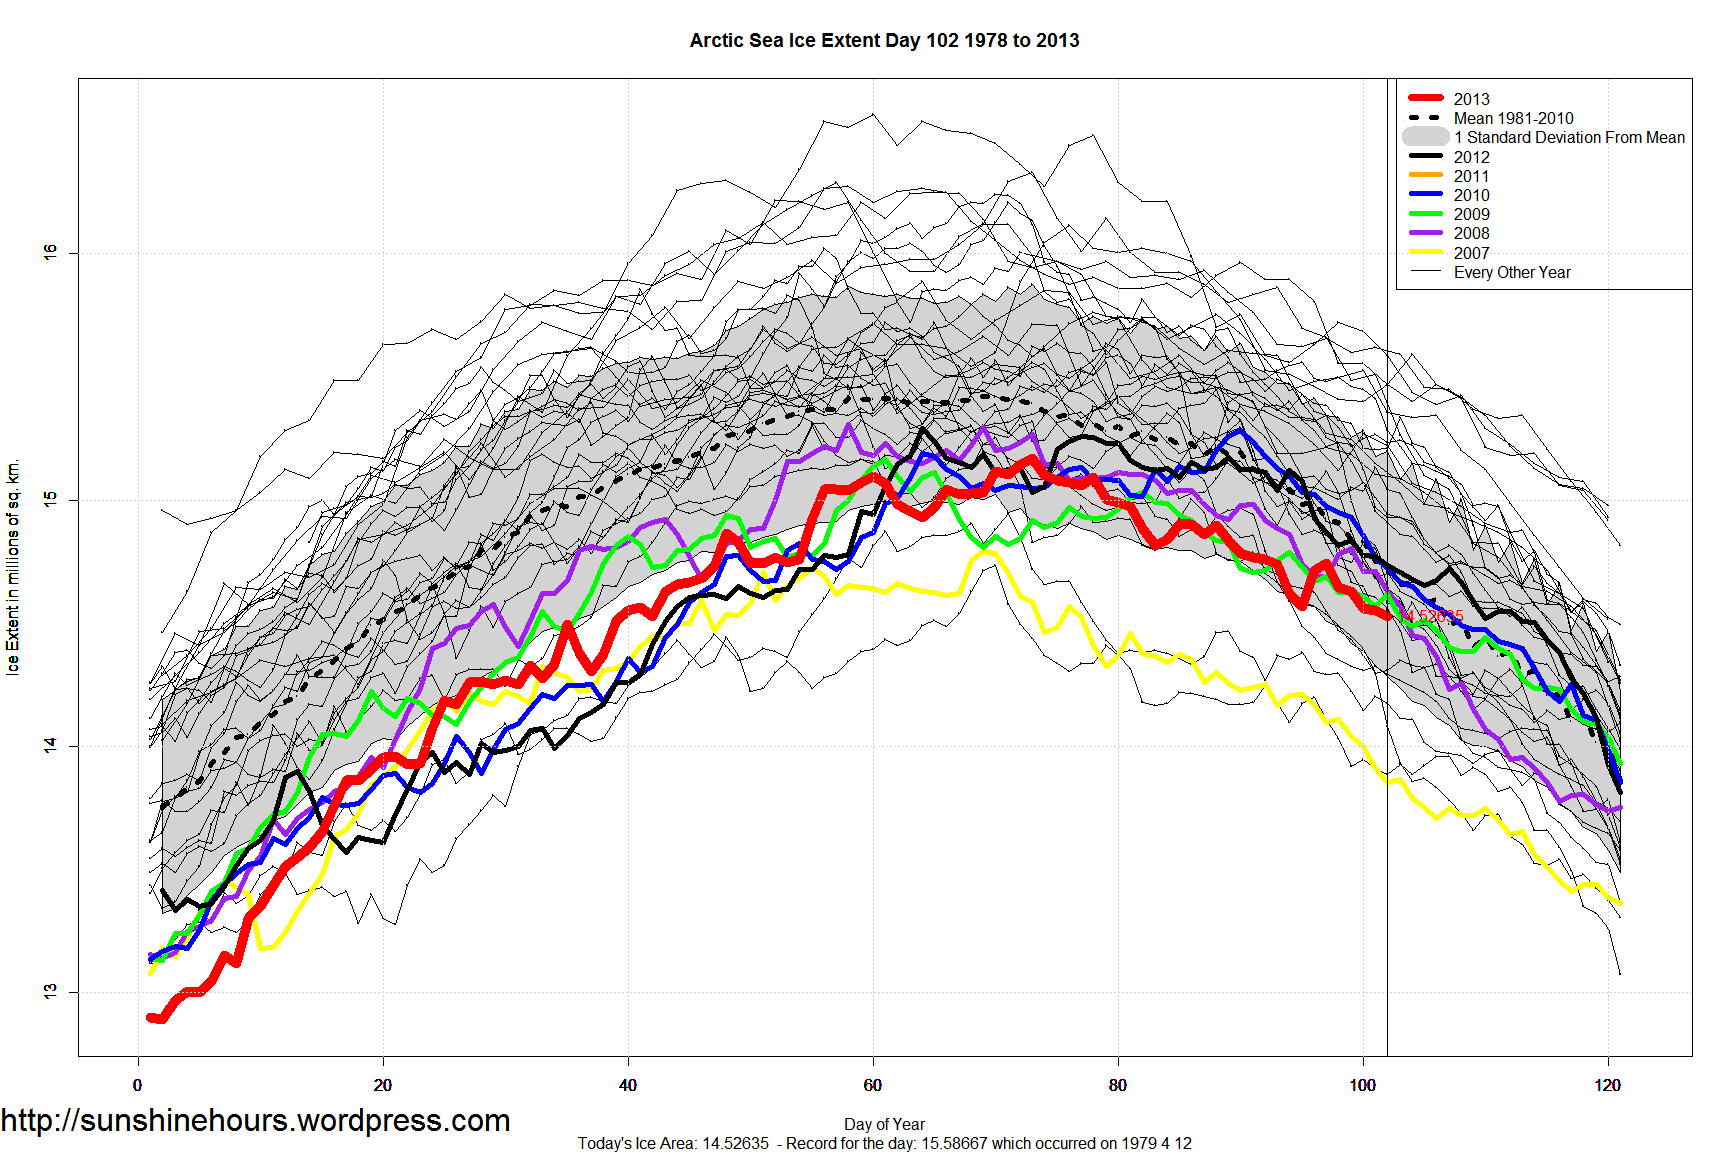
Arctic Sea is running about 3% below the 1981-2010 Mean.
But it is the 7th lowest as of this day of the year.
But did you know it was lower in 1989?
You can check for yourself on the Cryosphere Today Interactive Chart.

Arctic Sea is running about 3% below the 1981-2010 Mean.
But it is the 7th lowest as of this day of the year.
But did you know it was lower in 1989?
You can check for yourself on the Cryosphere Today Interactive Chart.
Arctic Sea Ice Extent 2013 is only 4th lowest so far using the mean up to this day in each year.
And the anomaly is half the 2006 anomaly.
We are saved!
| Year | Anomaly (sq km) |
| 2006 | -916,781 |
| 2005 | -744,955 |
| 2007 | -743,831 |
| 2013 | -484,217 |
| 2010 | -446,517 |
| 2012 | -445,151 |
| 2009 | -401,894 |
| 2004 | -347,932 |
| 2008 | -307,371 |
| 1996 | -212,097 |
| 2000 | -121,103 |
| 2002 | -54,227 |
| 2001 | -16,150 |
| 2003 | 14,480 |
| 1995 | 17,785 |
| 1991 | 52,640 |
| 1999 | 66,556 |
| 1997 | 96,180 |
| 1984 | 139,216 |
| 1992 | 184,595 |
| 1989 | 256,508 |
| 1994 | 271,011 |
| 1998 | 344,667 |
| 1981 | 375,843 |
| 1985 | 380,320 |
| 1990 | 399,046 |
| 1993 | 467,706 |
| 1988 | 479,840 |
| 1986 | 513,926 |
| 1987 | 598,476 |
| 1980 | 644,064 |
| 1983 | 693,561 |
| 1982 | 744,653 |
| 1979 | 950,301 |
(daily data from here)
Did you know that the Arctic Sea Ice Extent is only 1.4% lower than the 1981 – 2010 mean?
NSIDC data says that on March 19 (day 78) Arctic Sea Ice Extent was 15.09 million sq km. The mean for 1981-2010 for day 78 is 15.30 million sq km.
Wow. Only 1.4% below normal. Has that made the news?

Arctic Data from here.
A “team” of “University” of Washington “scientists” have beclowned themselves trying to claim the massive 2012 Arctic Cycle did not speed up the ice melt.
Their argument comes down to: “By September, most of the ice that melted would have melted with or without the cyclone.”
If you take two ice cubes and smash one into tiny pieces, which one melts first? The smashed one of course.
But the ice BESIDE the smashed ice would also melt quicker because the smashed ice would have provided support and cold/insulation if it had not been smashed.
For those of us old enough to remember fridge freezers that ice up and did not defrost themselves, we remember smashing as much ice with knives or screwdrivers to expose ice further back so it could melt sooner.
The UW team should be ashamed of themselves.
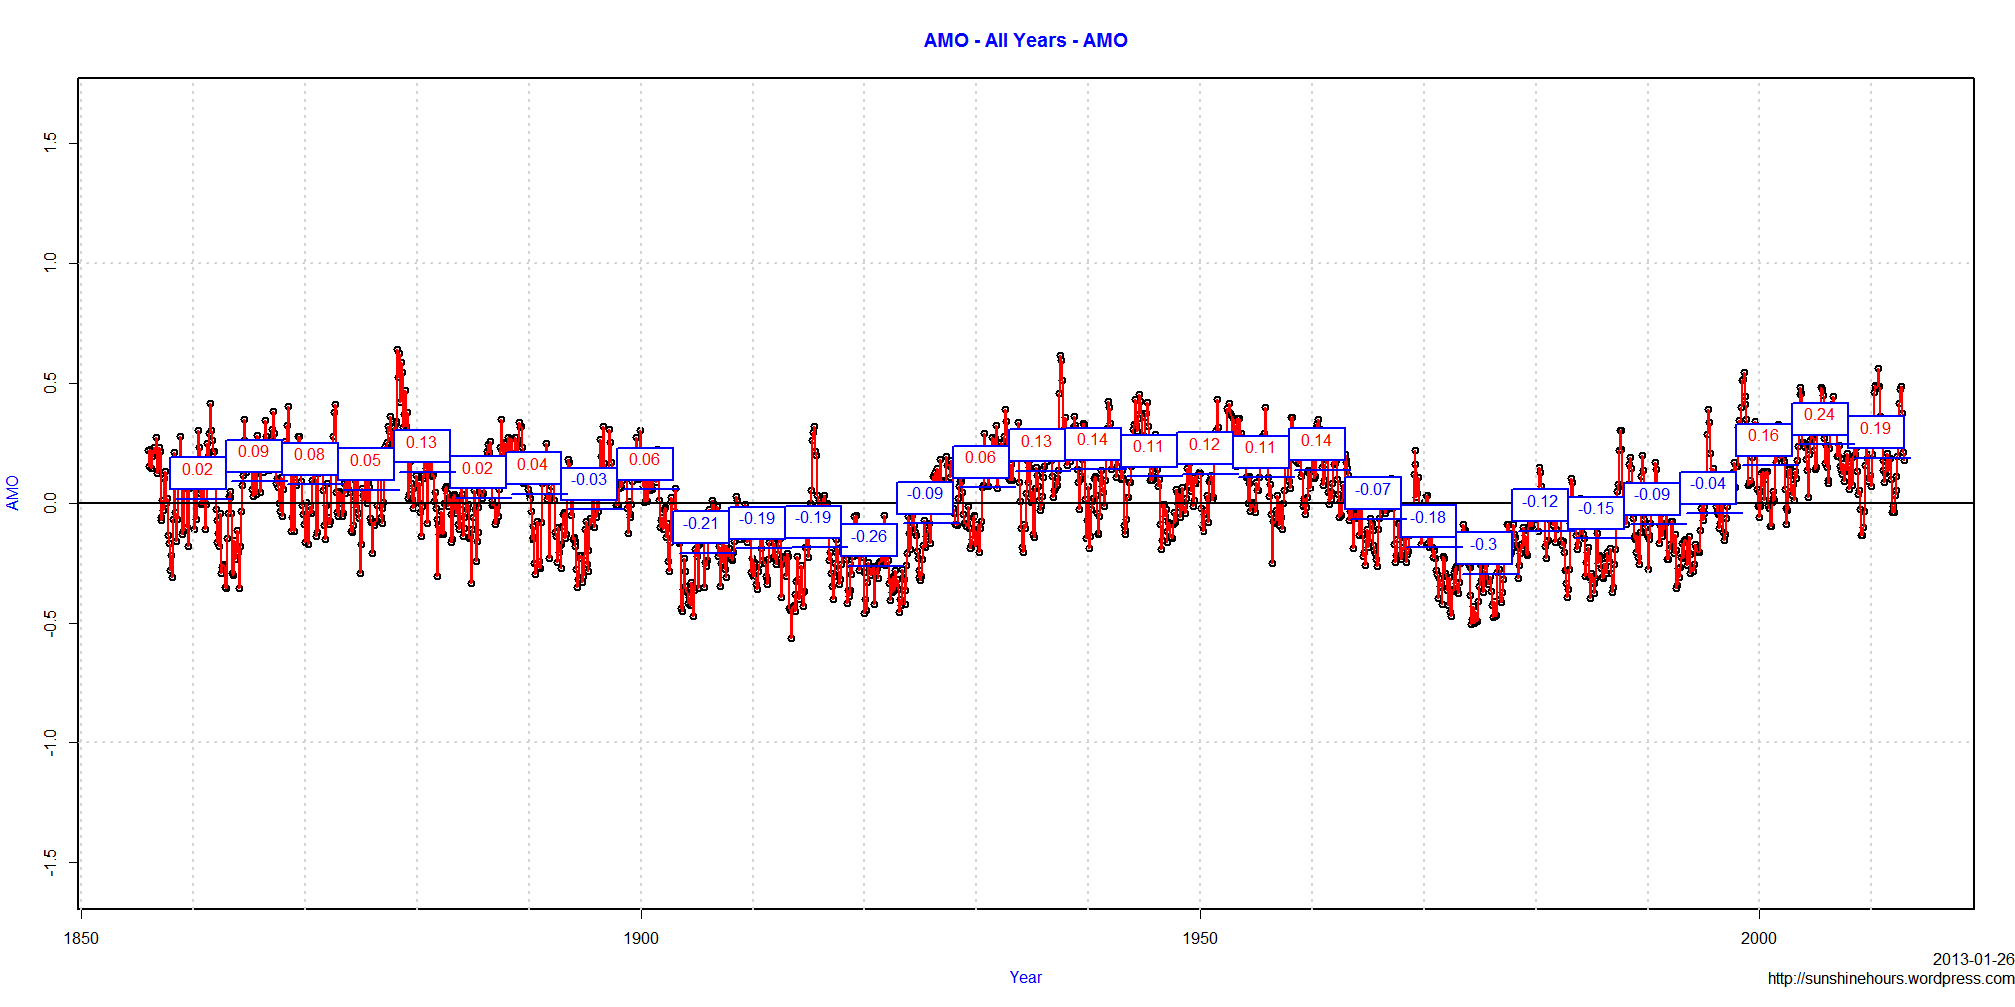
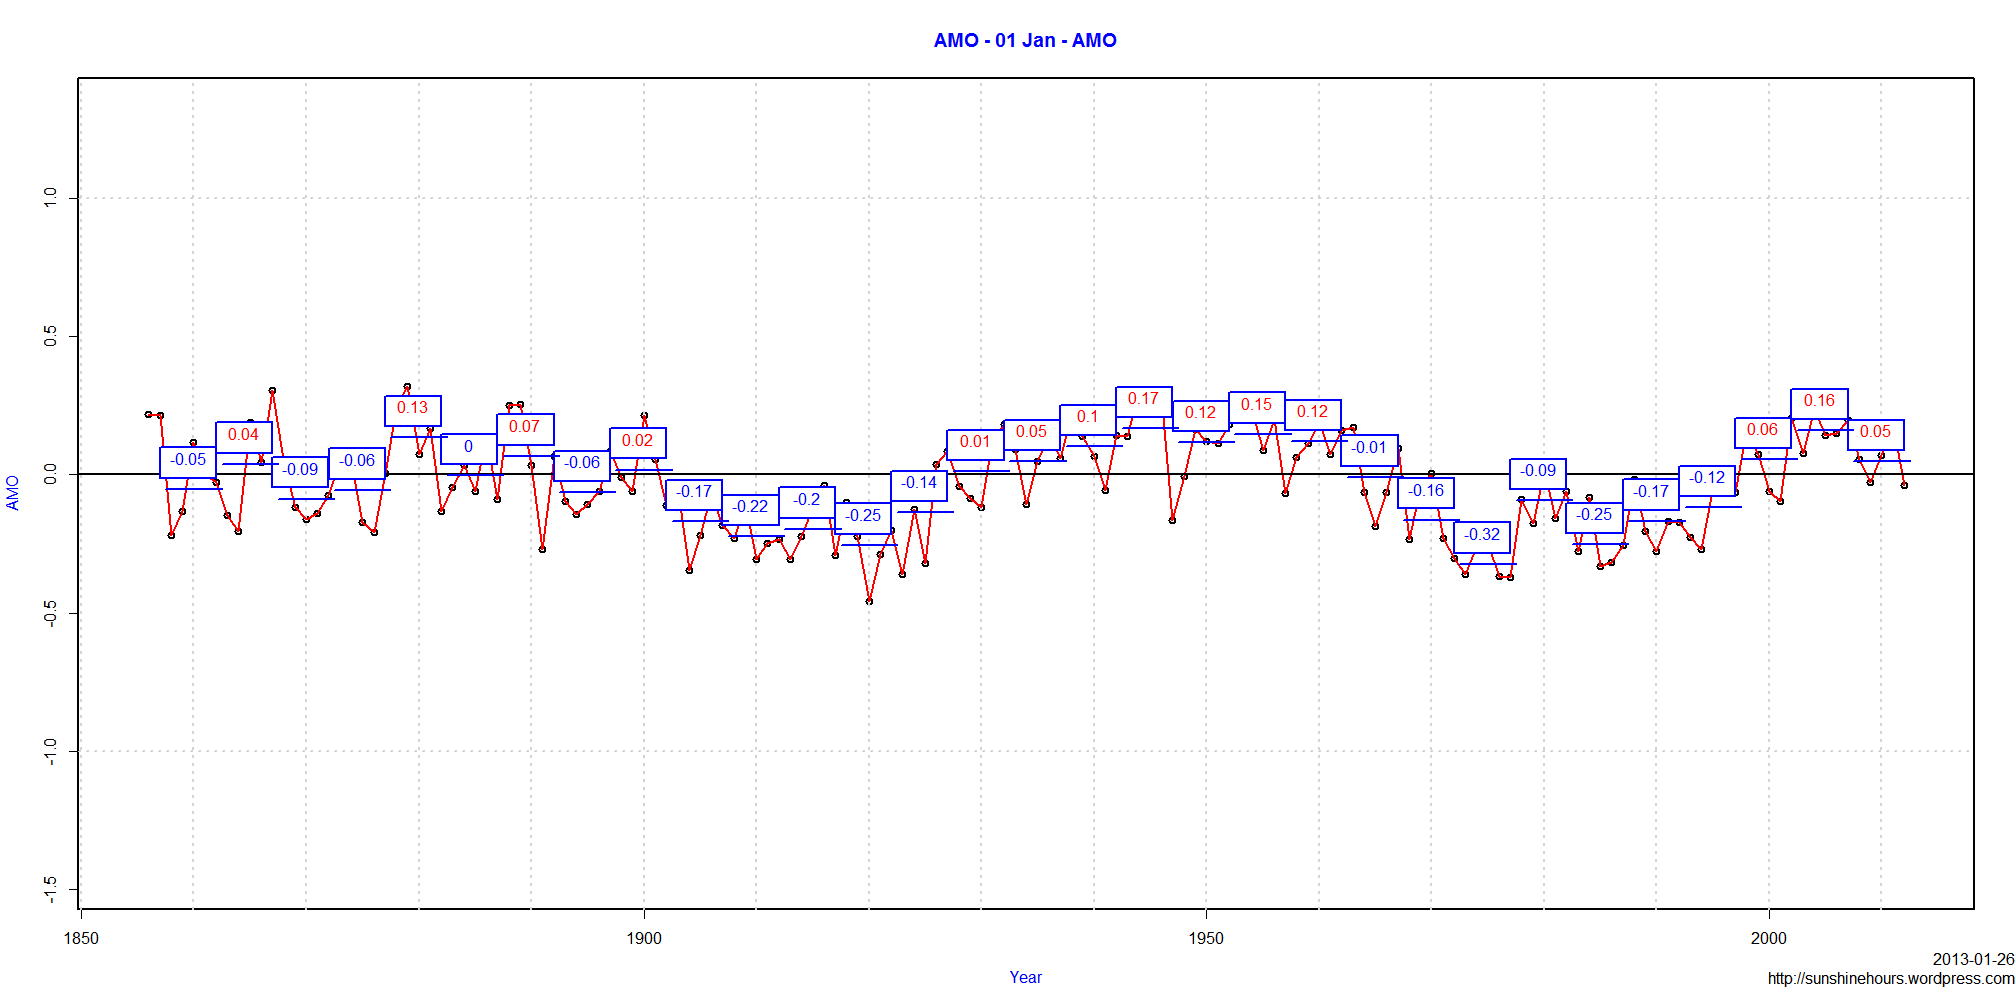
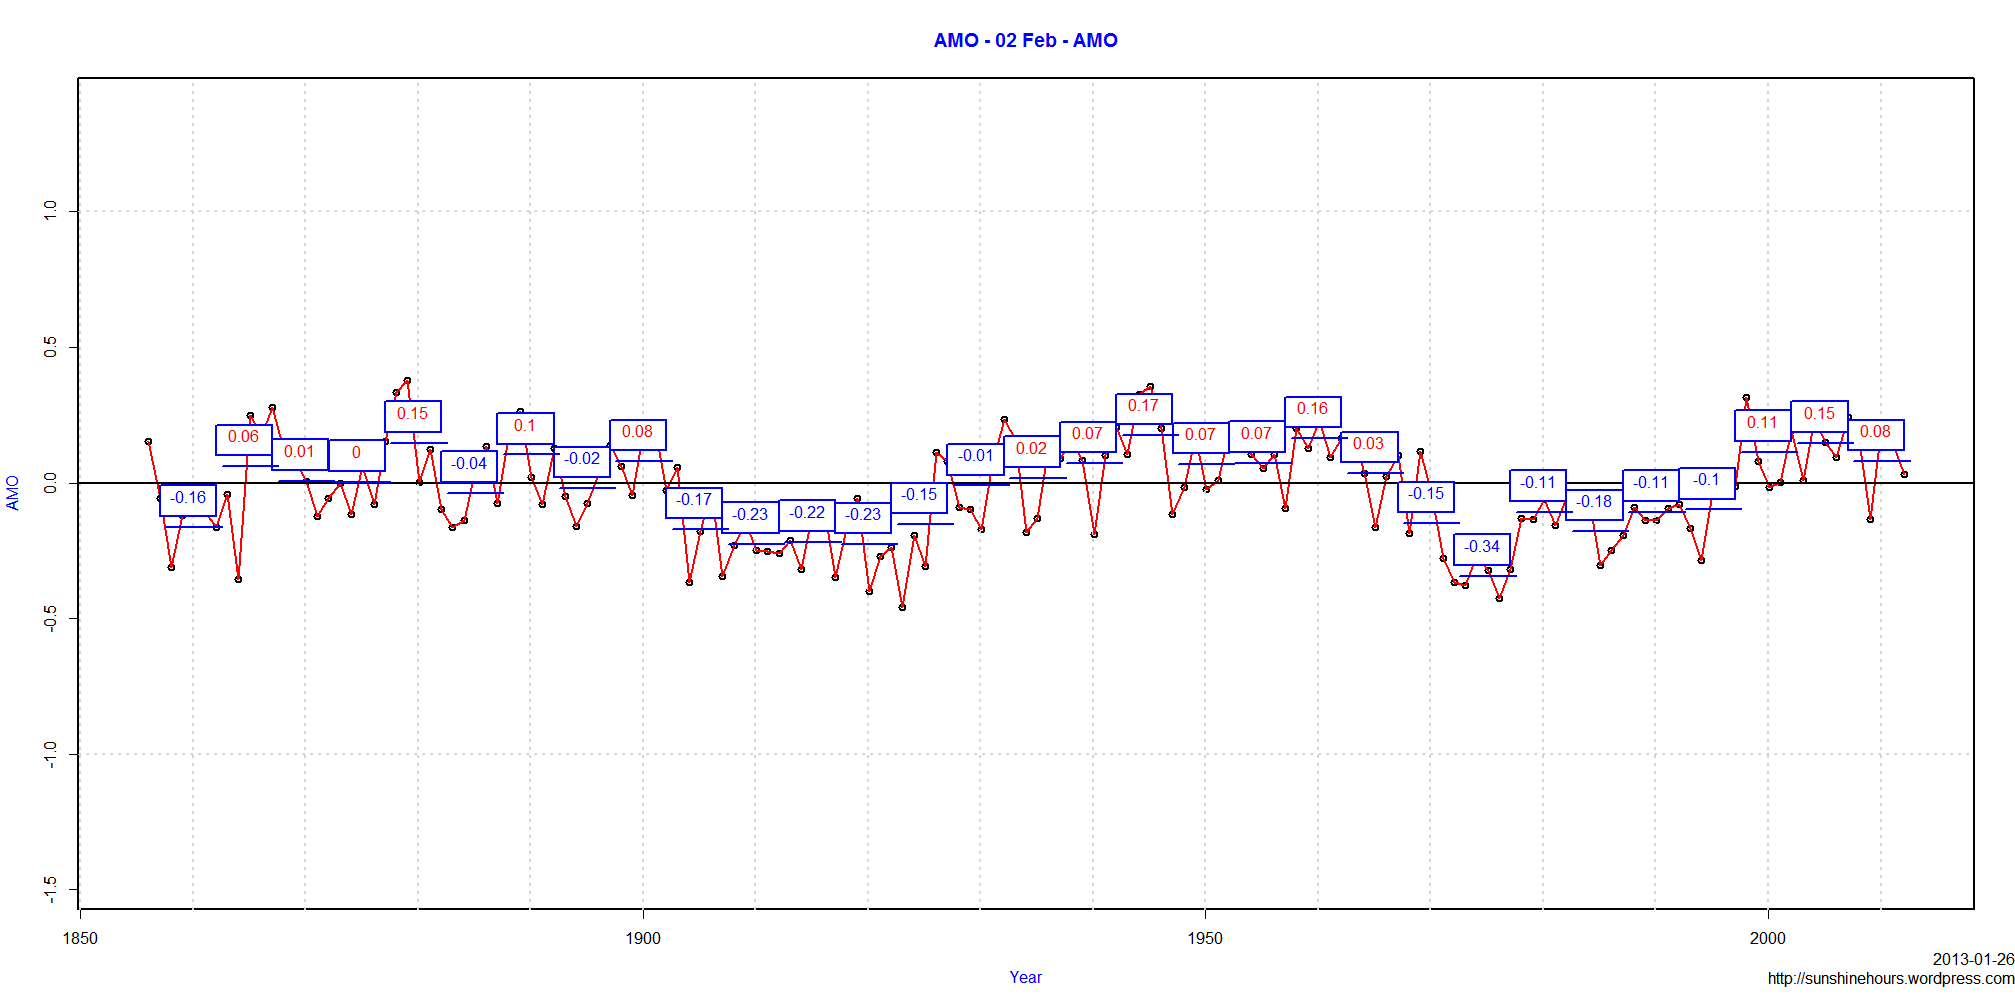
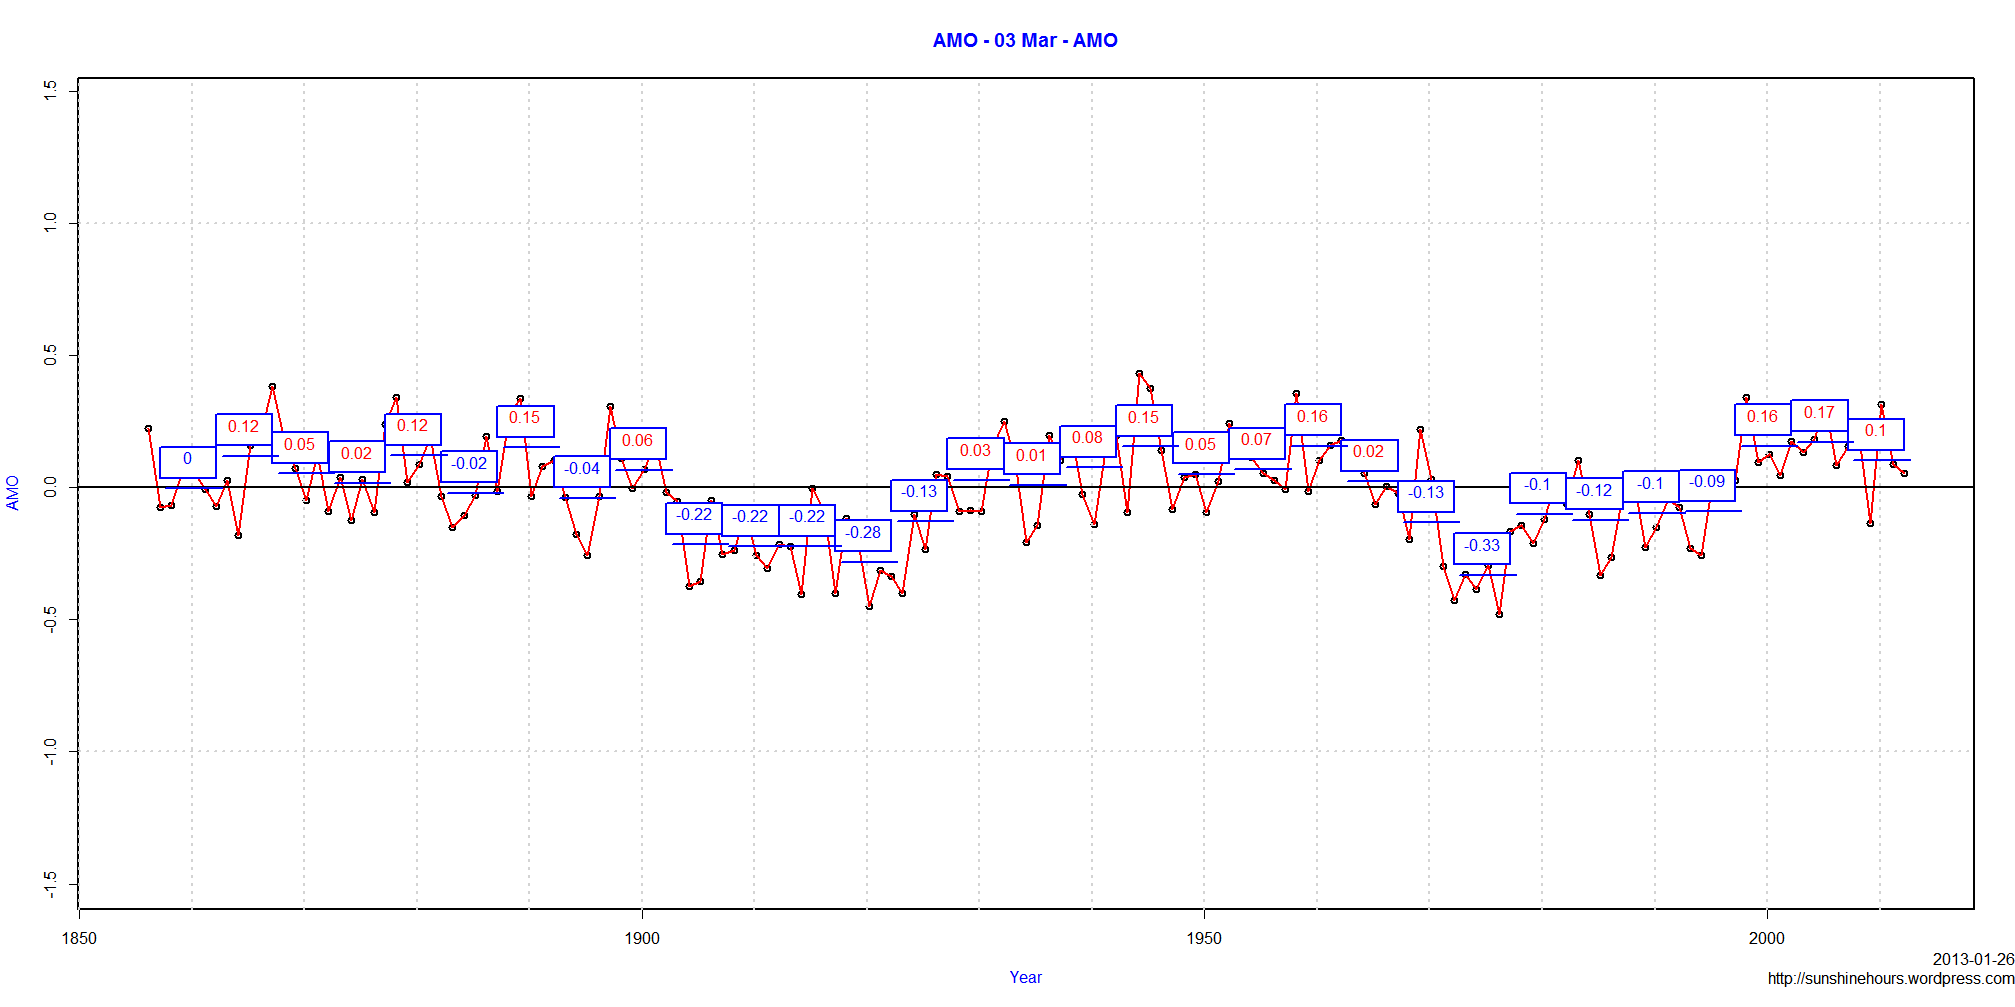
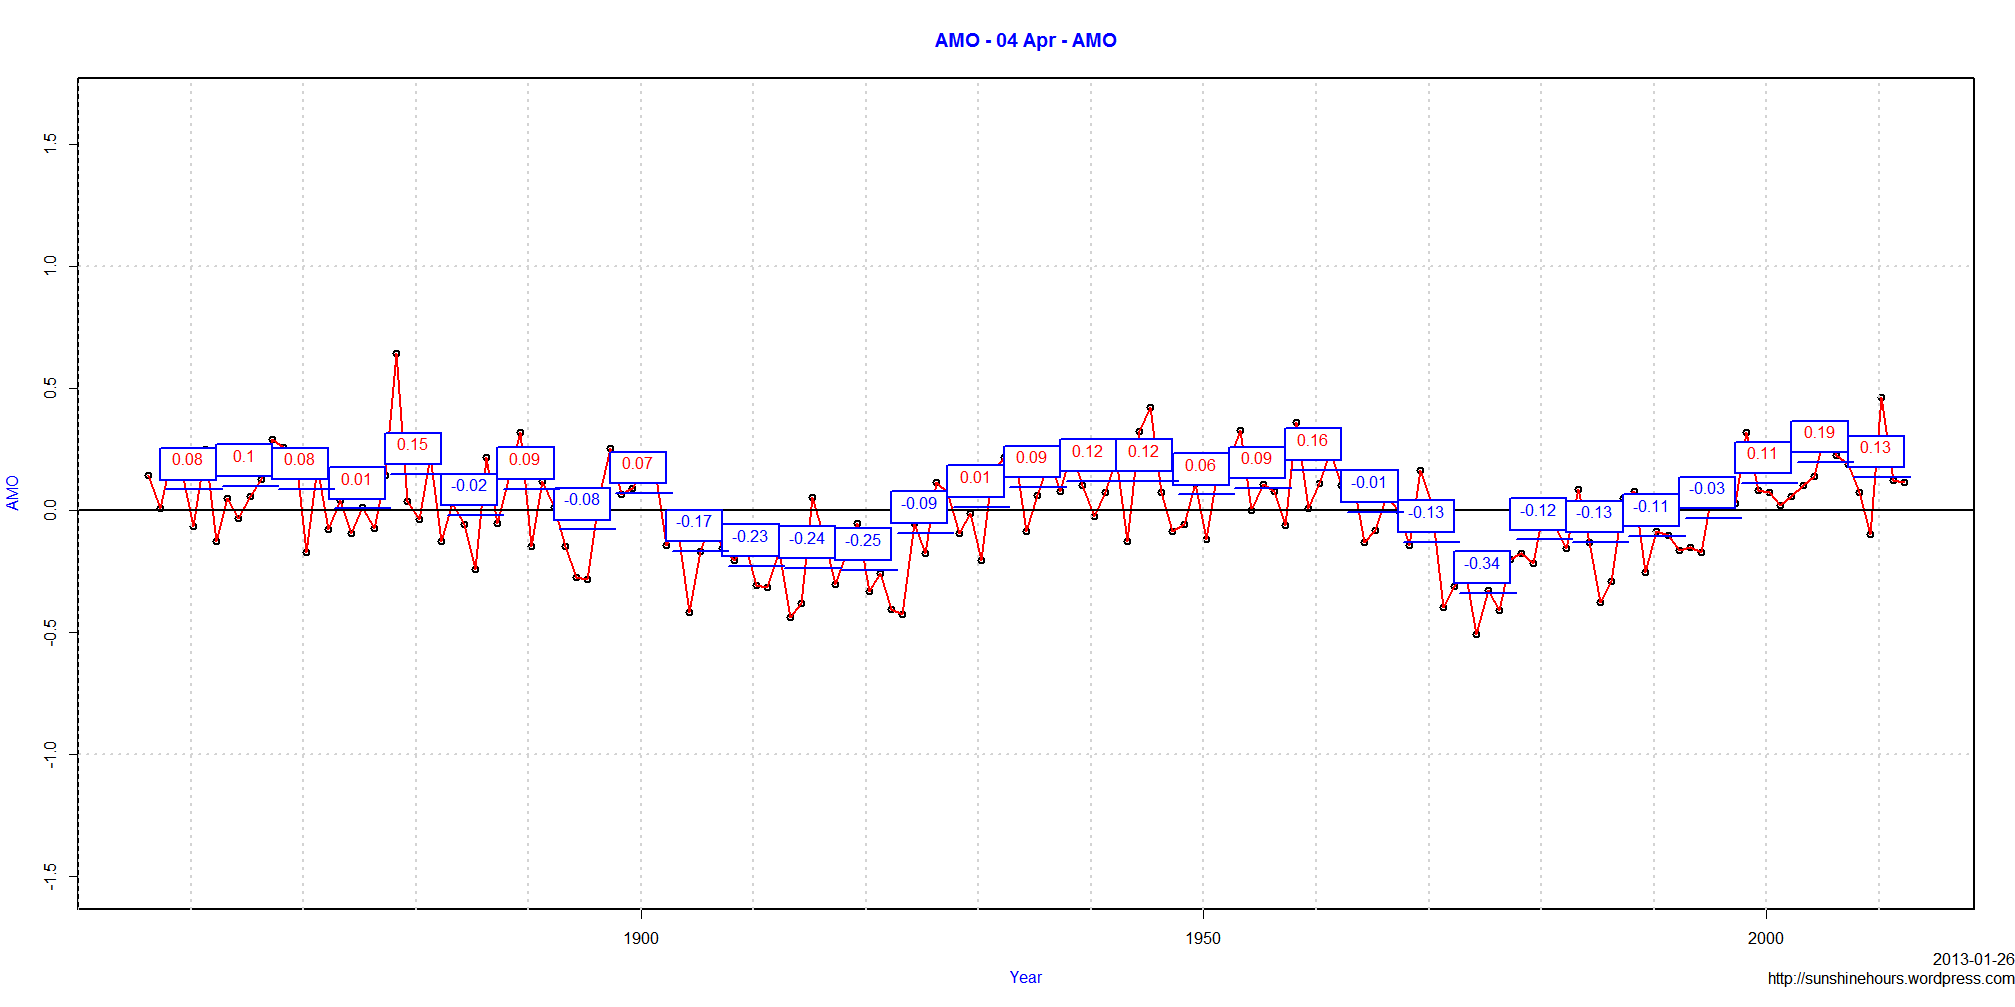
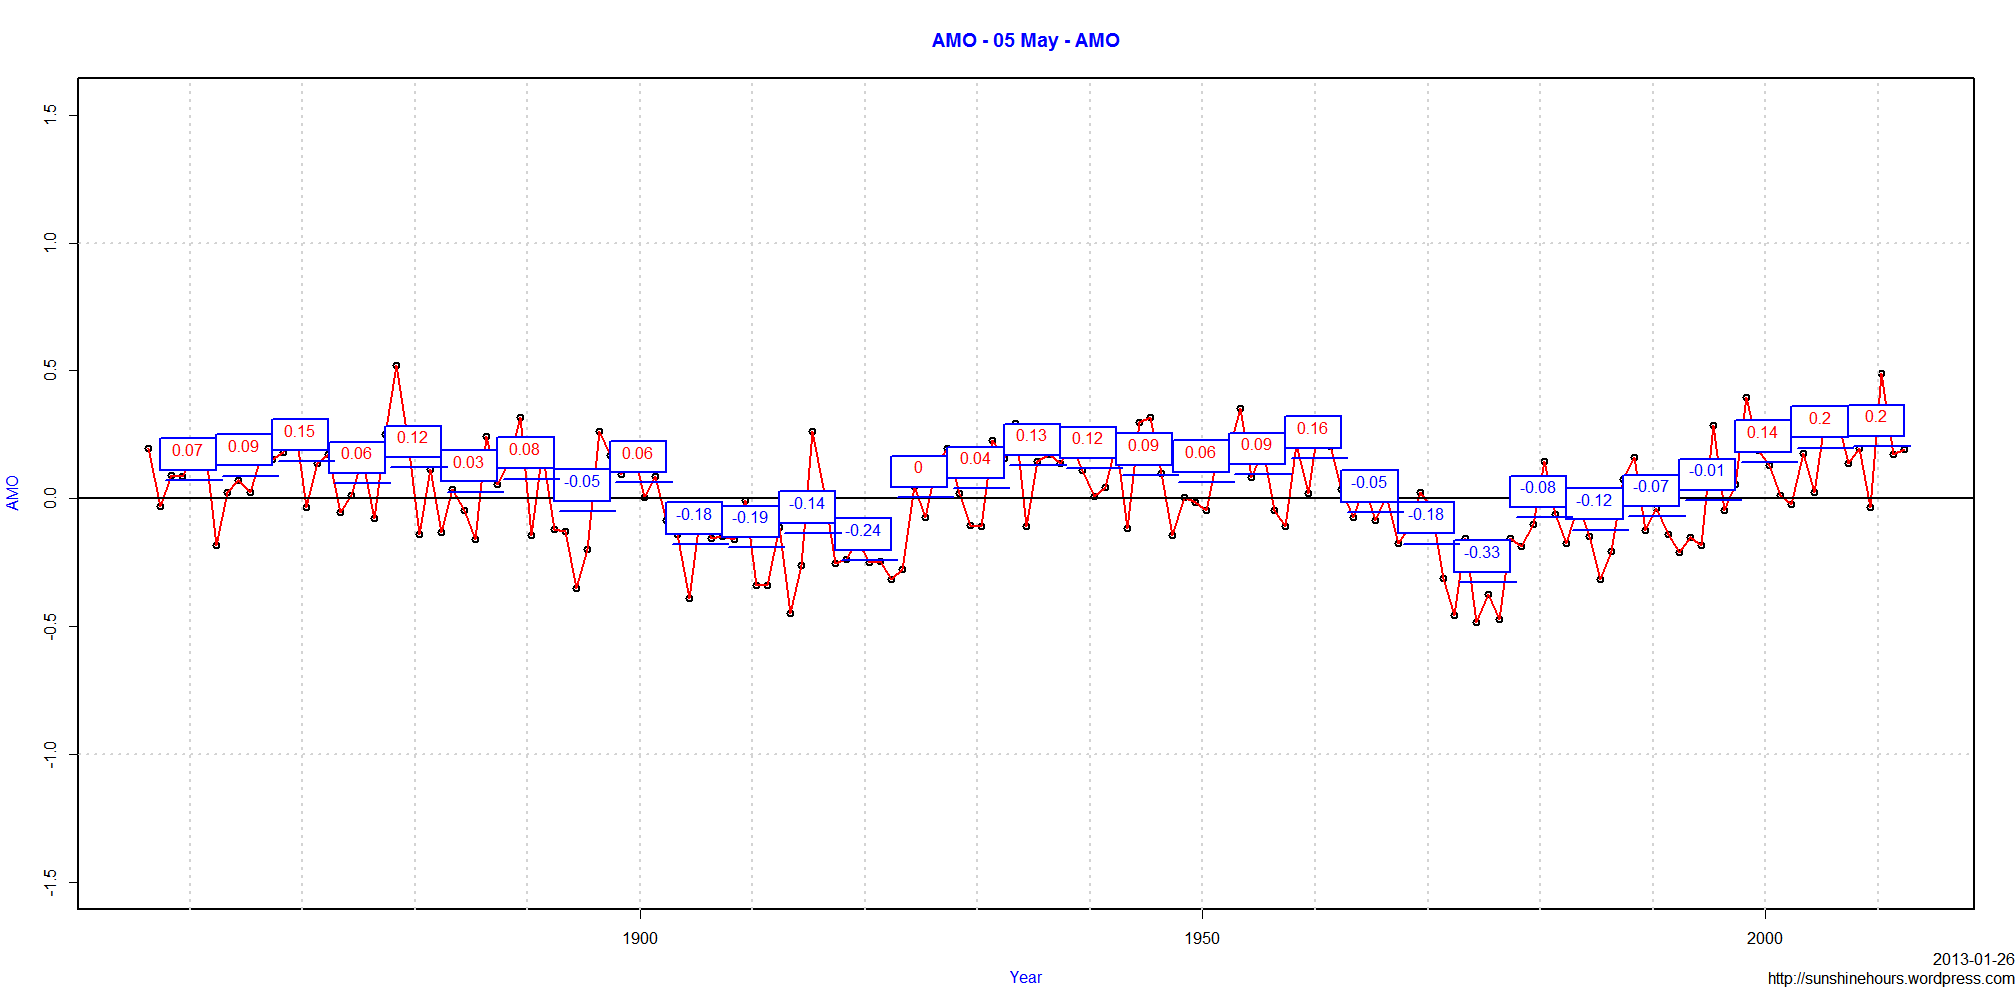
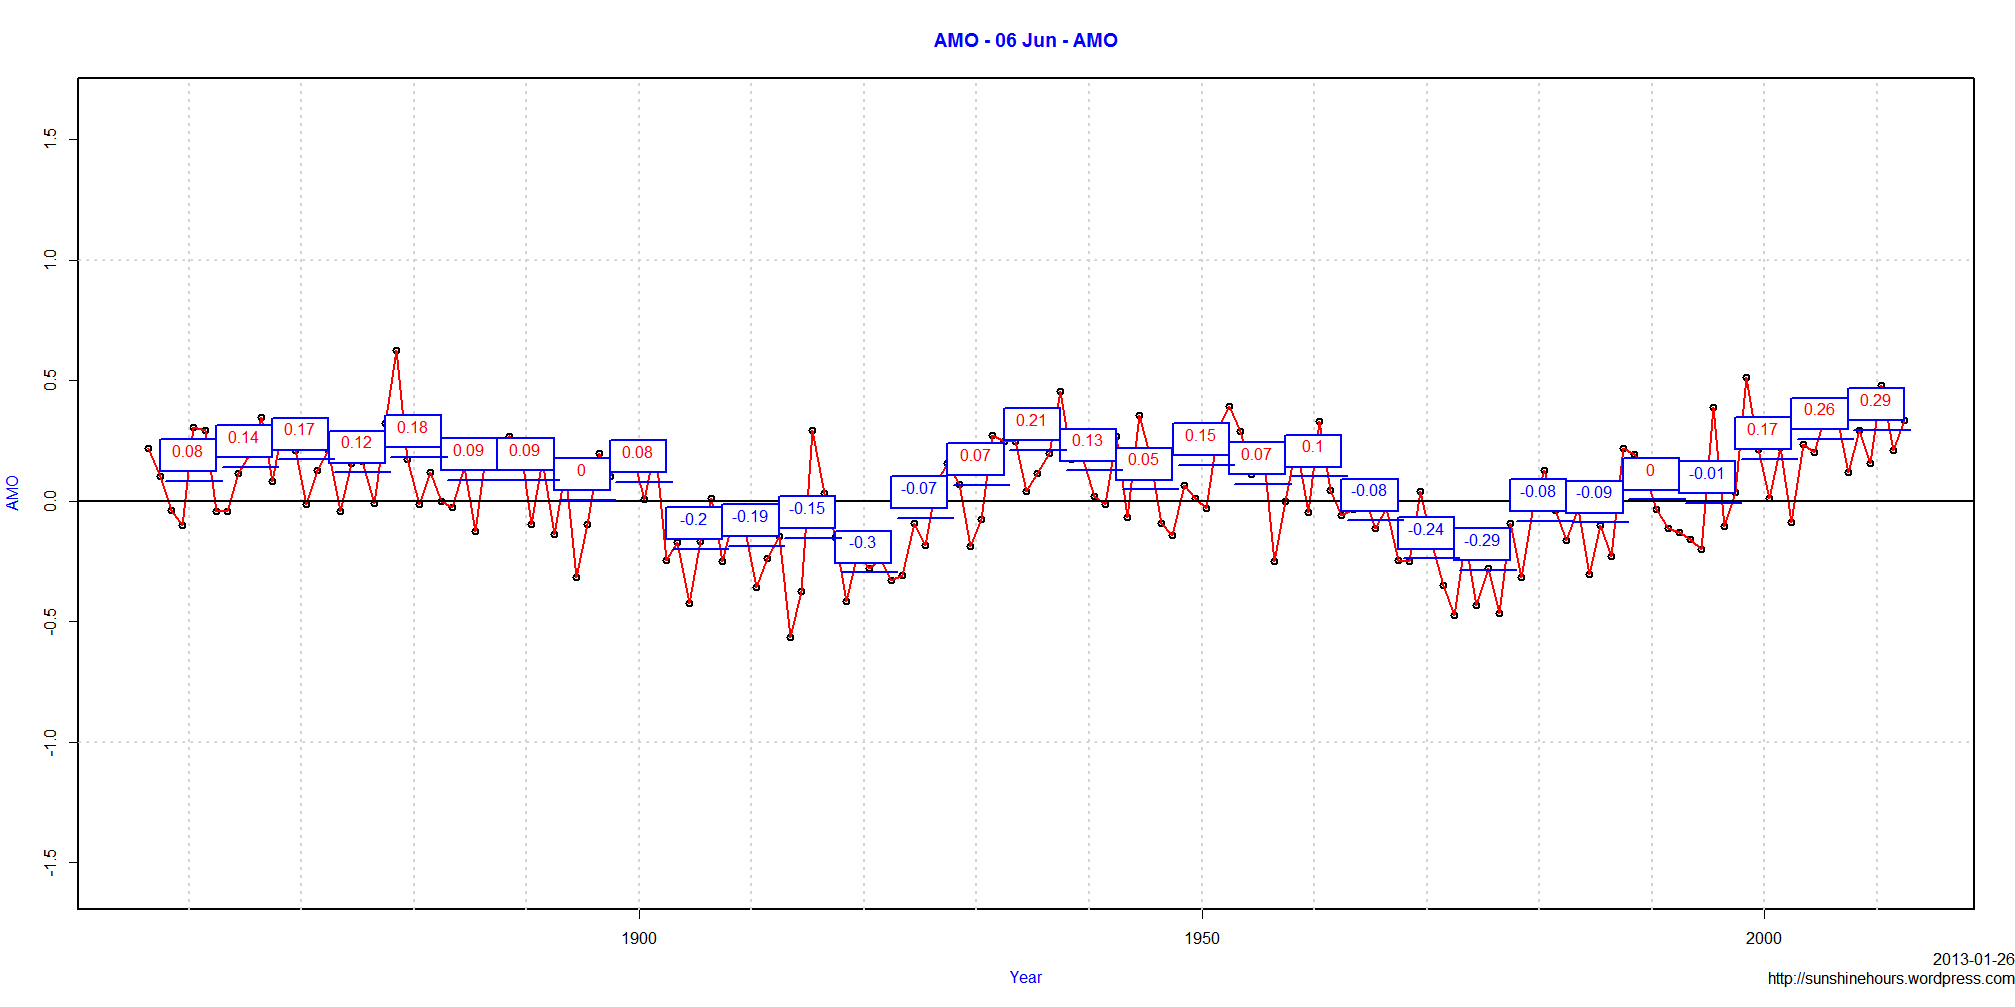
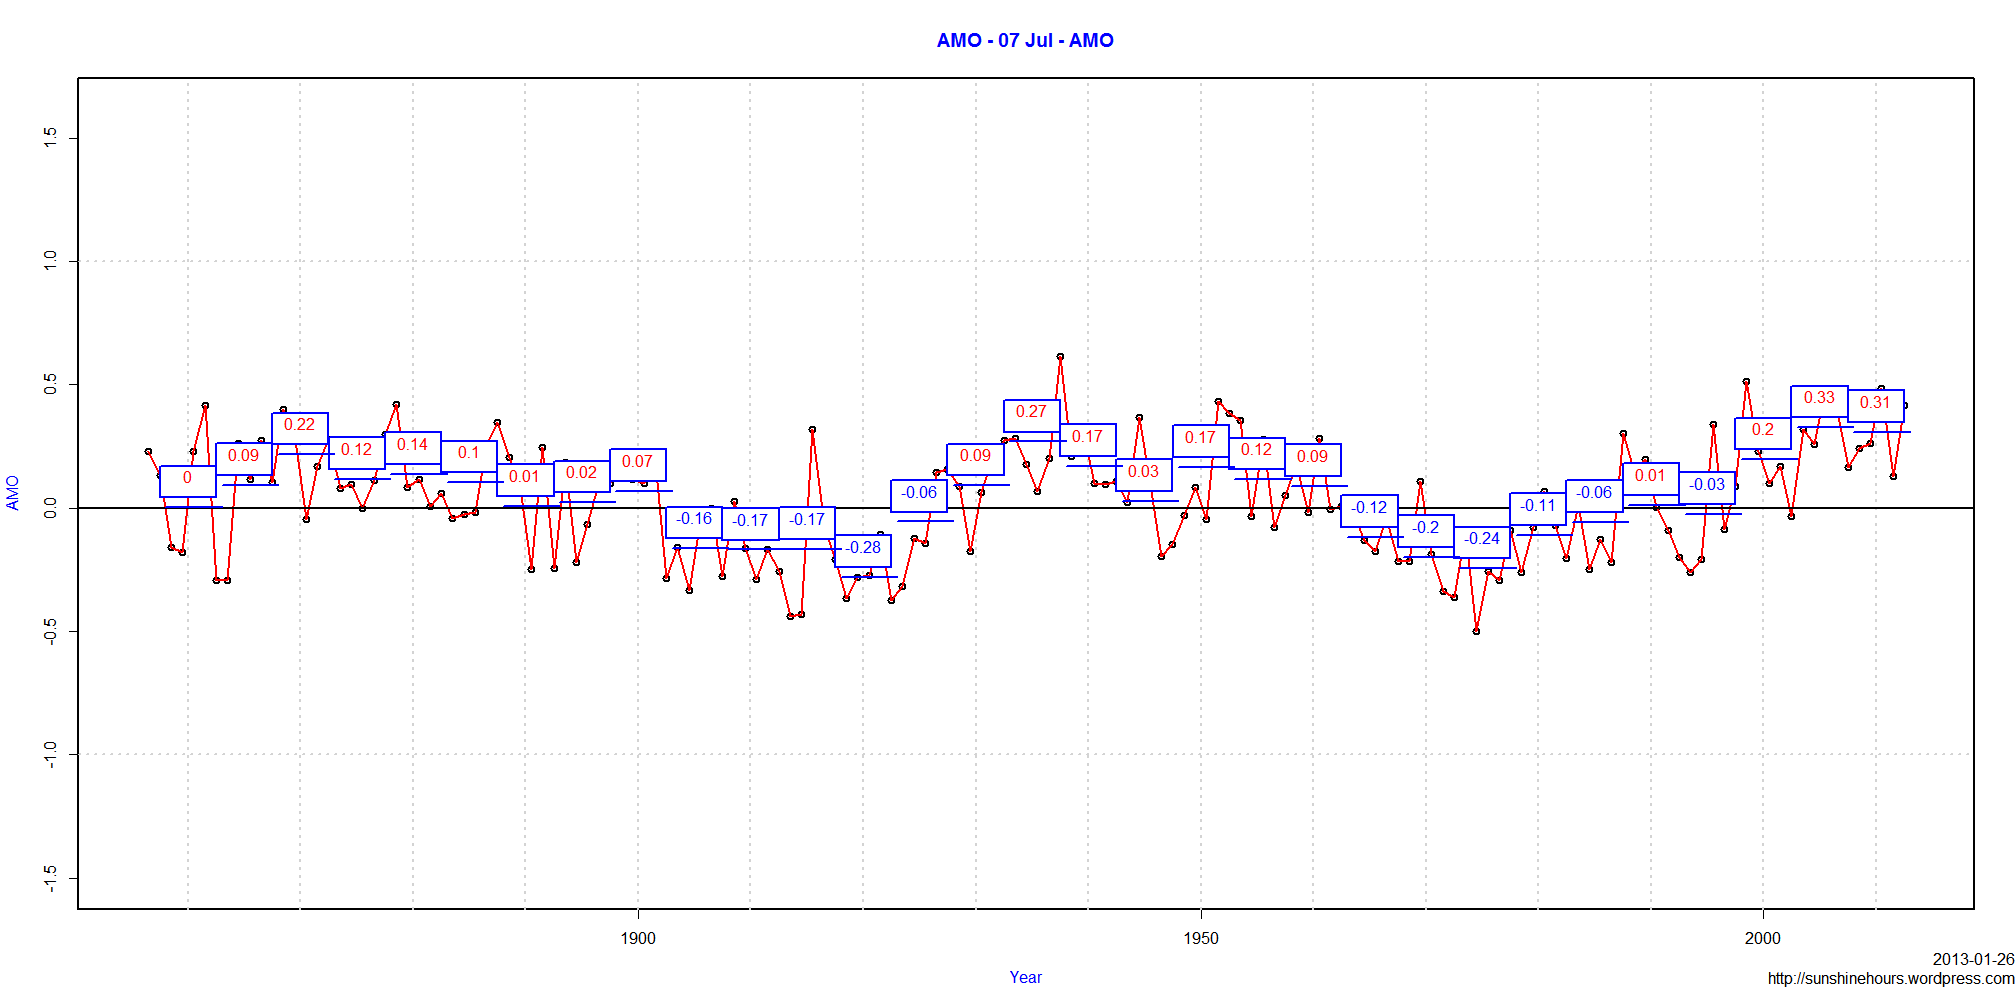
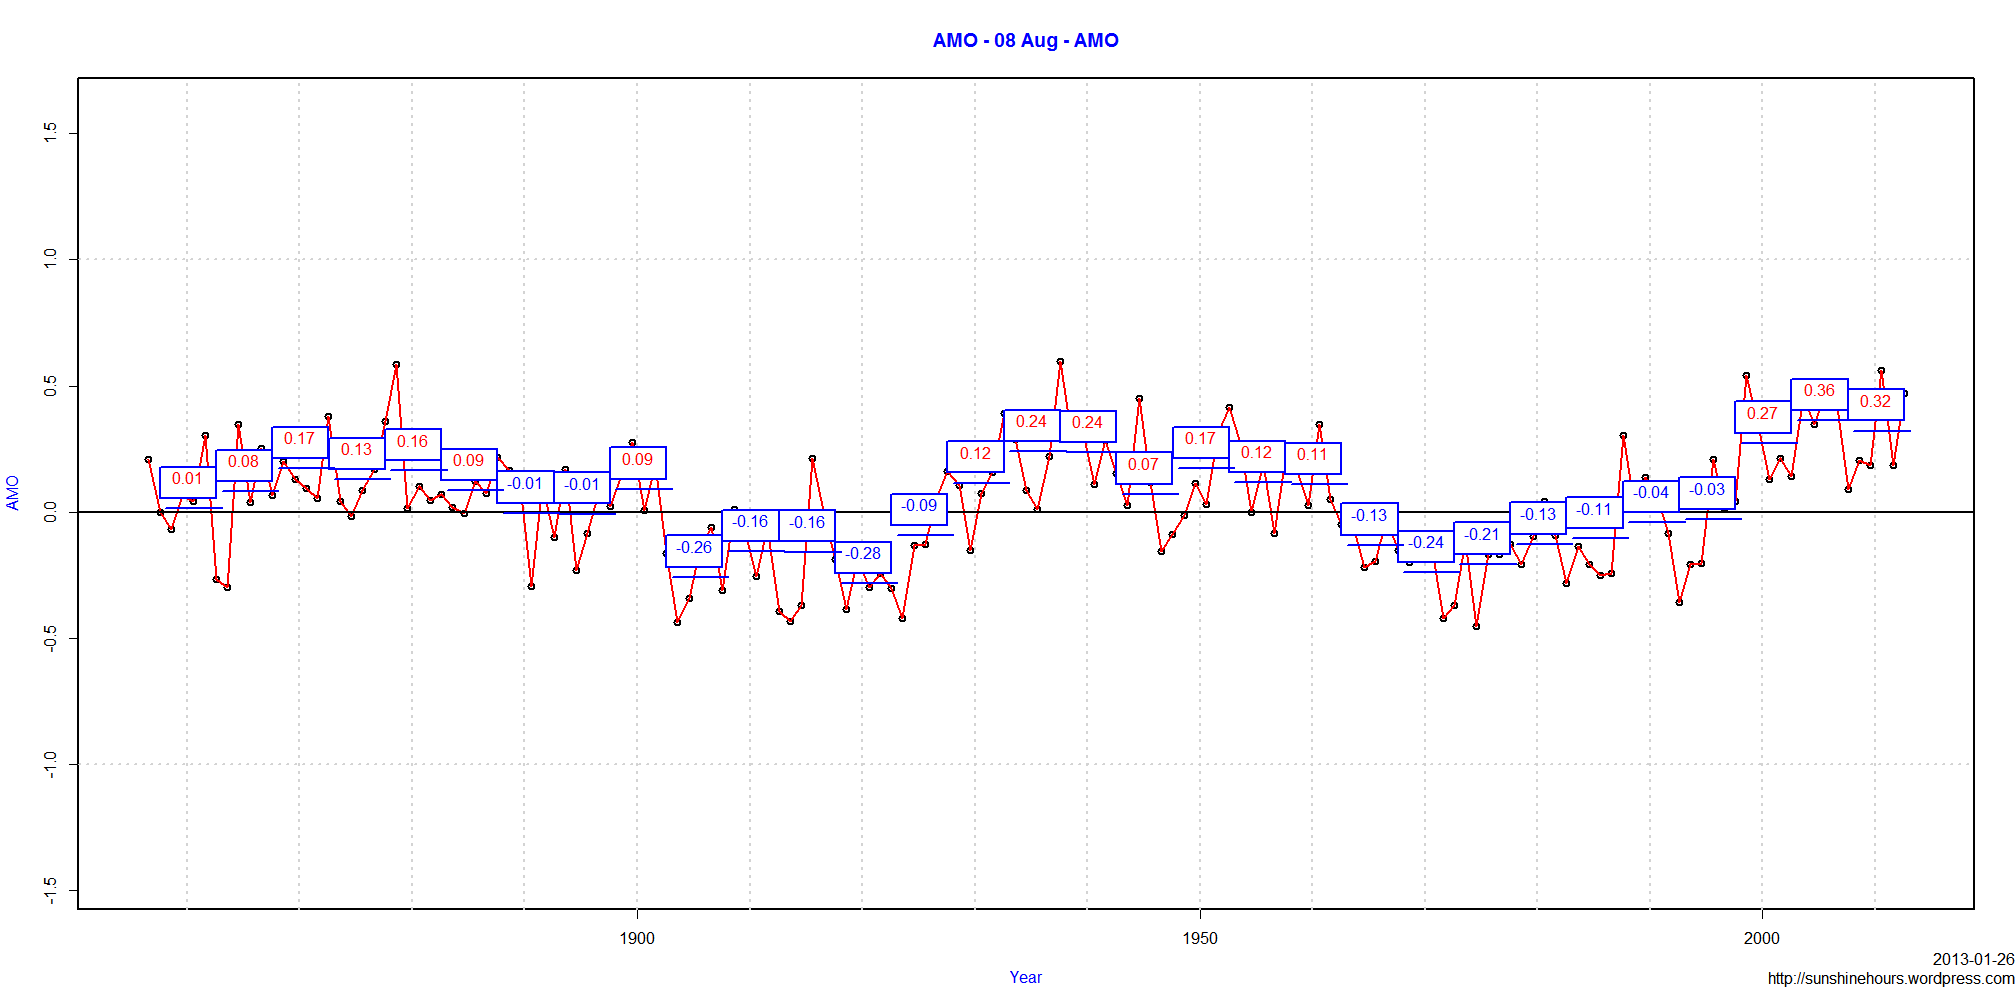
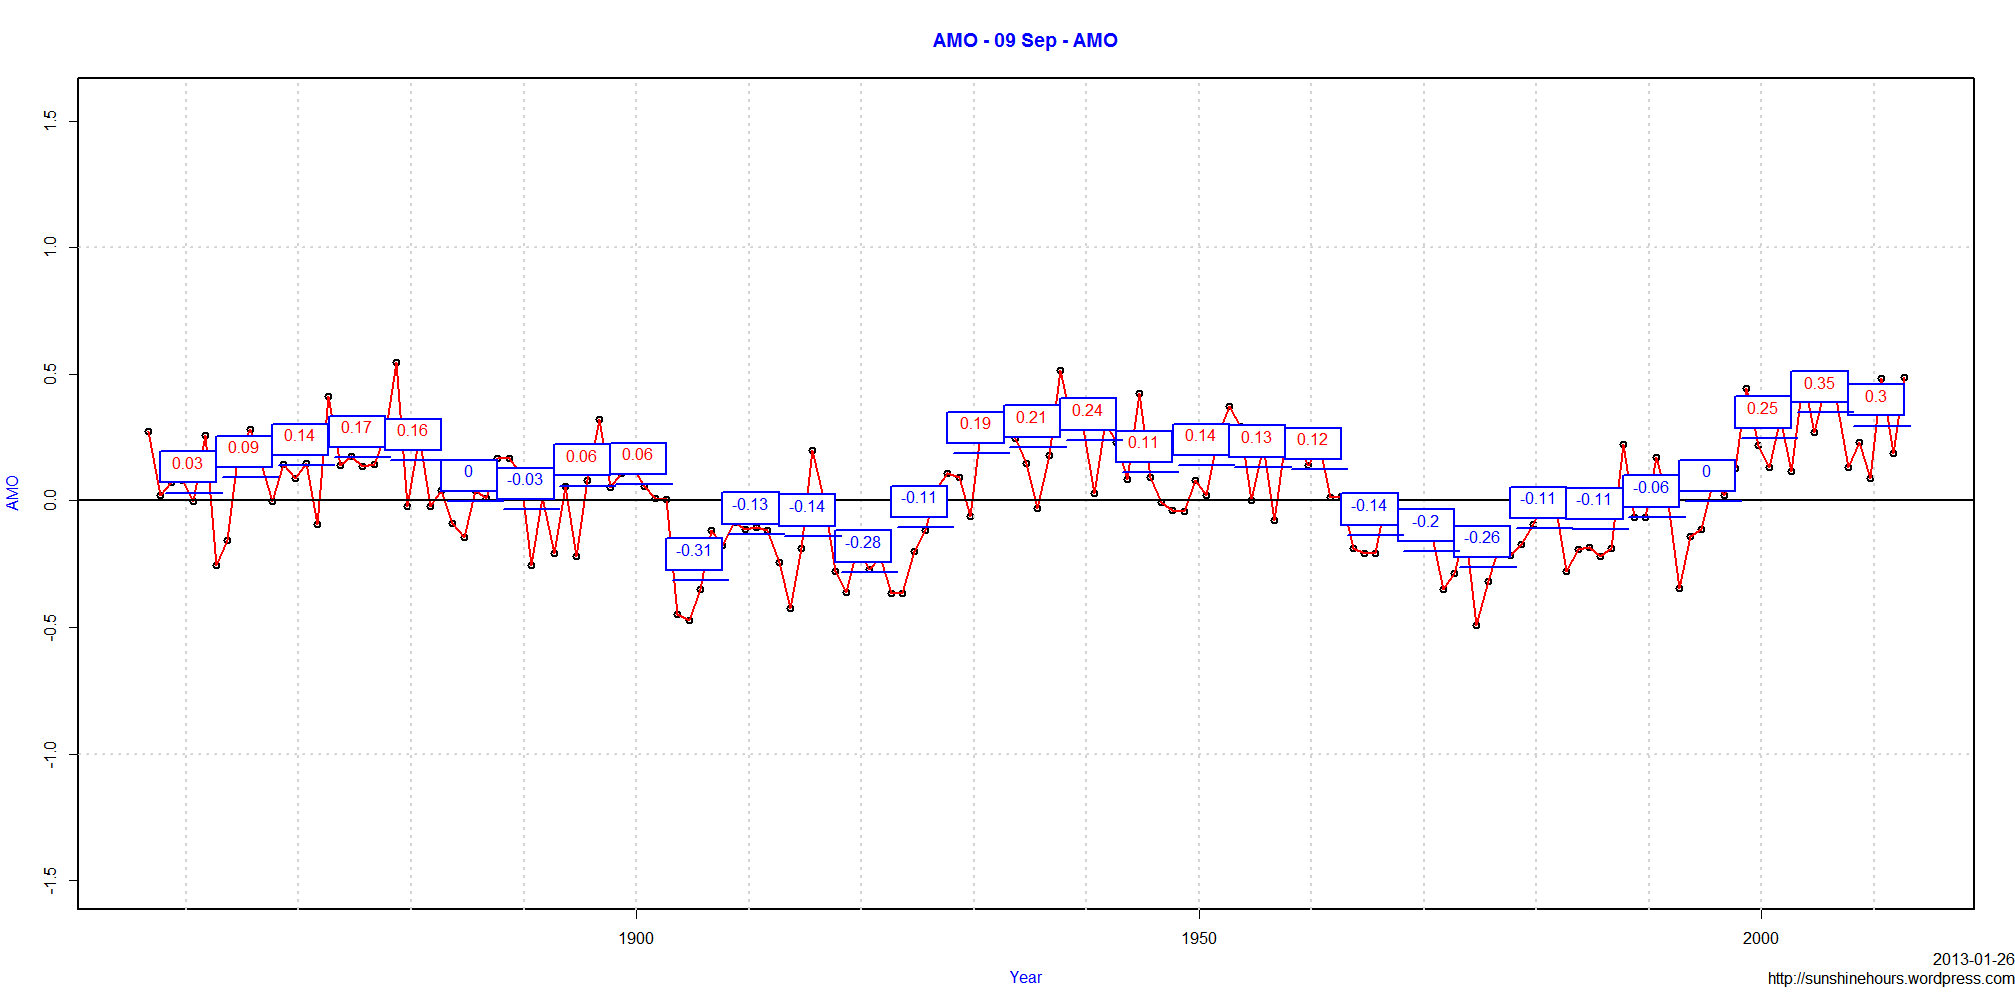
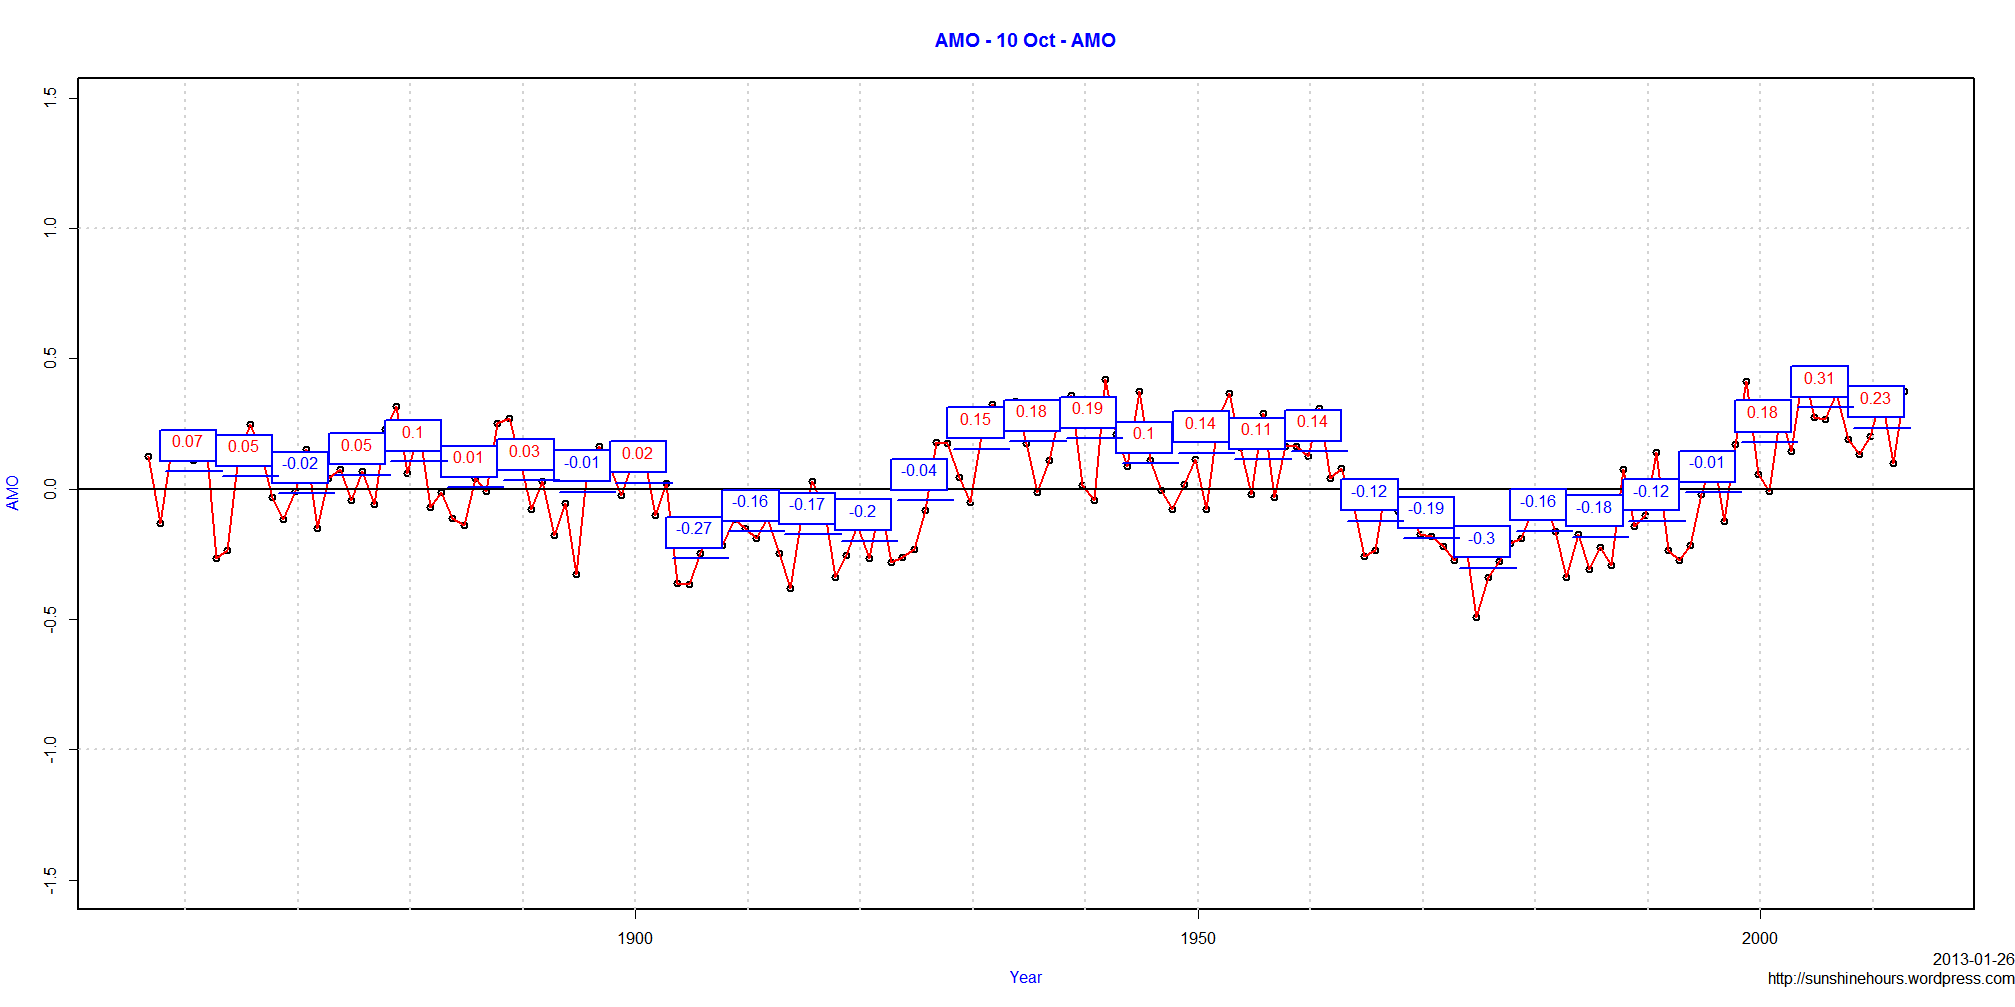
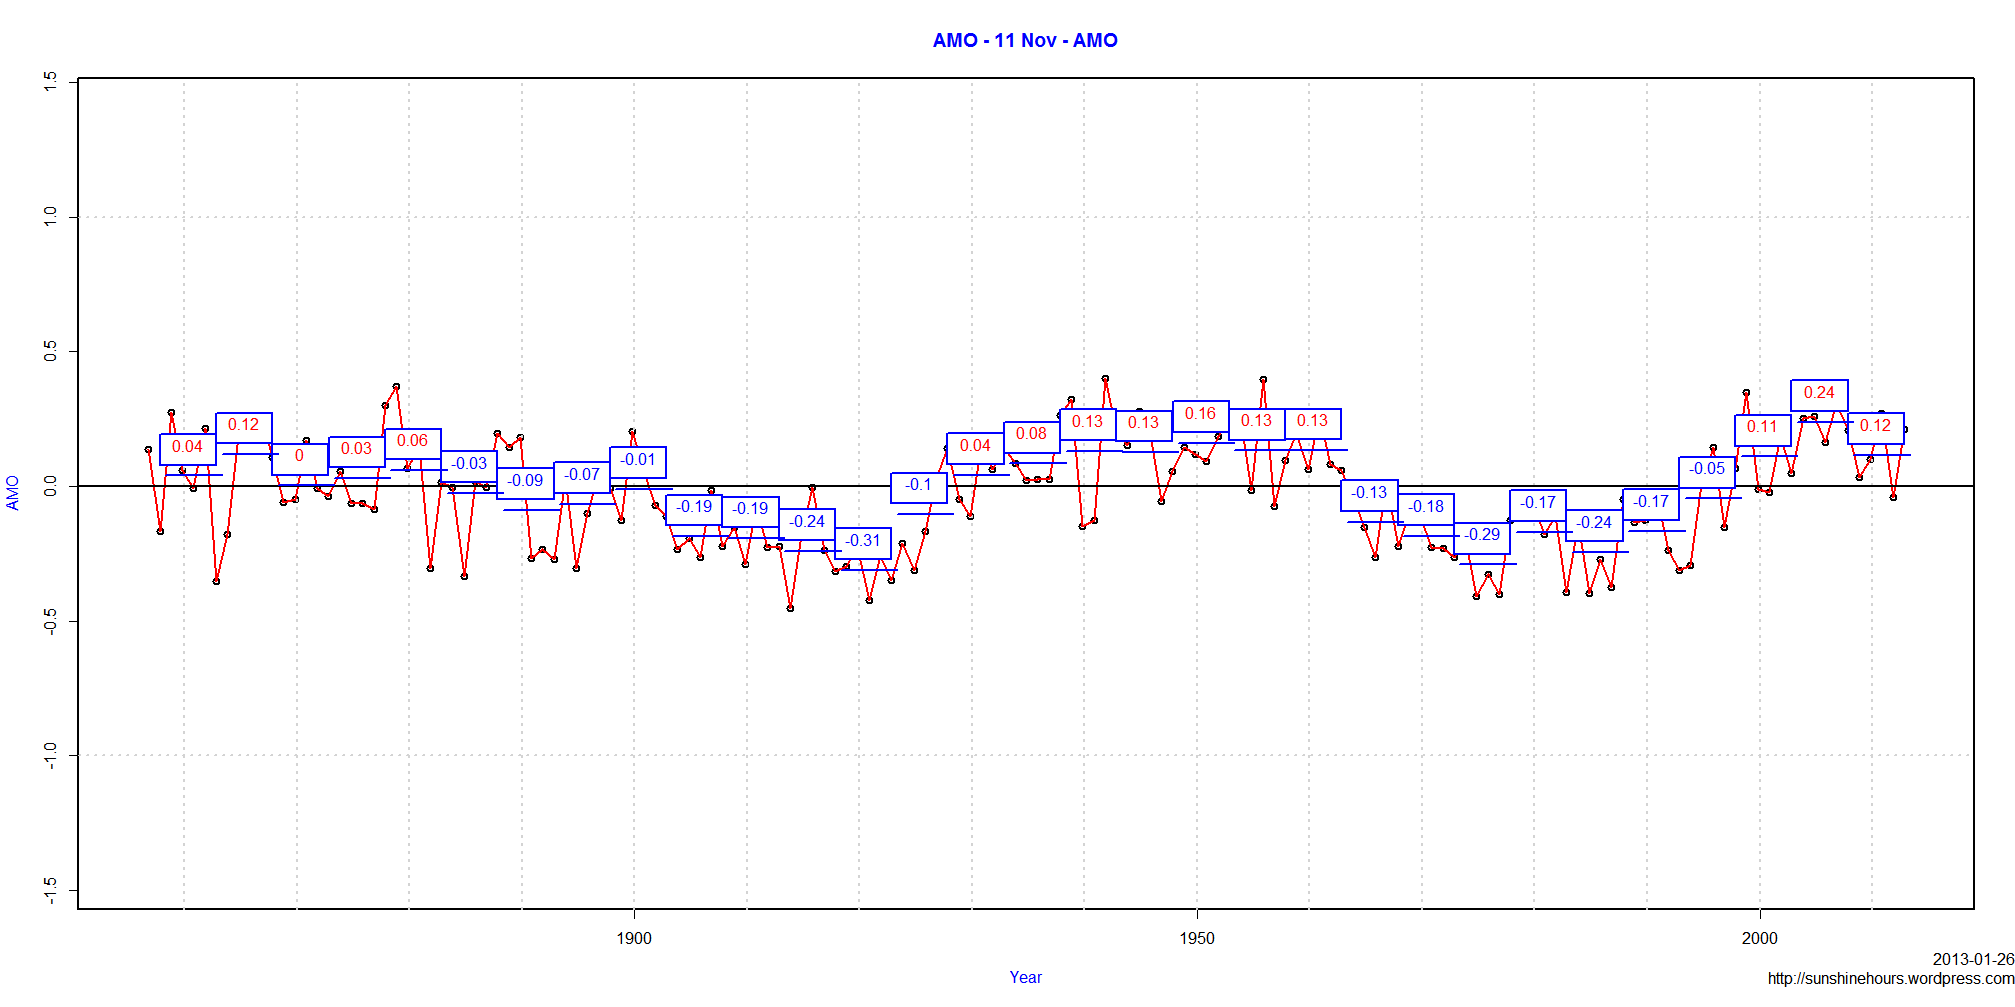
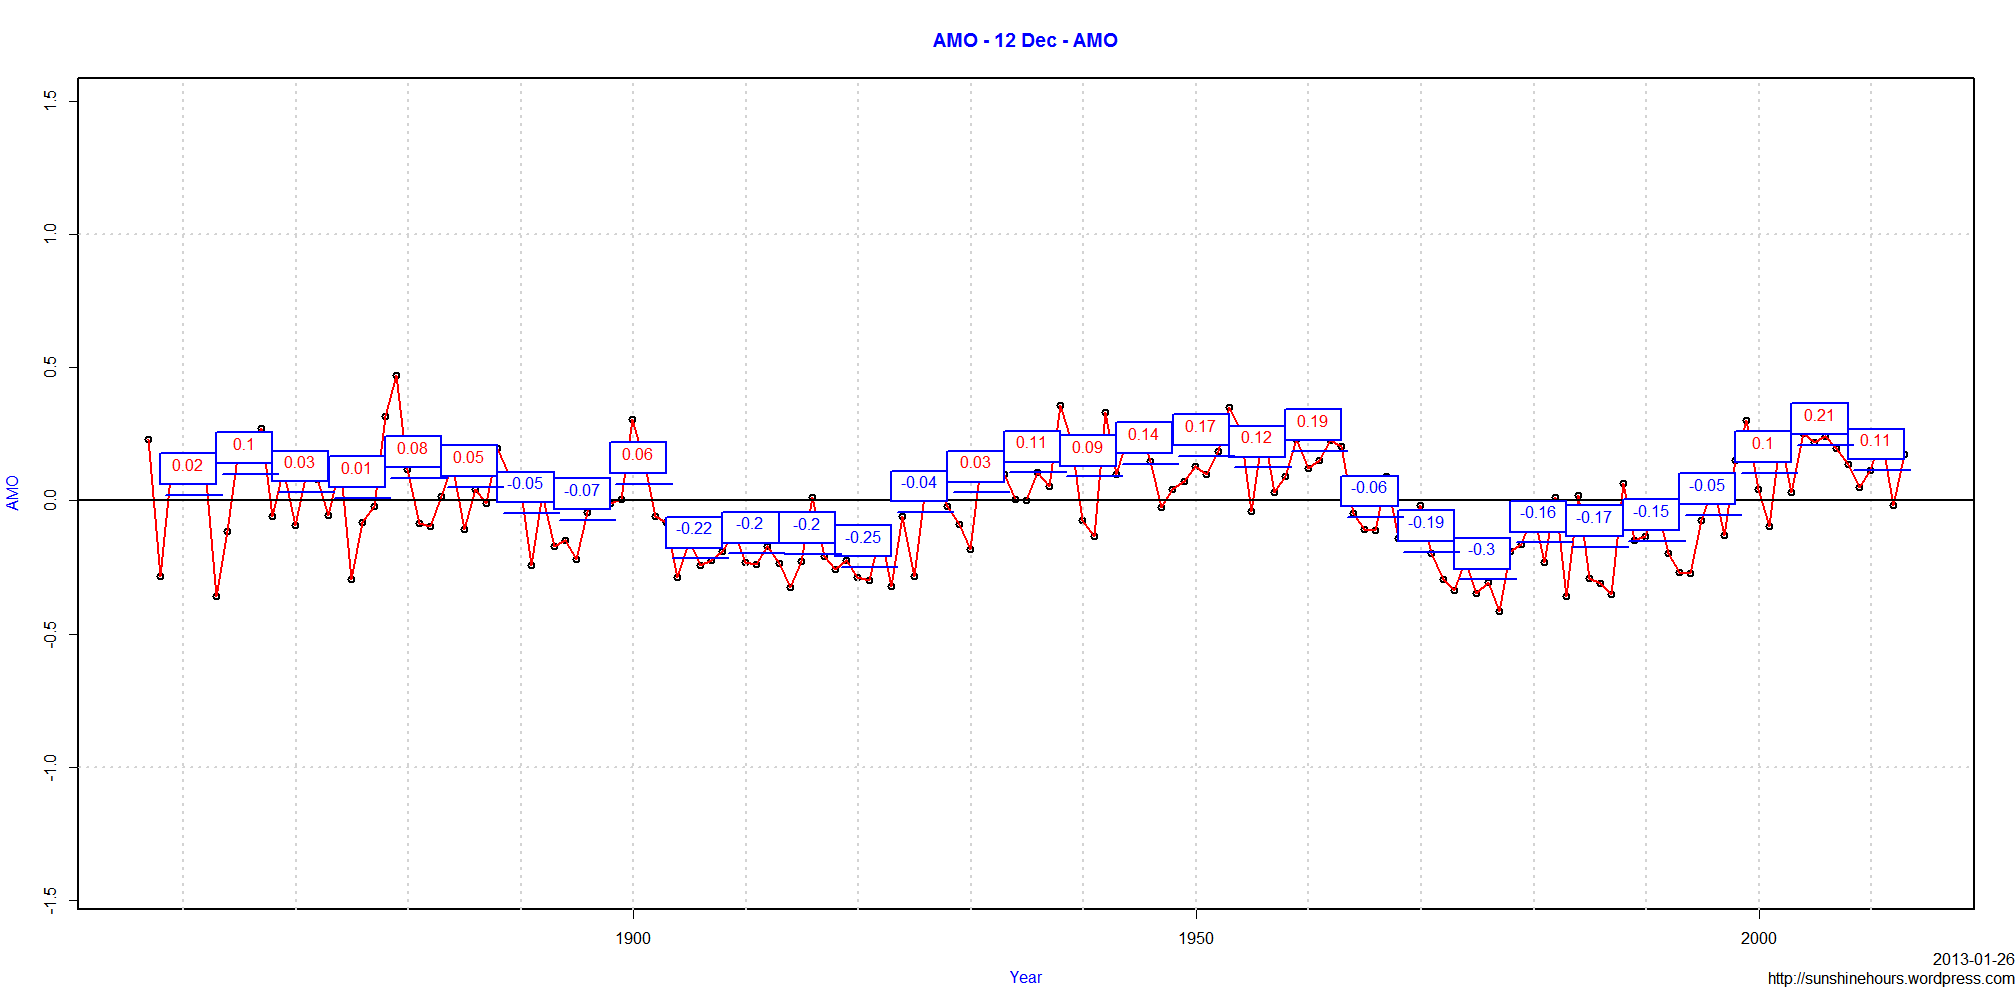
Has the AMO Peaked and started its drop towards negative? The answer is yes for winter months and no for summer months.
Maybe thats why winter Arctic Ice is doing fine and summer Arctic Ice is not doing fine.
I have included a graph for the AMO for all years that we have data, and then the AMO broken down for each individual month.
The blue boxes in the graphs contain 5 years averages, the blue line underneath is the 5 year period. Red values = above 0 and blue values = below 0.
The All Years AMO has dropped a little over the last 5 years compared to the previous 5 years, but the value is still higher than the 1950 peak of the AMO (but not as high as the short peak around 1878).
It is also interesting that the 1950 peak was in the middle of a 35-40 year period above zero and the current peak is only 15 years long. The AMO may still have decades left above zero, but the winter months look like it was a shorter peak.
May to October 5 year values are still higher than the previous peak around 1950.
November to April have dropped and are now lower than the previous peak around 1950.
Click on any graph to make it bigger.
2013 Arctic Sea Ice has increased by .96 million sq km since Jan 1 according to NOAA.
That is the 2nd largest increase ever for this day 17.
| Year | Start Day | Last Day | Starting Ice Extent | Ice Extent Today | New Ice |
| 1993 | 1 | 17 | 14.026 | 15.056 | 1.03 |
| 2013 | 1 | 17 | 12.897 | 13.86 | 0.963 |
| 1986 | 1 | 17 | 13.997 | 14.926 | 0.929 |
| 2003 | 1 | 17 | 13.615 | 14.538 | 0.923 |
| 2009 | 1 | 17 | 13.138 | 14.039 | 0.901 |
| 1985 | 2 | 18 | 14.025 | 14.839 | 0.814 |
| 1991 | 1 | 17 | 13.607 | 14.401 | 0.794 |
| 2002 | 1 | 17 | 13.544 | 14.323 | 0.779 |
| 1997 | 1 | 17 | 13.607 | 14.38 | 0.773 |
| 2000 | 1 | 17 | 13.403 | 14.174 | 0.771 |
| 2001 | 1 | 17 | 13.435 | 14.193 | 0.758 |
| 1983 | 1 | 17 | 14.233 | 14.989 | 0.756 |
| 1989 | 1 | 17 | 14.228 | 14.982 | 0.754 |
| 1980 | 1 | 17 | 14.191 | 14.941 | 0.75 |
| 1982 | 2 | 18 | 14.46 | 15.186 | 0.726 |
| 1981 | 1 | 17 | 14.259 | 14.95 | 0.691 |
| 1998 | 1 | 17 | 13.996 | 14.683 | 0.687 |
| 1994 | 1 | 17 | 14.068 | 14.751 | 0.683 |
| 2008 | 1 | 17 | 13.155 | 13.83 | 0.675 |
| 2005 | 1 | 17 | 13.119 | 13.769 | 0.65 |
| 2010 | 1 | 17 | 13.133 | 13.757 | 0.624 |
| 1987 | 2 | 18 | 14.285 | 14.902 | 0.617 |
| 1999 | 1 | 17 | 13.789 | 14.375 | 0.586 |
| 2007 | 1 | 17 | 13.076 | 13.66 | 0.584 |
| 2004 | 1 | 17 | 13.486 | 14.054 | 0.568 |
| 1995 | 1 | 17 | 14.111 | 14.65 | 0.539 |
| 2011 | 2 | 17 | 12.895 | 13.419 | 0.524 |
| 1992 | 1 | 17 | 14.038 | 14.541 | 0.503 |
| 1990 | 1 | 17 | 14.255 | 14.682 | 0.427 |
| 1996 | 1 | 17 | 13.766 | 14.18 | 0.414 |
| 2006 | 1 | 17 | 13.116 | 13.41 | 0.294 |
| 2012 | 1 | 17 | 13.369 | 13.569 | 0.2 |
| 1984 | 2 | 18 | 14.087 | 14.249 | 0.162 |
| 1988 | 14 | 17 | 14.828 | 14.978 | 0.15 |
Among the ice charts I peek at every day is the one from DMI (Danish Meteorological Institute).
Today there was a new Sea Ice Extent Chart with this text at the bottom:
The plot above replaces an earlier sea ice extent plot, that was based on data with the coastal zones masked out.
The new plot displays absolute sea ice extent estimates.
Arctic Sea Ice Extent supposedly bottomed out around 2.5 million sq km according to the old chart posted by DMI for months.

Imagine my surprise when today the Sea Ice Extent bottomed out at 4 million sq km. and the chart looked like

Maybe that explains why Arctic-roos site isn’t showing any charts.
Arctic Sea Ice Extent has risen 105.9% from minimum.
The table below is for each year 36 days after minimum (which is where 2012 is).
| Year | Min_Day | Minimum_Extent | Day | Extent | Extent_Change | Extent_Change_Pct |
| 2012 | 260 | 3.36855 | 296 | 6.9346 | 3.56605 | 105.9 |
| 2008 | 262 | 4.55469 | 298 | 8.6348 | 4.08011 | 89.6 |
| 2005 | 265 | 5.31832 | 301 | 8.99287 | 3.67455 | 69.1 |
| 2010 | 262 | 4.59918 | 298 | 7.7708 | 3.17162 | 69 |
| 1990 | 264 | 6.0191 | 300 | 9.80574 | 3.78664 | 62.9 |
| 1999 | 255 | 5.68009 | 291 | 8.79531 | 3.11522 | 54.8 |
| 2007 | 257 | 4.1607 | 293 | 6.24682 | 2.08612 | 50.1 |
| 2004 | 263 | 5.77608 | 299 | 8.66593 | 2.88985 | 50 |
| 2002 | 256 | 5.62456 | 292 | 8.41471 | 2.79015 | 49.6 |
| 1991 | 259 | 6.26027 | 295 | 9.23626 | 2.97599 | 47.5 |
| 2003 | 260 | 5.97198 | 296 | 8.76889 | 2.79691 | 46.8 |
| 1998 | 260 | 6.29922 | 296 | 9.06504 | 2.76582 | 43.9 |
| 2000 | 255 | 5.9442 | 291 | 8.55331 | 2.60911 | 43.9 |
| 1989 | 265 | 6.88931 | 301 | 9.90128 | 3.01197 | 43.7 |
| 1979 | 264 | 6.89236 | 300 | 9.81273 | 2.92037 | 42.4 |
| 2006 | 257 | 5.74877 | 293 | 8.08785 | 2.33908 | 40.7 |
| 1993 | 249 | 6.15699 | 285 | 8.62008 | 2.46309 | 40 |
| 2009 | 255 | 5.05488 | 291 | 7.04661 | 1.99173 | 39.4 |
| 1984 | 260 | 6.39916 | 296 | 8.88718 | 2.48802 | 38.9 |
| 2011 | 251 | 4.30207 | 287 | 5.93733 | 1.63526 | 38 |
| 1982 | 256 | 7.15423 | 292 | 9.79515 | 2.64092 | 36.9 |
| 2001 | 262 | 6.56774 | 298 | 8.77267 | 2.20493 | 33.6 |
| 1988 | 255 | 7.04905 | 291 | 9.3216 | 2.27255 | 32.2 |
| 1981 | 253 | 6.88784 | 289 | 8.96254 | 2.0747 | 30.1 |
| 1985 | 250 | 6.4799 | 286 | 8.41305 | 1.93315 | 29.8 |
| 1986 | 249 | 7.12351 | 285 | 9.21502 | 2.09151 | 29.4 |
| 1992 | 251 | 7.16324 | 287 | 9.23786 | 2.07462 | 29 |
| 1996 | 254 | 7.15283 | 290 | 9.19238 | 2.03955 | 28.5 |
| 1983 | 251 | 7.19145 | 287 | 9.15526 | 1.96381 | 27.3 |
| 1995 | 252 | 5.98945 | 288 | 7.57822 | 1.58877 | 26.5 |
| 1987 | 245 | 6.89159 | 281 | 8.62349 | 1.7319 | 25.1 |
| 1994 | 248 | 6.92645 | 284 | 8.33525 | 1.4088 | 20.3 |
| 1980 | 249 | 7.52476 | 285 | 8.93393 | 1.40917 | 18.7 |
| 1997 | 246 | 6.61353 | 282 | 7.66599 | 1.05246 | 15.9 |
In terms of total area 36 days after minimum, 2012 is 4th.
| Year | Min_Day | Minimum_Extent | Day | Extent | Extent_Change | Extent_Change_Pct |
| 2008 | 262 | 4.55469 | 298 | 8.6348 | 4.08011 | 89.6 |
| 1990 | 264 | 6.0191 | 300 | 9.80574 | 3.78664 | 62.9 |
| 2005 | 265 | 5.31832 | 301 | 8.99287 | 3.67455 | 69.1 |
| 2012 | 260 | 3.36855 | 296 | 6.9346 | 3.56605 | 105.9 |
| 2010 | 262 | 4.59918 | 298 | 7.7708 | 3.17162 | 69 |
| 1999 | 255 | 5.68009 | 291 | 8.79531 | 3.11522 | 54.8 |
| 1989 | 265 | 6.88931 | 301 | 9.90128 | 3.01197 | 43.7 |
| 1991 | 259 | 6.26027 | 295 | 9.23626 | 2.97599 | 47.5 |
| 1979 | 264 | 6.89236 | 300 | 9.81273 | 2.92037 | 42.4 |
| 2004 | 263 | 5.77608 | 299 | 8.66593 | 2.88985 | 50 |
| 2003 | 260 | 5.97198 | 296 | 8.76889 | 2.79691 | 46.8 |
| 2002 | 256 | 5.62456 | 292 | 8.41471 | 2.79015 | 49.6 |
| 1998 | 260 | 6.29922 | 296 | 9.06504 | 2.76582 | 43.9 |
| 1982 | 256 | 7.15423 | 292 | 9.79515 | 2.64092 | 36.9 |
| 2000 | 255 | 5.9442 | 291 | 8.55331 | 2.60911 | 43.9 |
| 1984 | 260 | 6.39916 | 296 | 8.88718 | 2.48802 | 38.9 |
| 1993 | 249 | 6.15699 | 285 | 8.62008 | 2.46309 | 40 |
| 2006 | 257 | 5.74877 | 293 | 8.08785 | 2.33908 | 40.7 |
| 1988 | 255 | 7.04905 | 291 | 9.3216 | 2.27255 | 32.2 |
| 2001 | 262 | 6.56774 | 298 | 8.77267 | 2.20493 | 33.6 |
| 1986 | 249 | 7.12351 | 285 | 9.21502 | 2.09151 | 29.4 |
| 2007 | 257 | 4.1607 | 293 | 6.24682 | 2.08612 | 50.1 |
| 1981 | 253 | 6.88784 | 289 | 8.96254 | 2.0747 | 30.1 |
| 1992 | 251 | 7.16324 | 287 | 9.23786 | 2.07462 | 29 |
| 1996 | 254 | 7.15283 | 290 | 9.19238 | 2.03955 | 28.5 |
| 2009 | 255 | 5.05488 | 291 | 7.04661 | 1.99173 | 39.4 |
| 1983 | 251 | 7.19145 | 287 | 9.15526 | 1.96381 | 27.3 |
| 1985 | 250 | 6.4799 | 286 | 8.41305 | 1.93315 | 29.8 |
| 1987 | 245 | 6.89159 | 281 | 8.62349 | 1.7319 | 25.1 |
| 2011 | 251 | 4.30207 | 287 | 5.93733 | 1.63526 | 38 |
| 1995 | 252 | 5.98945 | 288 | 7.57822 | 1.58877 | 26.5 |
| 1980 | 249 | 7.52476 | 285 | 8.93393 | 1.40917 | 18.7 |
| 1994 | 248 | 6.92645 | 284 | 8.33525 | 1.4088 | 20.3 |
| 1997 | 246 | 6.61353 | 282 | 7.66599 | 1.05246 | 15.9 |
Three days ago I did a post about it being the 8th largest refreeze at the same days as 2012.
The most recent data is from day 294 (34 days past minimum), so the post is about the most new ice from minimum to the 34th day after minimum.
2012 has moved up from 8th to 5th in terms of area, and of course it is even further ahead in percentage change at 92.7%.
Arctic Sea Ice has increased by 500,000 sq km in just 3 days.
| Year | Minimum_Extent | ExtentDay | Extent | Extent_Change | Extent_Change_Pct |
| 2008 | 4.55469 | 296 | 8.34631 | 3.79162 | 83.2 |
| 1990 | 6.0191 | 298 | 9.62753 | 3.60843 | 59.9 |
| 2005 | 5.31832 | 299 | 8.74216 | 3.42384 | 64.4 |
| 2010 | 4.59918 | 296 | 7.73029 | 3.13111 | 68.1 |
| 2012 | 3.36855 | 294 | 6.49108 | 3.12253 | 92.7 |
| 1999 | 5.68009 | 289 | 8.66543 | 2.98534 | 52.6 |
| 1989 | 6.88931 | 299 | 9.81185 | 2.92254 | 42.4 |
| 1991 | 6.26027 | 293 | 9.13597 | 2.8757 | 45.9 |
| 1979 | 6.89236 | 298 | 9.67205 | 2.77969 | 40.3 |
| 2004 | 5.77608 | 297 | 8.41616 | 2.64008 | 45.7 |
| 2002 | 5.62456 | 290 | 8.22117 | 2.59661 | 46.2 |
| 1982 | 7.15423 | 290 | 9.73903 | 2.5848 | 36.1 |
| 1998 | 6.29922 | 294 | 8.87962 | 2.5804 | 41 |
| 2003 | 5.97198 | 294 | 8.53999 | 2.56801 | 43 |
| 2000 | 5.9442 | 289 | 8.4217 | 2.4775 | 41.7 |
| 1988 | 7.04905 | 289 | 9.25929 | 2.21024 | 31.4 |
| 1984 | 6.39916 | 294 | 8.60637 | 2.20721 | 34.5 |
| 1993 | 6.15699 | 283 | 8.33967 | 2.18268 | 35.5 |
| 2006 | 5.74877 | 291 | 7.88317 | 2.1344 | 37.1 |
| 2001 | 6.56774 | 296 | 8.56063 | 1.99289 | 30.3 |
| 1981 | 6.88784 | 287 | 8.85254 | 1.9647 | 28.5 |
| 1986 | 7.12351 | 283 | 9.05756 | 1.93405 | 27.2 |
| 1996 | 7.15283 | 288 | 9.08053 | 1.9277 | 27 |
| 1992 | 7.16324 | 285 | 9.05854 | 1.8953 | 26.5 |
| 1983 | 7.19145 | 285 | 9.07326 | 1.88181 | 26.2 |
| 2009 | 5.05488 | 289 | 6.82818 | 1.7733 | 35.1 |
| 2007 | 4.1607 | 291 | 5.88829 | 1.72759 | 41.5 |
| 1987 | 6.89159 | 279 | 8.54745 | 1.65586 | 24 |
| 1985 | 6.4799 | 284 | 8.10411 | 1.62421 | 25.1 |
| 2011 | 4.30207 | 285 | 5.70884 | 1.40677 | 32.7 |
| 1980 | 7.52476 | 283 | 8.74495 | 1.22019 | 16.2 |
| 1994 | 6.92645 | 282 | 8.14096 | 1.21451 | 17.5 |
| 1995 | 5.98945 | 286 | 6.96936 | 0.97991 | 16.4 |
| 1997 | 6.61353 | 280 | 7.39169 | 0.77816 | 11.8 |
Playing around with NSIDC data … Extent and Difference in millions of sq km.
Most New Arctic Extent in any 30 day period for each year:
| Year | Day1 | Extent1 | Day 30 | Extent2 | Difference | Percent |
| 2007 | 286 | 5.30839 | 316 | 9.66878 | 4.36039 | 82.14 |
| 2008 | 273 | 4.93508 | 303 | 9.077 | 4.14192 | 83.93 |
| 1995 | 277 | 6.14383 | 307 | 10.13683 | 3.993 | 64.99 |
| 2011 | 279 | 5.29842 | 309 | 9.12387 | 3.82545 | 72.2 |
| 1990 | 270 | 6.17527 | 300 | 9.80574 | 3.63047 | 58.79 |
| 2005 | 281 | 6.23356 | 311 | 9.82469 | 3.59113 | 57.61 |
| 1993 | 277 | 7.33222 | 307 | 10.55187 | 3.21965 | 43.91 |
| 2009 | 280 | 5.83093 | 310 | 9.00812 | 3.17719 | 54.49 |
| 2010 | 280 | 5.9077 | 310 | 9.00754 | 3.09984 | 52.47 |
| 1999 | 265 | 6.16758 | 295 | 9.26104 | 3.09346 | 50.16 |
| 2006 | 275 | 6.0512 | 305 | 9.12123 | 3.07003 | 50.73 |
| 1991 | 271 | 6.51511 | 301 | 9.53251 | 3.0174 | 46.31 |
| 2002 | 269 | 6.08789 | 299 | 9.04441 | 2.95652 | 48.56 |
| 2003 | 276 | 6.5633 | 306 | 9.46735 | 2.90405 | 44.25 |
| 1982 | 272 | 7.63864 | 302 | 10.51943 | 2.88079 | 37.71 |
| 1989 | 272 | 7.20673 | 302 | 9.99355 | 2.78682 | 38.67 |
| 2000 | 272 | 6.57732 | 302 | 9.33106 | 2.75374 | 41.87 |
| 1997 | 280 | 7.39169 | 310 | 10.1265 | 2.73481 | 37 |
| 1996 | 329 | 10.85434 | 359 | 13.57832 | 2.72398 | 25.1 |
| 1979 | 312 | 10.27106 | 342 | 12.98561 | 2.71455 | 26.43 |
| 2004 | 280 | 7.02369 | 310 | 9.72652 | 2.70283 | 38.48 |
| 1983 | 299 | 9.47507 | 329 | 12.16115 | 2.68608 | 28.35 |
| 1980 | 321 | 11.2121 | 351 | 13.89477 | 2.68267 | 23.93 |
| 1985 | 276 | 7.51509 | 306 | 10.19703 | 2.68194 | 35.69 |
| 2001 | 289 | 8.20044 | 319 | 10.87187 | 2.67143 | 32.58 |
| 1984 | 312 | 10.06132 | 342 | 12.7188 | 2.65748 | 26.41 |
| 2012 | 262 | 3.51352 | 292 | 6.16765 | 2.65413 | 75.54 |
| 1998 | 267 | 6.5224 | 297 | 9.17577 | 2.65337 | 40.68 |
| 1981 | 325 | 11.25234 | 355 | 13.90002 | 2.64768 | 23.53 |
| 1988 | 311 | 10.44499 | 341 | 13.08941 | 2.64442 | 25.32 |
| 1994 | 281 | 8.05619 | 311 | 10.64024 | 2.58405 | 32.08 |
| 1992 | 310 | 10.4128 | 340 | 12.98672 | 2.57392 | 24.72 |
| 1987 | 300 | 9.46603 | 330 | 12.01156 | 2.54553 | 26.89 |
| 1986 | 267 | 7.53248 | 297 | 9.98248 | 2.45 | 32.53 |
2012 is way down so far because it has only been 44 days since minimum.
