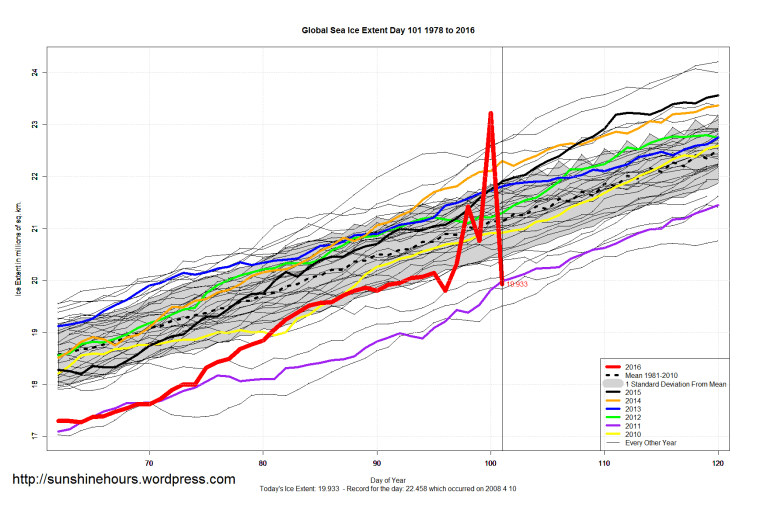
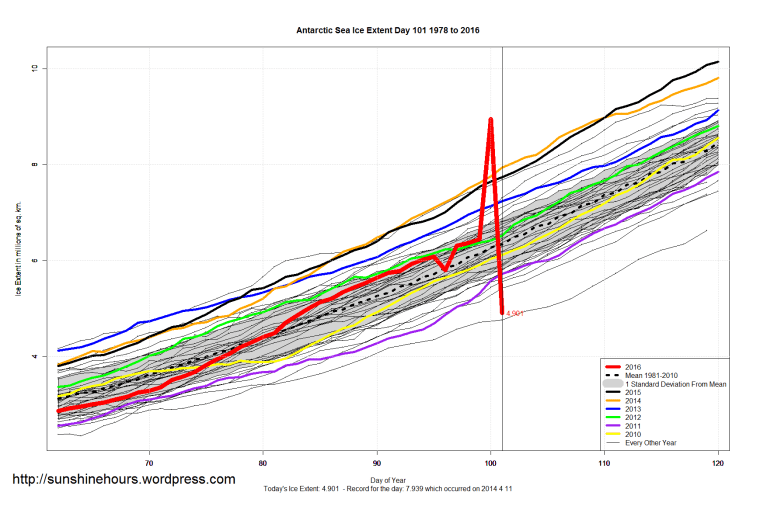
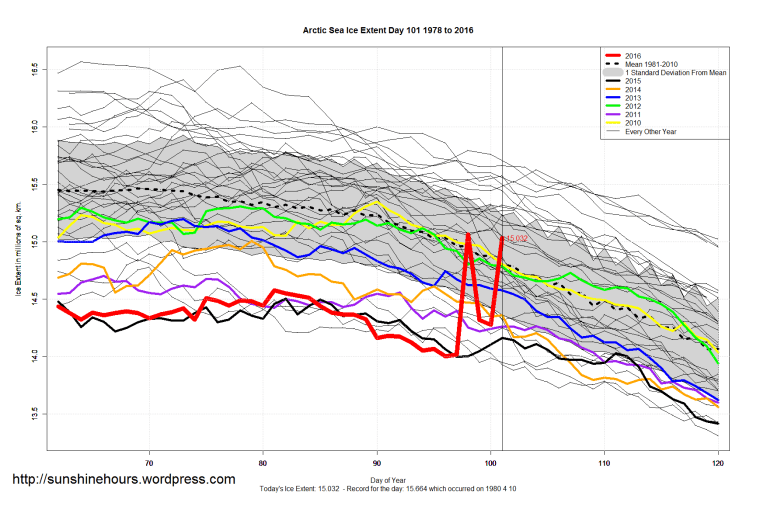
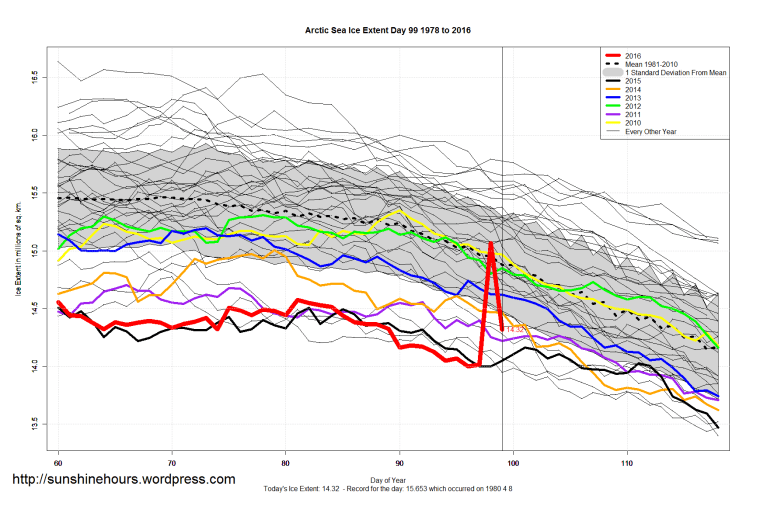
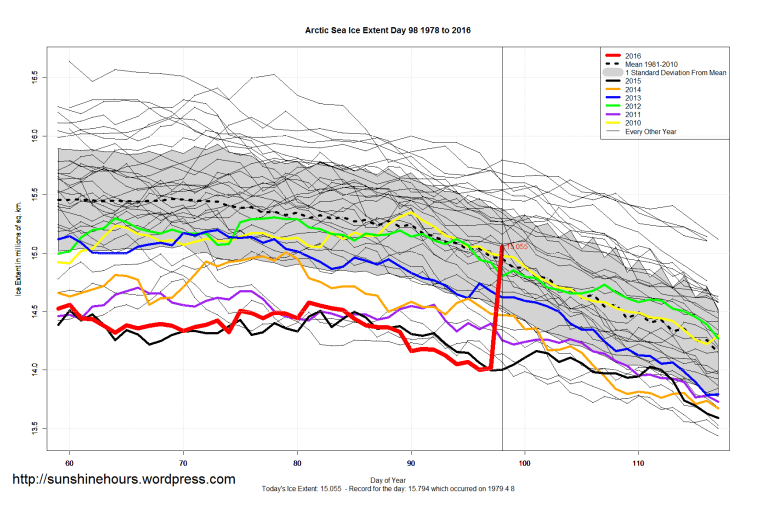
If you have been following this blog, you know the NSIDC satellite data has been very bad. Off by millions of sq km.
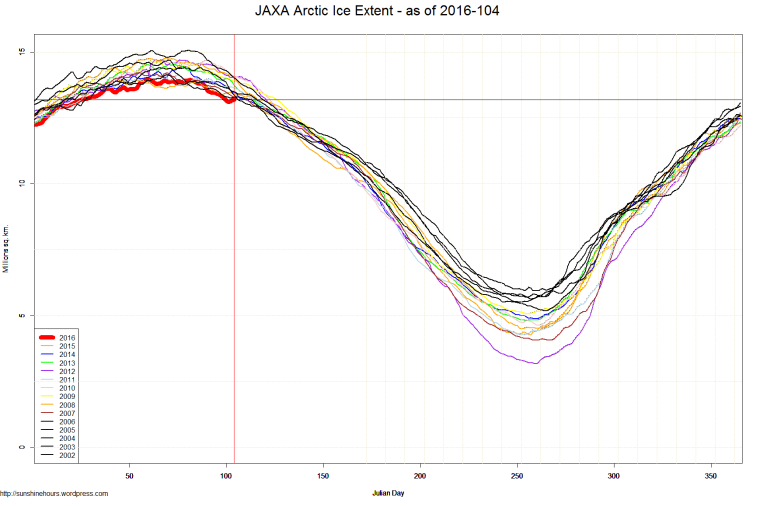
So I will be posting graphs for sea ice extent using data from JAXA (only goes back to 2002).

If you have been following this blog, you know the NSIDC satellite data has been very bad. Off by millions of sq km.
So I will be posting graphs for sea ice extent using data from JAXA (only goes back to 2002).
If you have been following this blog, you know the NSIDC satellite data has been very bad. Off by millions of sq km.
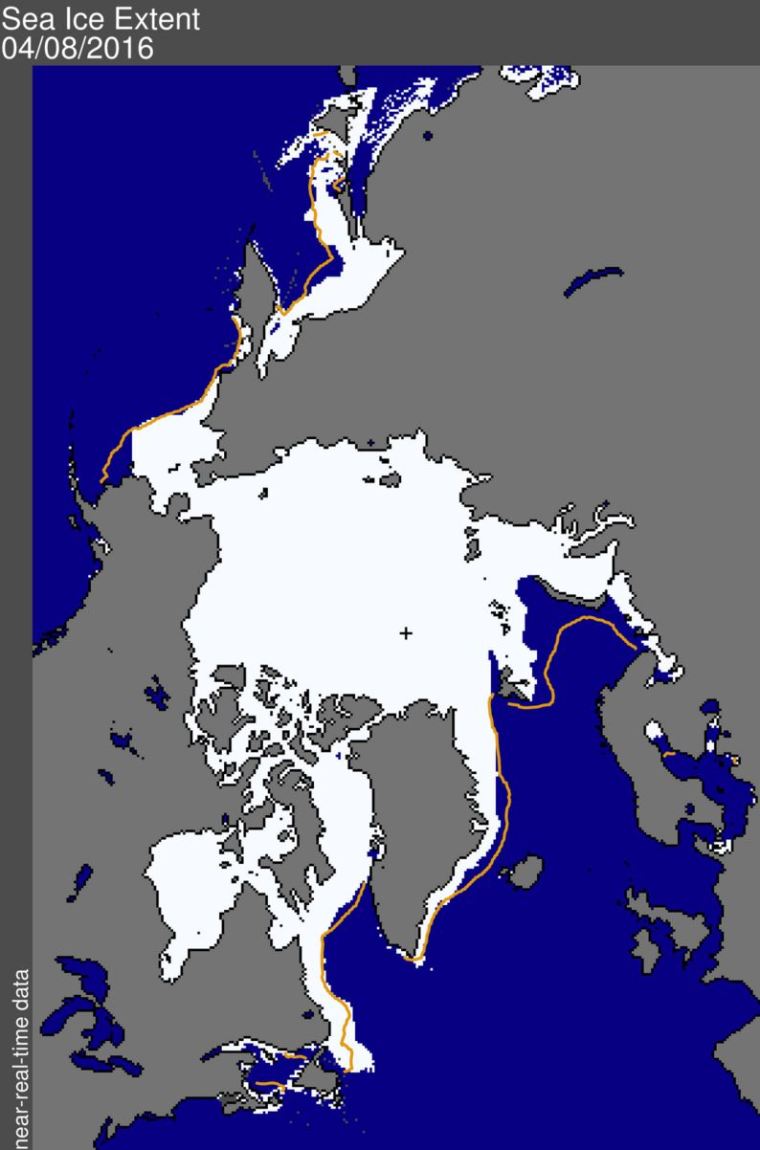
As of this morning the data file his missing all data past March 31 2016. And NSIDC posted this:
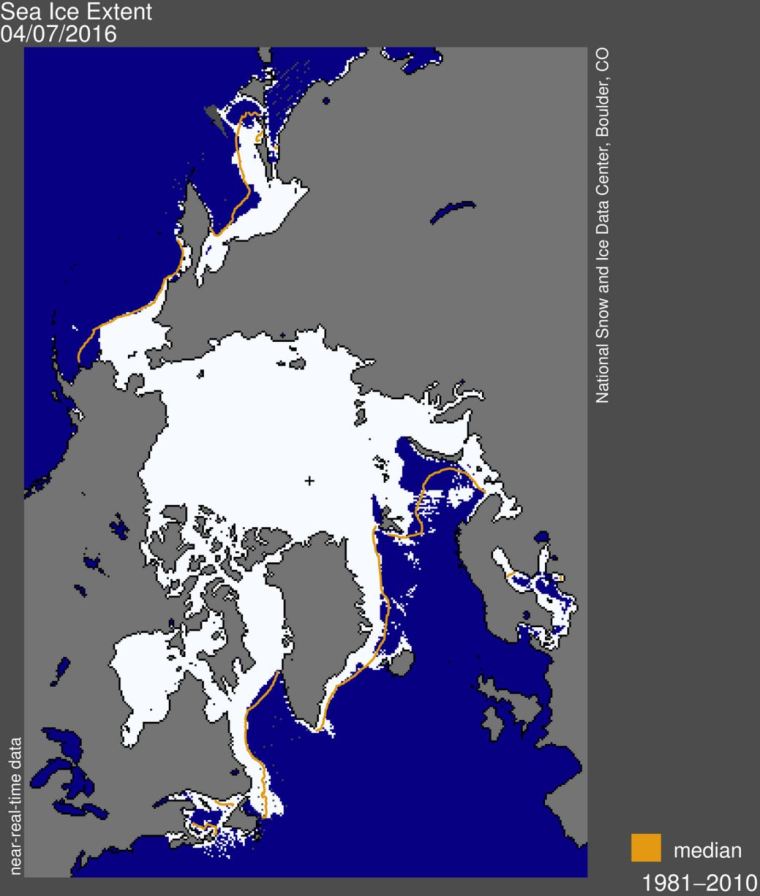
NSIDC has suspended daily sea ice extent updates until further notice, due to issues with the satellite data used to produce these images. The vertically polarized 37 GHz channel (37V) of the Special Sensor Microwave Imager and Sounder (SSMIS) on the Defense Meteorological Satellite Program (DMSP) F-17 satellite that provides passive microwave brightness temperatures is providing spurious data. The 37V channel is one of the inputs to the sea ice retrieval algorithms, so this is resulting in erroneous estimates of sea ice concentration and extent. The problem was initially seen in data for April 5 and all data since then are unreliable, so we have chosen to remove all of April from NSIDC’s archive.
It is unknown at this time if or when the problem with F-17 can be fixed. In the event that the sensor has permanently failed, NSIDC is working to transition to either the DMSP F-18 or possibly the JAXA Advanced Microwave Scanning Radiometer 2 (AMSR2) on the Global Change Observation Mission – Water (GCOM-W) satellite. Transitioning to a different satellite will require a careful calibration against the F-17 data to ensure consistency over the long-term time series. While this transition is of high priority, NSIDC has no firm timeline on when it will be able to resume providing the sea ice time series. For background information on the challenges of using data in near-real-time, see the ASINA FAQ, “Do your data undergo quality control?”
I have no idea what is the right data. The NSIDC says:
“The daily sea ice extent images are sporadically displaying erroneous data. NSIDC is investigating with our satellite data providers.”
After they fix the satellite I’ll have to decide whether to snooth the data or leave it as is. Maybe I’ll have a poll!


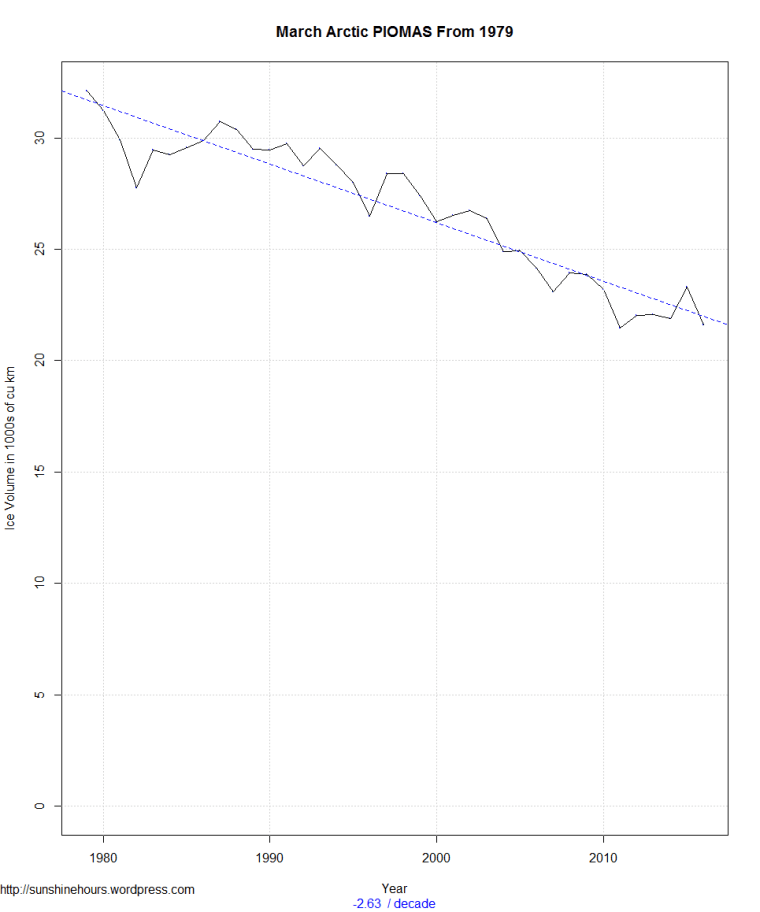
PIOMAS is: “Sea Ice Volume is calculated using the Pan-Arctic Ice Ocean Modeling and Assimilation System (PIOMAS, Zhang and Rothrock, 2003) developed at APL/PSC. Anomalies for each day are calculated relative to the average over the 1979 -2014 period for that day of the year to remove the annual cycle.”
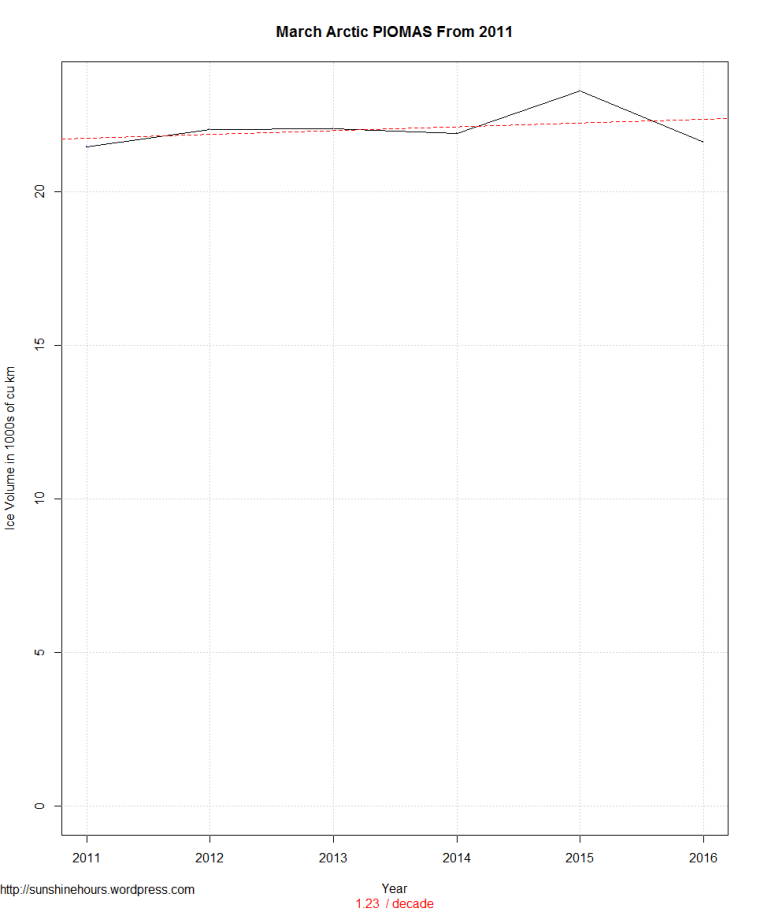
The PIOMAS daily data is up to the end of March 2016. Both graphs are just March. First graph is from 2011. Second is from 1979.
The “death spiral” for March PIOMAS ended in 2011.
References:
Volume time series and uncertainties:
Schweiger, A., R. Lindsay, J. Zhang, M. Steele, H. Stern, Uncertainty in modeled arctic sea ice volume, J. Geophys. Res., doi:10.1029/2011JC007084, 2011
Model details:
Zhang, J.L. and D.A. Rothrock, “Modeling global sea ice with a thickness and enthalpy distribution model in generalized curvilinear coordinates“, Mon. Weather Rev., 131, 845-861, 2003