

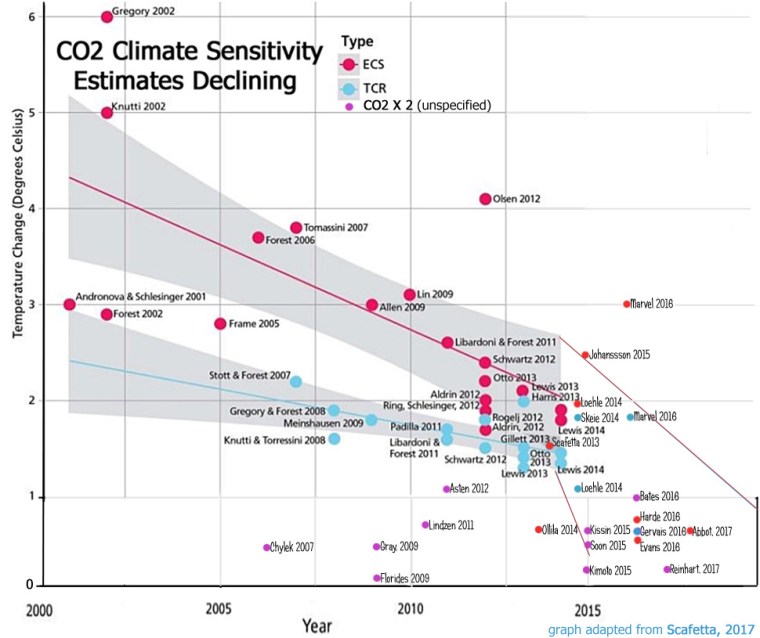
The Shrinking CO2 Climate Sensitivity
Once upon a time the estimated effects of a doubling of CO2 where as high as 6C.
Now they approach zero. Read the rest at the source – NoTricksZone.
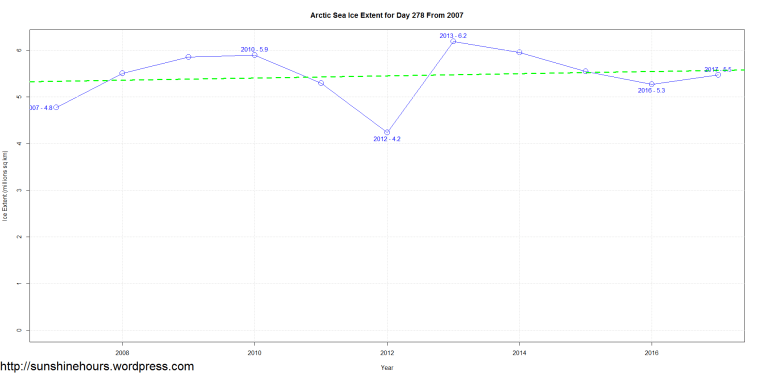
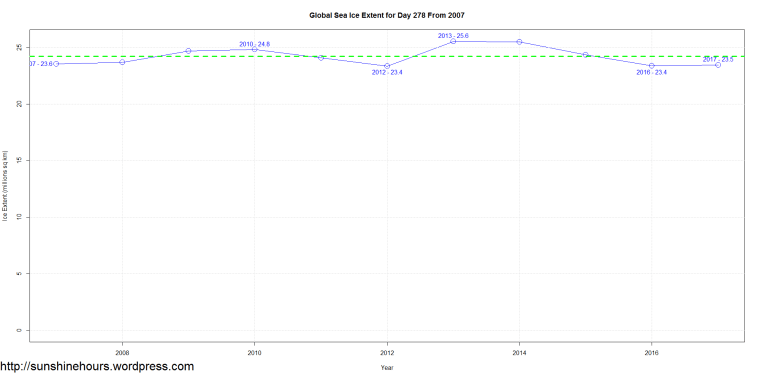
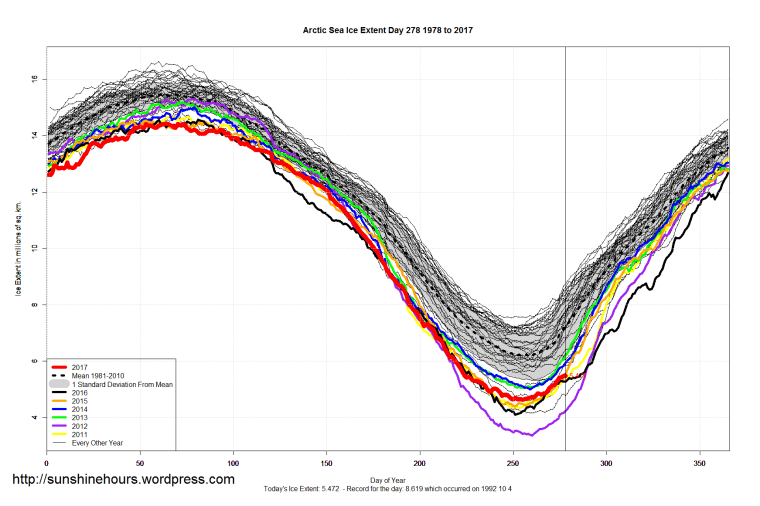
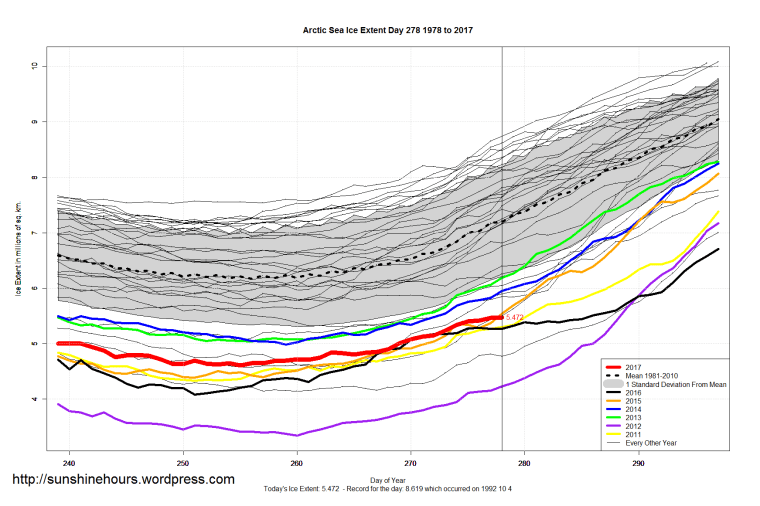
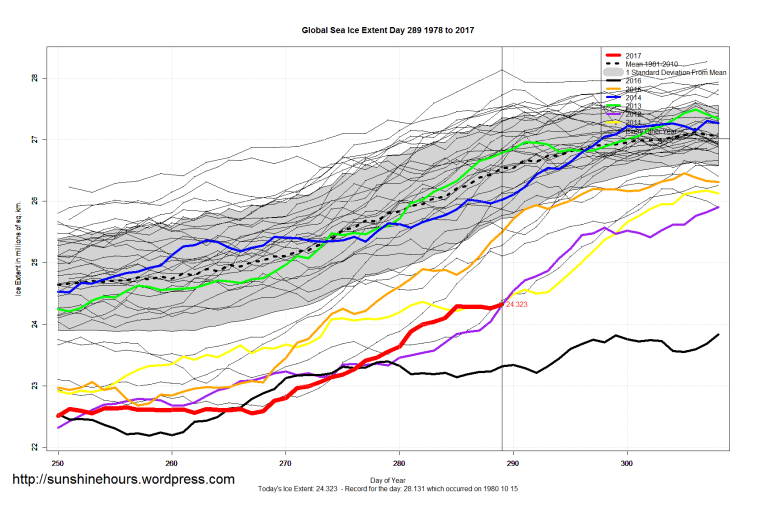
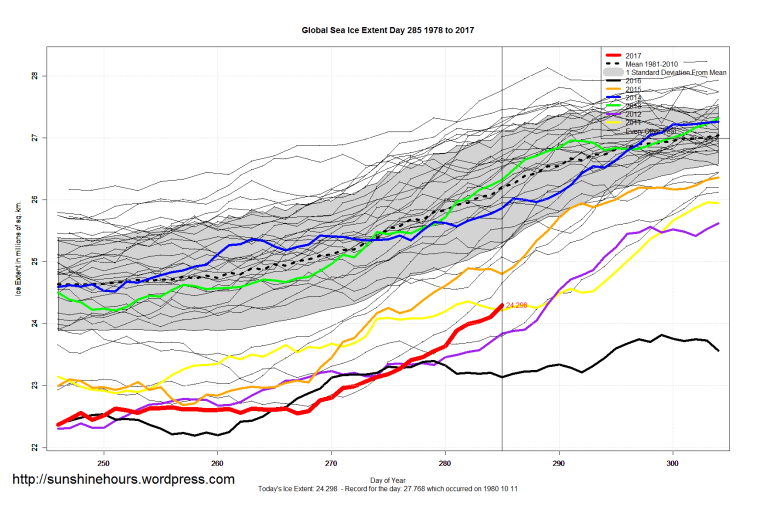
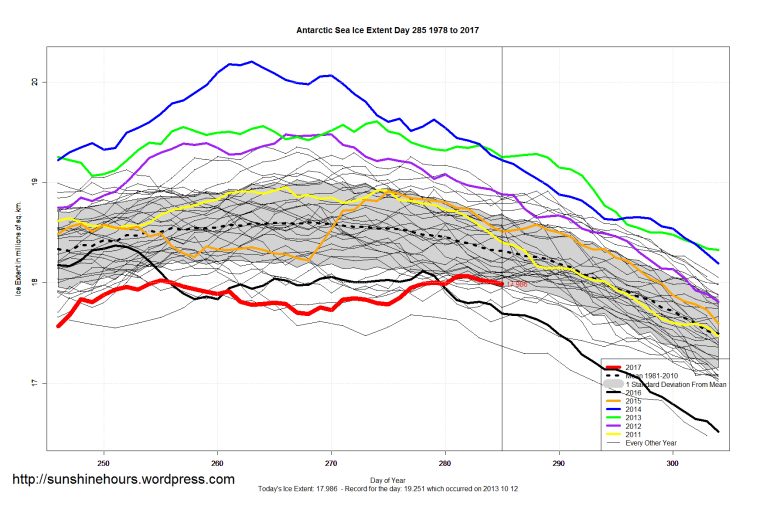
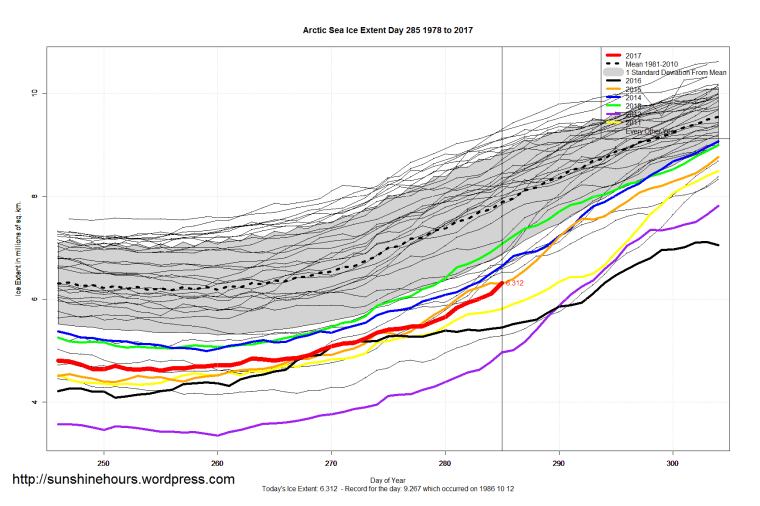
Sea Ice Extent (Global Antarctic and Arctic) – Day 285 – 2017
Sea Ice Extent (Global Antarctic and Arctic) – Day 284 – 2017


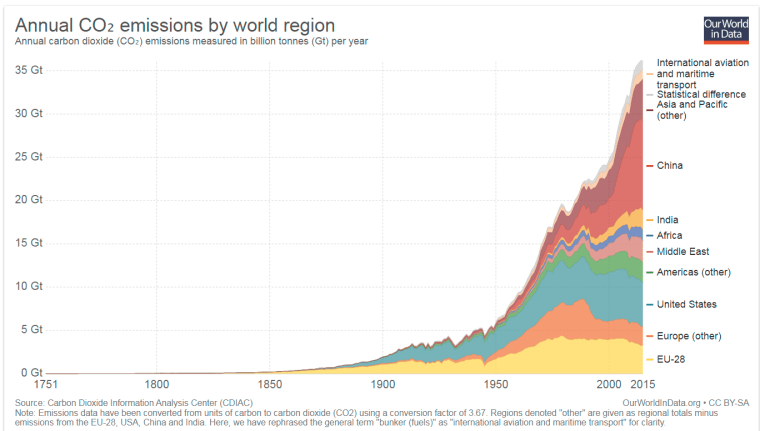
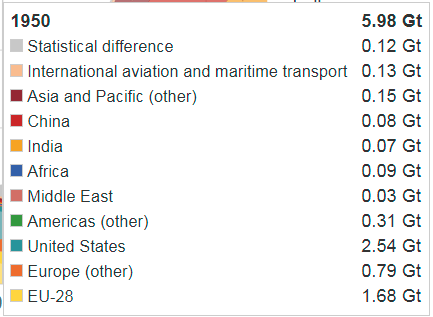
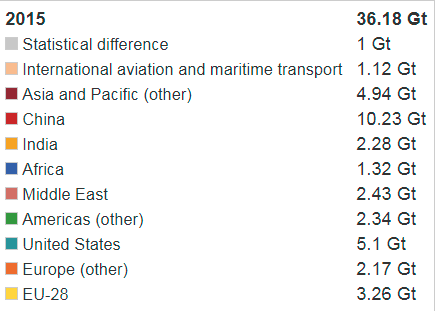
Global CO2 2015 vs 1950
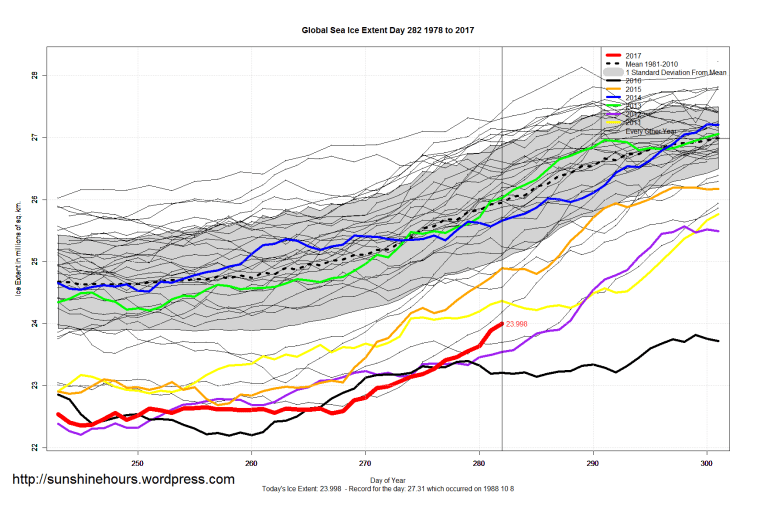
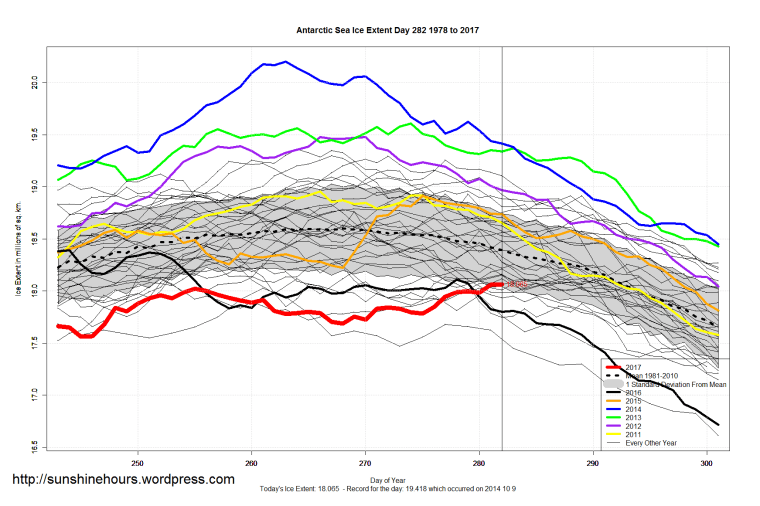
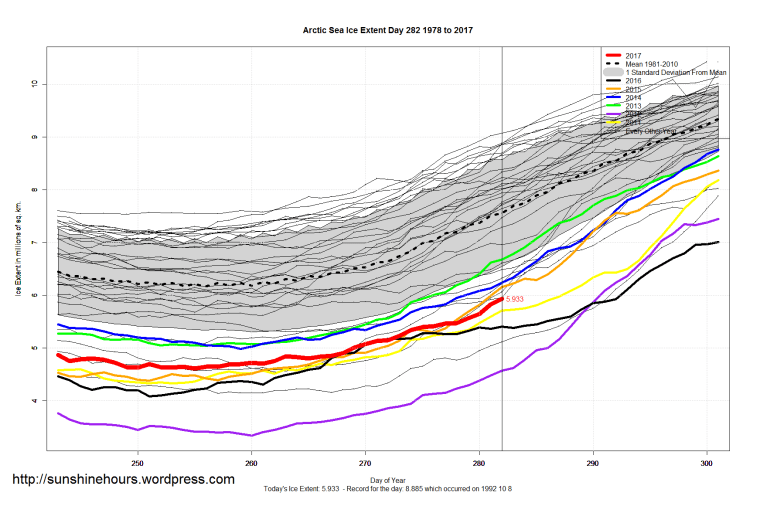
Sea Ice Extent (Global Antarctic and Arctic) – Day 282 – 2017
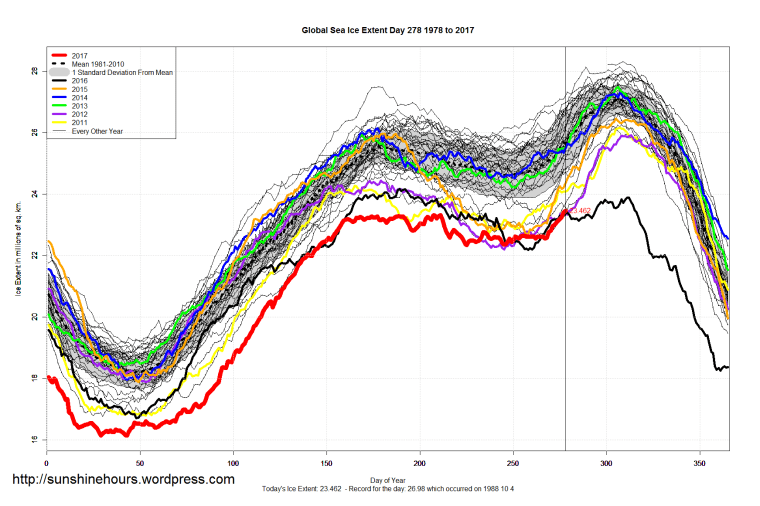
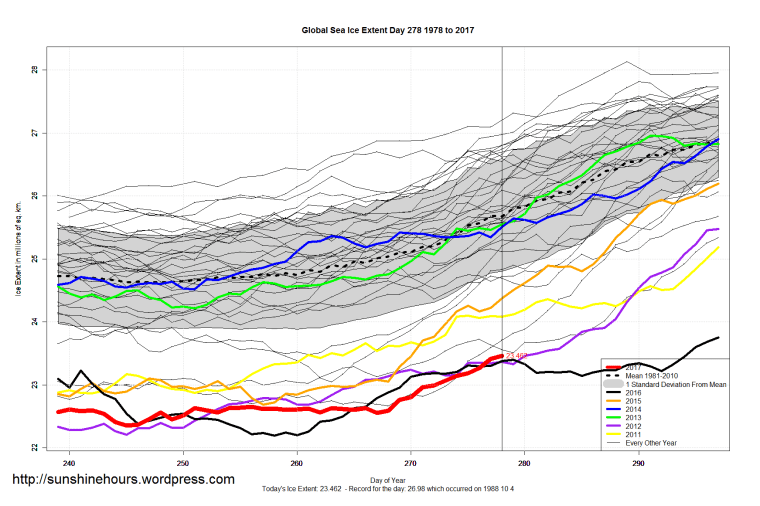
Sea Ice Extent (Global Antarctic and Arctic) – Day 281 – 2017
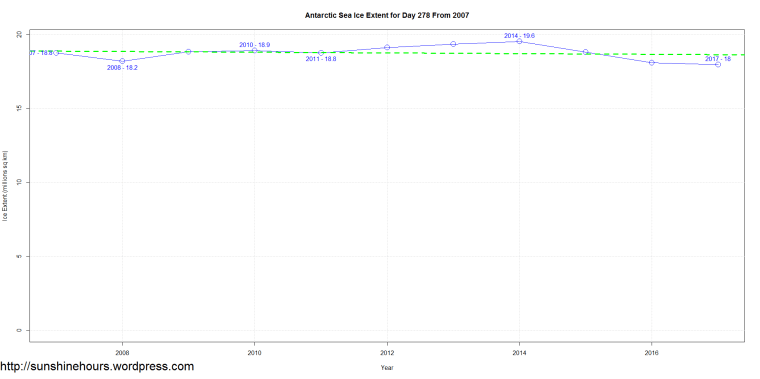
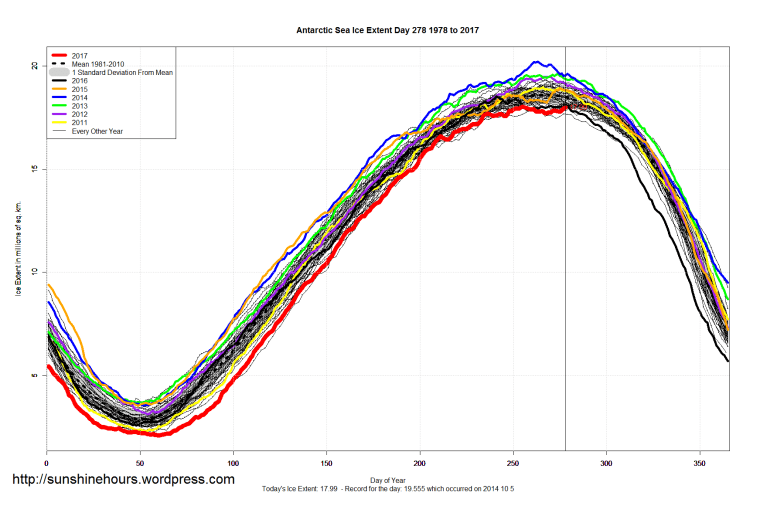
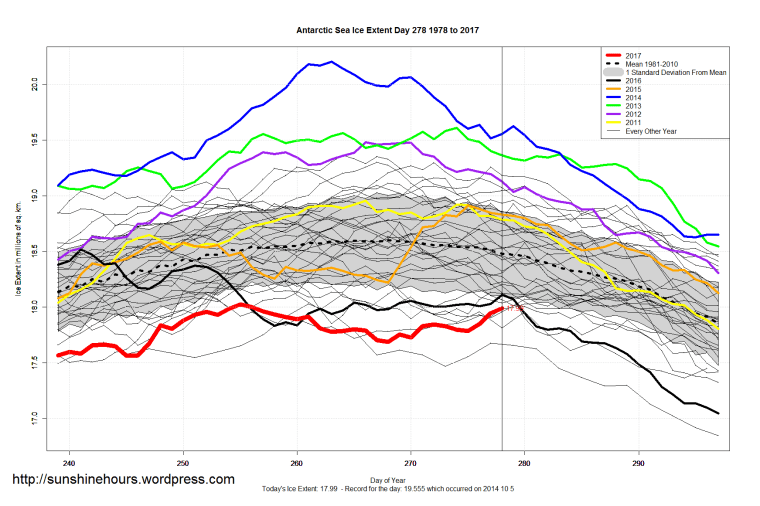
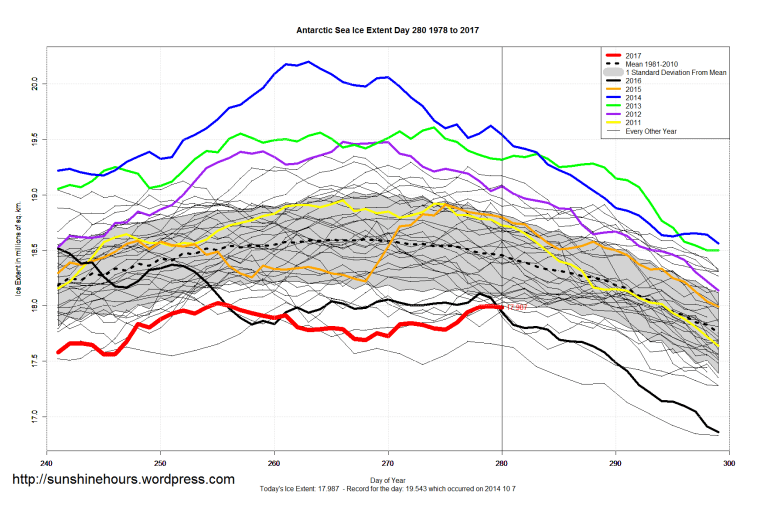
A late surge in Antarctica means 2017 won’t be the lowest maximum. That honor stays with 1986.
These are the Antarctica records for max and min sorted by max descending.
(Preliminary for 2017 because it may climb some more)
| Year | Min | Max | day Max | day Min | Avg Anomaly |
| 2014 | 3.548 | 20.201 | 263 | 52 | 1.146198915341 |
| 2013 | 3.679 | 19.608 | 274 | 50 | 0.893678367396 |
| 2012 | 3.111 | 19.478 | 266 | 54 | 0.387147239929 |
| 2006 | 2.487 | 19.36 | 264 | 51 | -0.169014783289 |
| 2009 | 2.671 | 19.299 | 267 | 53 | 0.418664668766 |
| 2005 | 2.804 | 19.295 | 272 | 49 | 0.064952339999 |
| 1998 | 2.772 | 19.244 | 258 | 56 | 0.108445490684 |
| 2000 | 2.582 | 19.159 | 272 | 49 | 0.129936857415 |
| 2004 | 3.259 | 19.124 | 252 | 51 | 0.344207349218 |
| 1980 | 2.521 | 19.092 | 267 | 57 | -0.380114783289 |
| 2007 | 2.723 | 19.086 | 272 | 50 | 0.057179737259 |
| 2010 | 2.842 | 18.998 | 249 | 47 | 0.476864668766 |
| 1999 | 2.707 | 18.981 | 273 | 51 | 0.130755079725 |
| 2011 | 2.319 | 18.954 | 266 | 53 | -0.129354509316 |
| 1985 | 2.602 | 18.931 | 254 | 50 | -0.009151681391 |
| 2015 | 3.544 | 18.912 | 275 | 49 | 0.784128253241 |
| 1981 | 2.694 | 18.856 | 261 | 51 | -0.200536701097 |
| 1996 | 2.597 | 18.831 | 267 | 56 | 0.151838496759 |
| 1994 | 3.083 | 18.827 | 243 | 43 | 0.144042750958 |
| 1983 | 2.843 | 18.811 | 263 | 55 | -0.247642180549 |
| 1997 | 2.264 | 18.792 | 265 | 58 | -0.239875057261 |
| 1988 | 2.639 | 18.785 | 277 | 55 | -0.119385162225 |
| 1995 | 3.33 | 18.762 | 269 | 55 | 0.164829052328 |
| 1993 | 2.281 | 18.71 | 263 | 50 | -0.209987386028 |
| 2003 | 3.626 | 18.68 | 268 | 48 | 0.339360559177 |
| 1991 | 2.554 | 18.671 | 273 | 58 | -0.085053139453 |
| 1982 | 2.89 | 18.55 | 246 | 54 | 0.016407547259 |
| 1987 | 3.01 | 18.524 | 258 | 52 | -0.184921590324 |
| 2016 | 2.578 | 18.518 | 241 | 48 | -0.46177898958 |
| 2001 | 3.441 | 18.494 | 271 | 50 | 0.042697545478 |
| 1992 | 2.492 | 18.467 | 255 | 54 | -0.218672432202 |
| 1990 | 2.784 | 18.379 | 273 | 53 | -0.220332591508 |
| 1984 | 2.382 | 18.37 | 266 | 58 | -0.168233781332 |
| 1979 | 2.911 | 18.361 | 256 | 48 | 0.078581100978 |
| 2008 | 3.692 | 18.298 | 247 | 51 | 0.622117185284 |
| 1989 | 2.723 | 18.274 | 266 | 51 | -0.204247660001 |
| 2002 | 2.697 | 18.116 | 252 | 51 | -0.408318892878 |
| 2017 | 2.075 | 18.06 | 281 | 60 | |
| 1986 | 2.953 | 18.027 | 261 | 65 | -0.548503824385 |

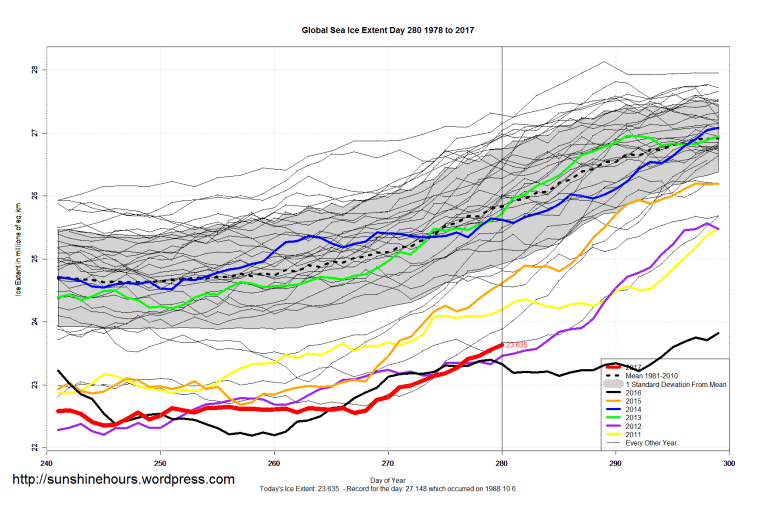
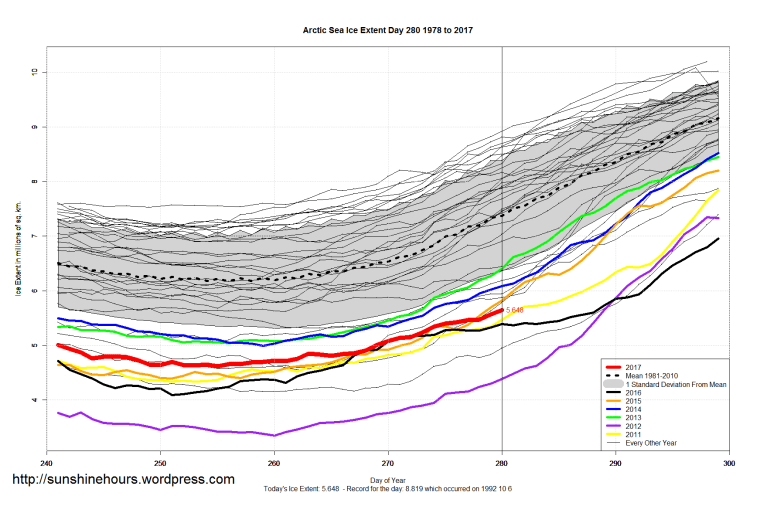
Sea Ice Extent (Global Antarctic and Arctic) – Day 280 – 2017
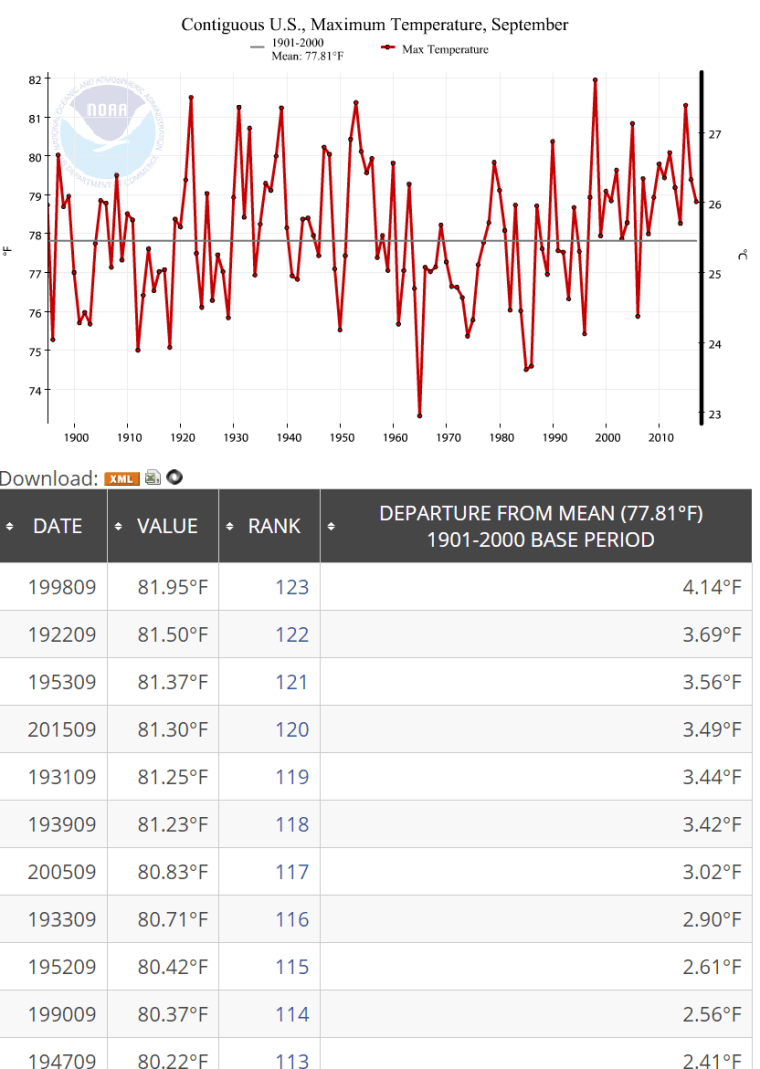
NOAA September 2017 – 83rd Maximum Temperature Out of 123
According to the NOAA, September 2017 ranked 83rd out of 123 using the Maximum temperature.
2017 was 3F colder than 1998.
The 10 warmest Septembers: 1998, 1922, 1953, 2015, 1931, 1939, 2005, 1933, 1952, 1990