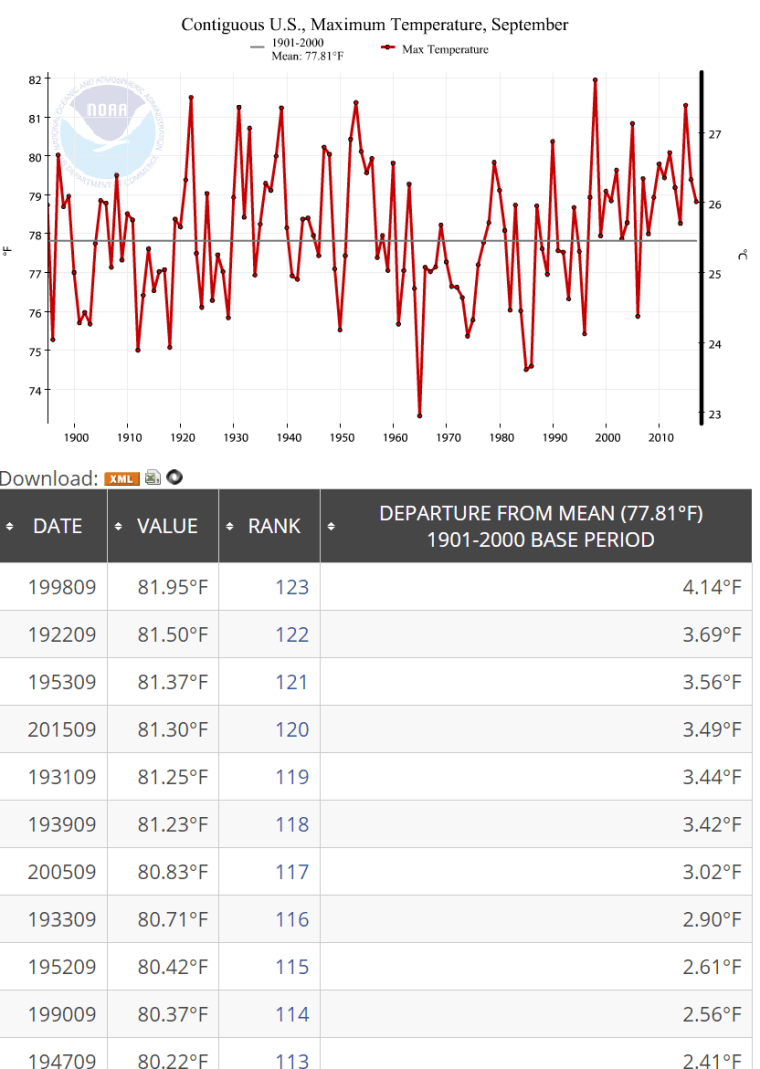
According to the NOAA, September 2017 ranked 83rd out of 123 using the Maximum temperature.
2017 was 3F colder than 1998.
The 10 warmest Septembers: 1998, 1922, 1953, 2015, 1931, 1939, 2005, 1933, 1952, 1990
According to the NOAA, September 2017 ranked 83rd out of 123 using the Maximum temperature.
2017 was 3F colder than 1998.
The 10 warmest Septembers: 1998, 1922, 1953, 2015, 1931, 1939, 2005, 1933, 1952, 1990
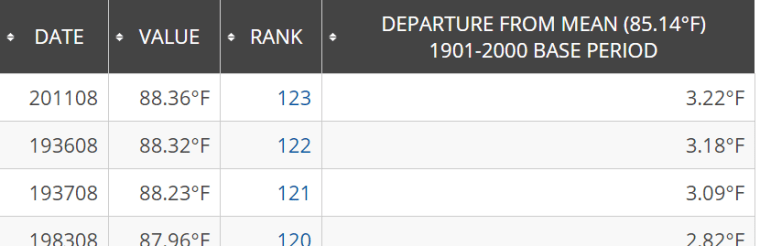
According to the NOAA, August 2017 ranked 30th out of 123 using the Maximum temperature.
A rank of 1 is coldest. A rank of 123 is warmest.
-0.87F below the 1901 to 2000 average.
4F colder than August 2011, 1936 and 1937.

The top 3.
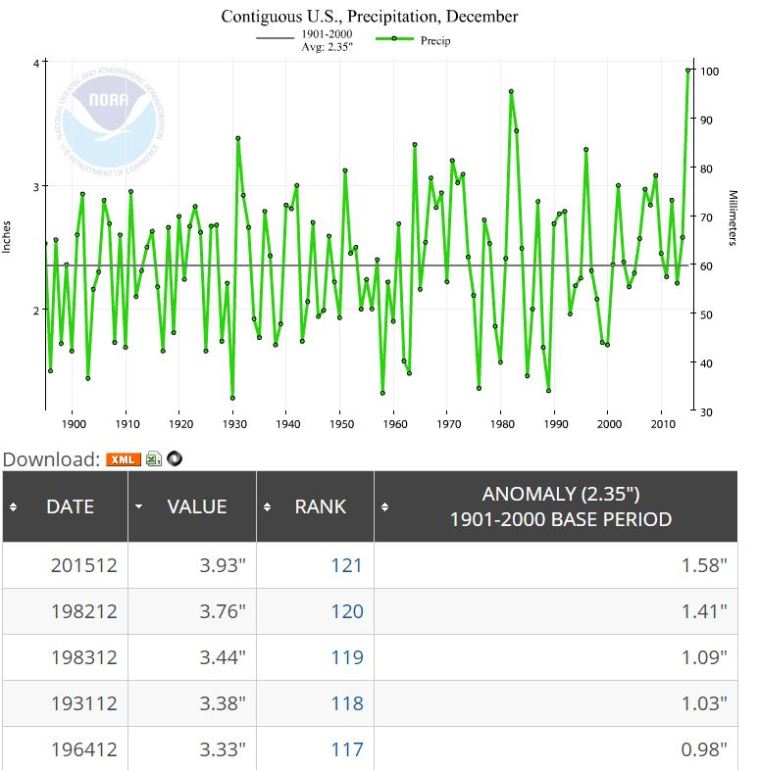
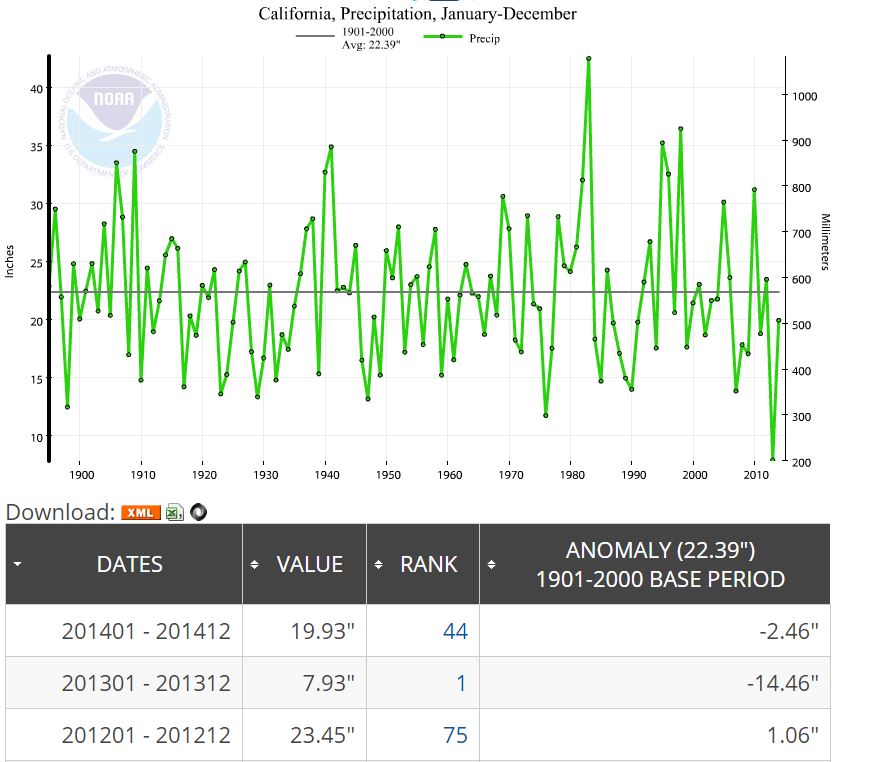
According to the NOAA, 2014 precipitation in California was -2.46″ below the 1901-2000 average.
That is Only 11%. What Megadrought? (The real problem is a doubling of population and no big dams built since 1982).
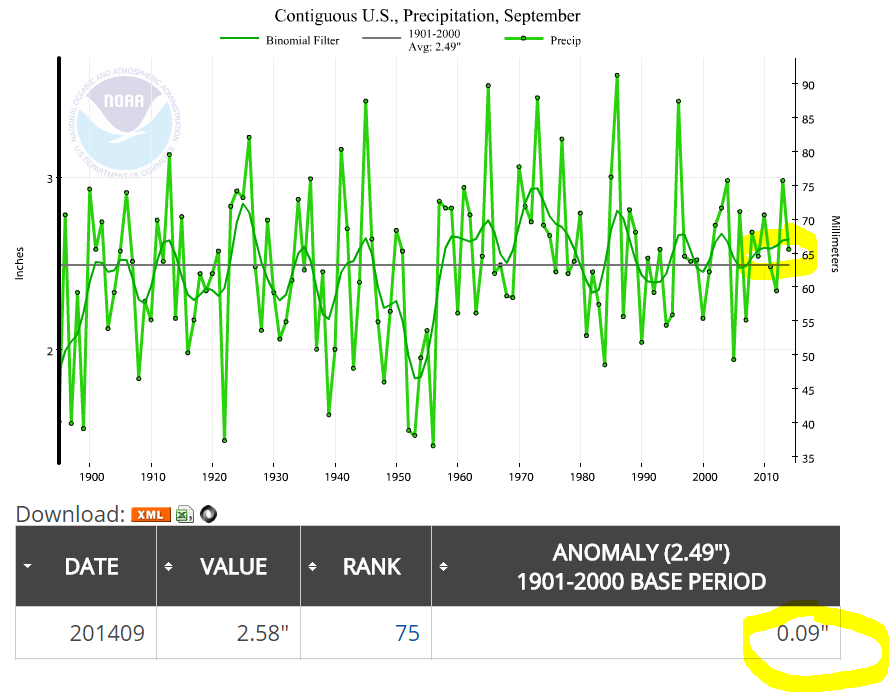
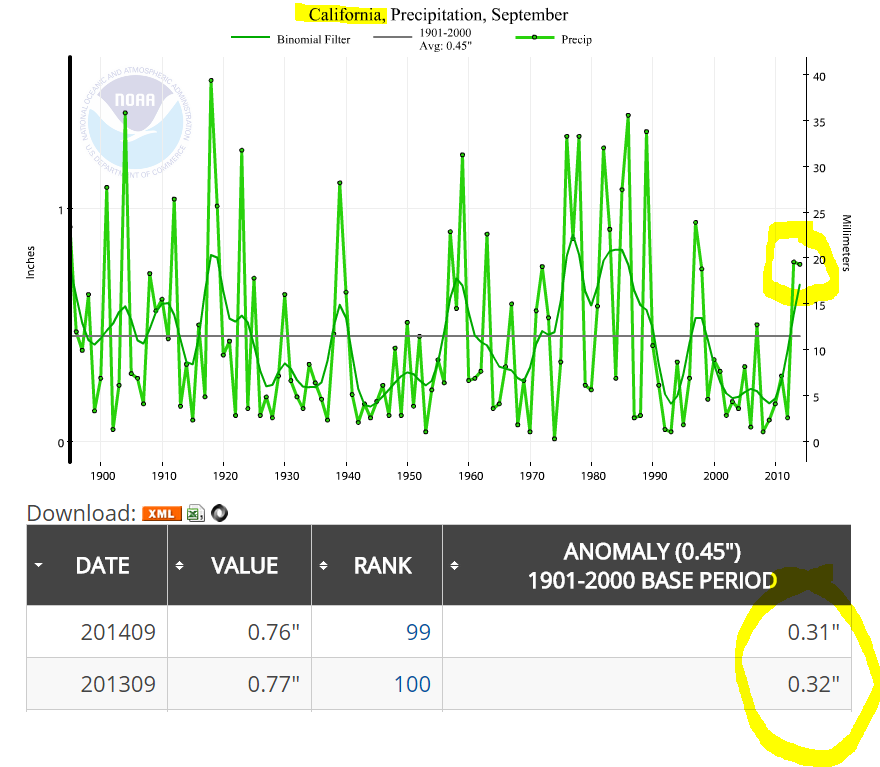
According to the NOAA, September 2014 in California was 0.31″ above the 1901-2000 average. 2013 was .32″ Above Normal.
According to the NOAA, September 2014 ranked 68th coldest out of 120 using the Maximum temperature.
The 10 warmest Septembers: 1998, 1922, 1953, 1931, 1939, 2005, 1933, 1952, 1990, 1947.

According to the NOAA, August 2014 ranked 110th wettest out of 120 (120 is wettest). 0.48″ above the 1901-2000 average.
The last August that was wetter was 1977.

According to the NOAA, August 2014 ranked 28th coldest out of 120 using the Maximum temperature. Average temperature is ranked 68th out of 120.

According to the NOAA, for Illionois, July 2014 ranked 2nd coldest out of 120 using the Maximum temperature.
The average max in July 1936 was 97.2. In July 2014 it was 81F. That means it was 16.2F colder .