
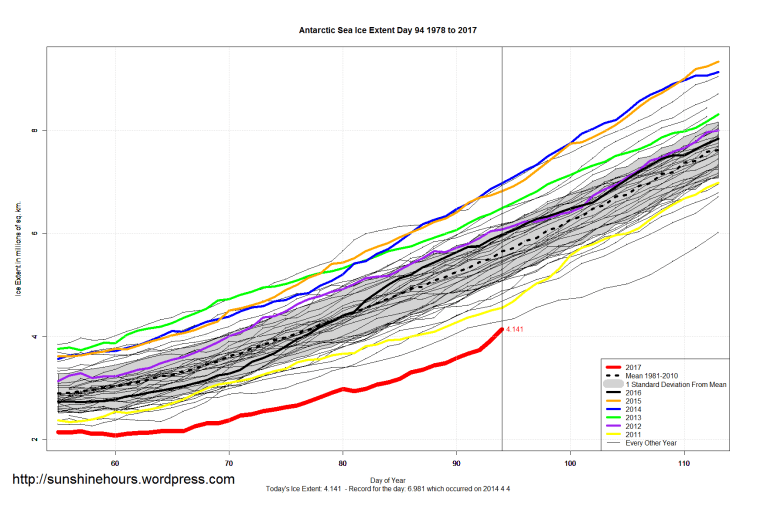

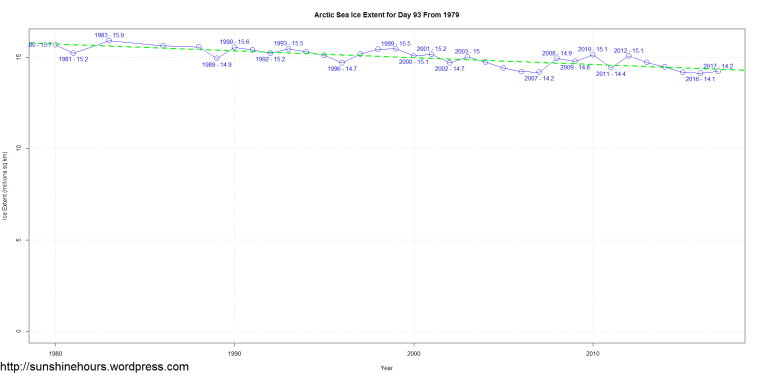
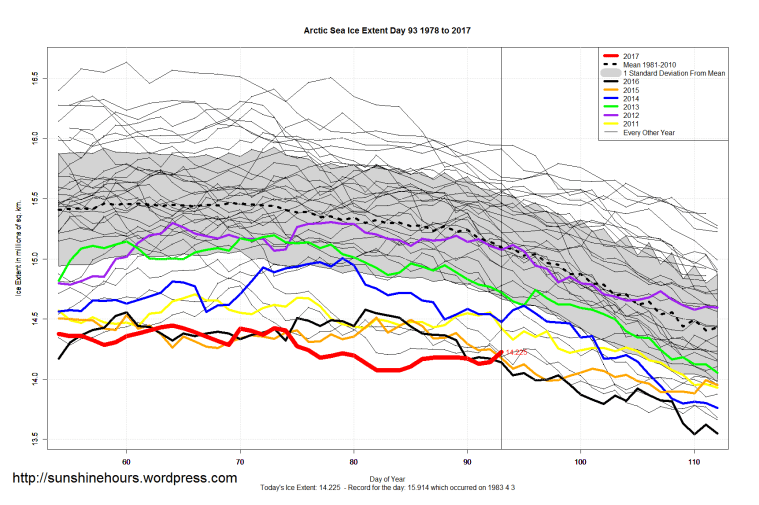
Sea Ice Extent (Global Antarctic and Arctic) – Day 93 – 2017
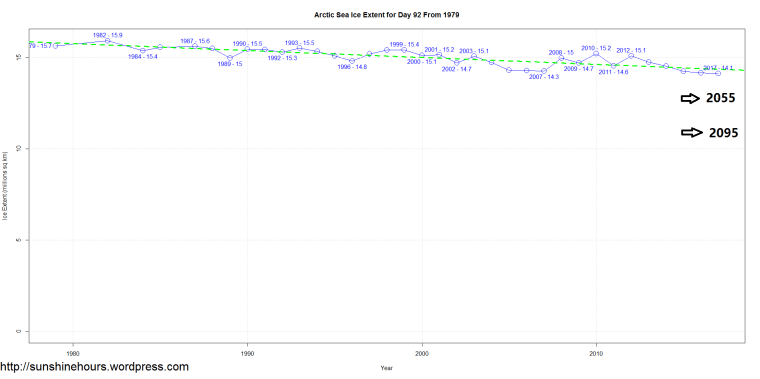
Sea Ice Extent (Global Antarctic and Arctic) – Day 92 – 2017
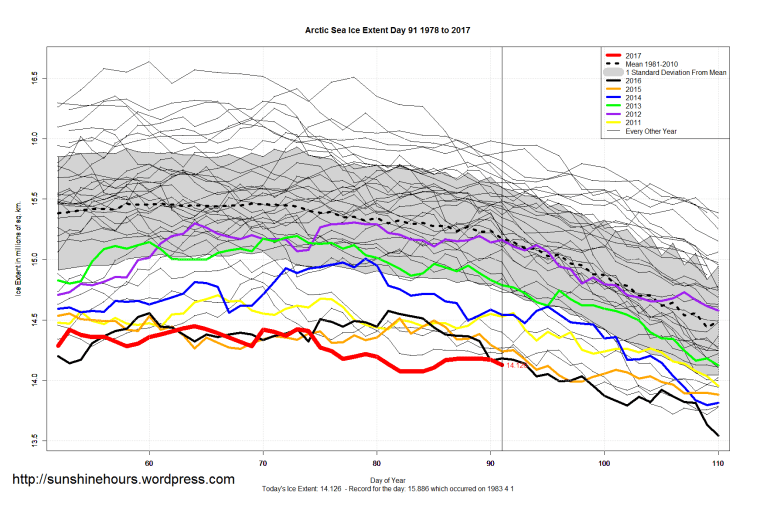
Sea Ice Extent (Global Antarctic and Arctic) – Day 91 – 2017


Sea Ice Extent (Global Antarctic and Arctic) – Day 87 – 2017


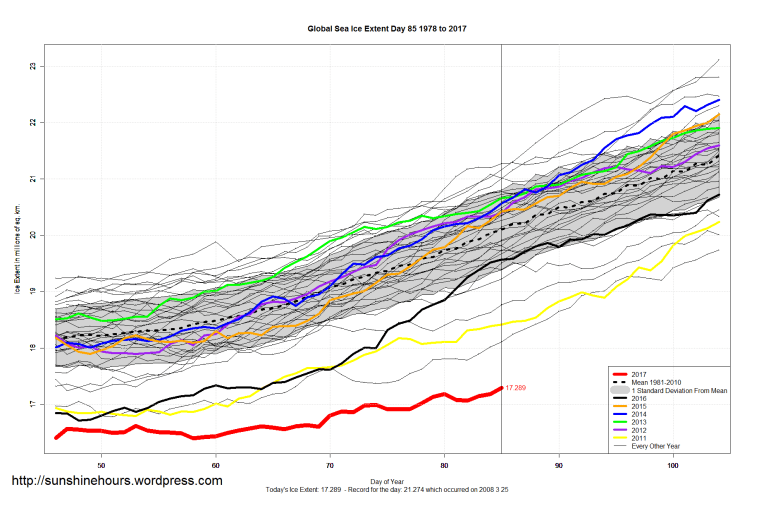
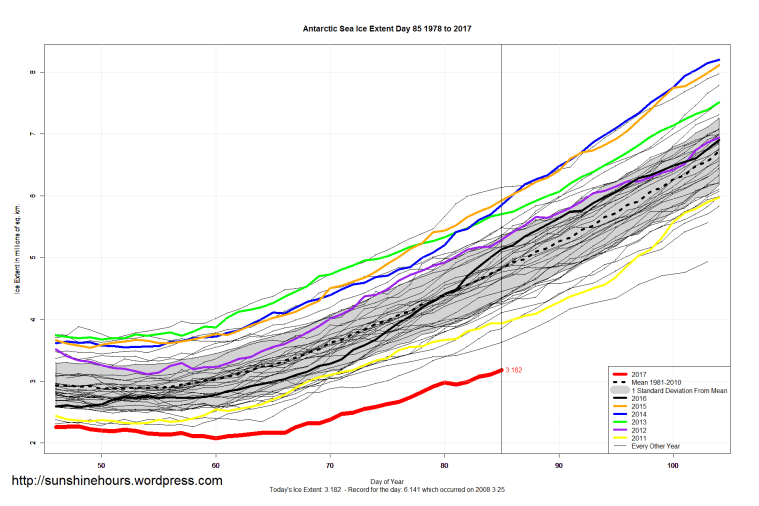
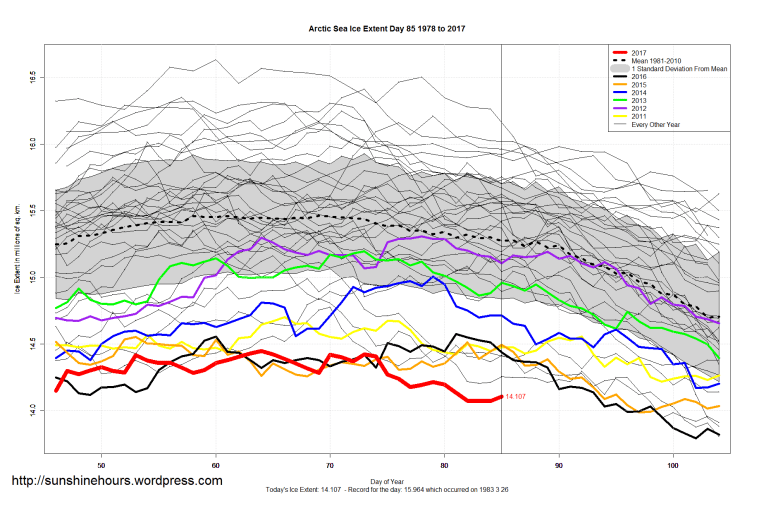
Sea Ice Extent (Global Antarctic and Arctic) – Day 85 – 2017
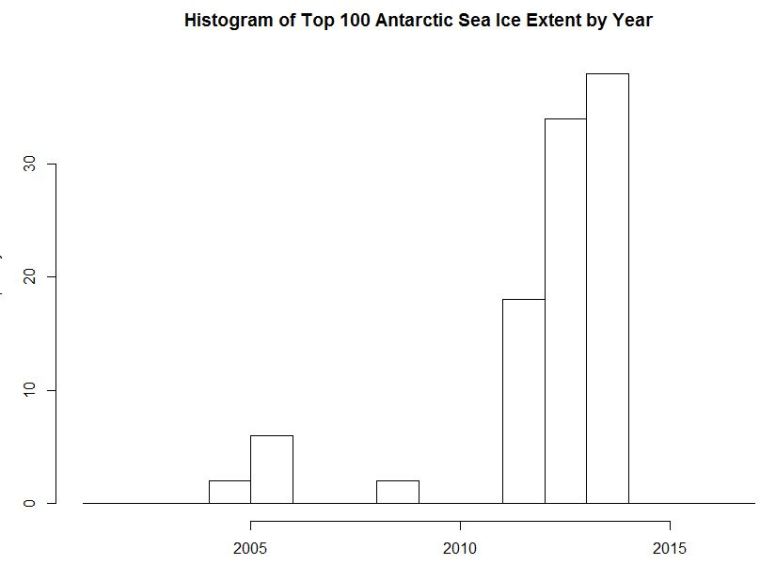
Top 100 Antarctic Sea Ice Extent Histogram
Top 100 Antarctic Sea Ice Extent’s
400,000 years ago – All of Greenland Melted – No SUVs
The interglacial ~400,000 years ago was lot hotter. And there were no SUVs or coal power plants.
“A paper published … in Palaeogeography, Palaeoclimatology, Palaeoecology finds that the last 4 interglacials were up to 3C warmer than the current interglacial and were characterized by sea levels up to 79 feet [24 meters] higher than the present. According to the authors, “The most conservative estimates of palaeo-sea level during [the interglacial ~400,000 years ago] would require an ice mass loss equivalent to all of the modern Greenland and West Antarctic ice sheets; the more extreme estimates would require additional ice mass loss from the East Antarctic ice sheet.”
Thus, during prior interglacials, sea surface temperatures were up to 3 °C warmer, sea levels were up to 79 feet higher than the present, and up to all of the Greenland and West Antarctic ice sheets melted away. All of this occurred naturally and at “safe” levels of CO2. Thus, there is no evidence that climate change within the present interglacial is any different, unprecedented, unnatural, unusual, or due to man-made CO2.”
(h/t Hockey Schtick)
Morons and Ice Sheets
Think about this.
“The last piece of the ice sheet that once blanketed much of North America is doomed to disappear in the next several centuries, says a new study by researchers at Simon Fraser University in British Columbia and the University of Colorado Boulder.”
Sad to say SFU is my alma mater.
“The Barnes Ice Cap, a Delaware-sized feature on Baffin Island in the Canadian Arctic, is melting at a rapid pace, driven by increased greenhouse gases in the atmosphere that have elevated Arctic temperatures. The ice cap, while still 500 meters thick, is slated to melt in about 300 years under business-as-usual greenhouse gas emissions.”
They love predictions that won’t come true for 300 years. It won’t interfere in the grant money harvesting.
“The results provide compelling evidence that the current level of warming is almost unheard of in the past 2.5 million years, according to the authors. Only three times at most in that time period has the Barnes Ice Cap been so small, a study of isotopes created by cosmic rays that were trapped in rocks around the Barnes Ice Cap indicated.”
Wait … “almost unheard of”? Almost?
Wait … “Only three times at most”?
“This is the disappearance of a feature from the last glacial age, which would have probably survived without anthropogenic greenhouse gas emissions,”
Probably?
“The geological data is pretty clear that the Barnes Ice Cap almost never disappears in the interglacial times,”
Almost never?
Sea Ice Extent (Global Antarctic and Arctic) – Day 80 – 2017
Arcic has probably set a record for lowest maximum on day 64. (The most recent data is day 80).
| Year | Min | Max | day of Max | day of Min | Avg_Anomaly |
| 2017 | 14.447 | 64 | |||
| 2015 | 4.387 | 14.554 | 53 | 251 | -1.068740658829 |
| 2016 | 4.083 | 14.576 | 81 | 251 | -1.489204287005 |
| 2011 | 4.333 | 14.704 | 66 | 251 | -1.151061206774 |
| 2006 | 5.746 | 14.777 | 70 | 257 | -0.861943398555 |
| 2007 | 4.147 | 14.842 | 69 | 257 | -1.160461206774 |
| 2005 | 5.314 | 14.993 | 68 | 263 | -0.727581754719 |
| 2014 | 4.988 | 15.007 | 79 | 259 | -0.844061206774 |
| 2009 | 5.047 | 15.195 | 61 | 255 | -0.702587234171 |
| 2013 | 5.04 | 15.196 | 73 | 256 | -0.737442028692 |
| 2004 | 5.77 | 15.3 | 70 | 262 | -0.399463849847 |
| 2012 | 3.34 | 15.307 | 78 | 260 | -1.233799915421 |
| 2010 | 4.59 | 15.351 | 90 | 262 | -0.923165316363 |
| 2008 | 4.548 | 15.354 | 58 | 262 | -0.662051281541 |
| 1995 | 6.012 | 15.384 | 90 | 247 | -0.219447508144 |
| 1996 | 7.147 | 15.484 | 52 | 254 | 0.200888609169 |
| 2000 | 5.943 | 15.498 | 63 | 255 | -0.131723412688 |
| 1992 | 7.159 | 15.576 | 72 | 251 | 0.470582598241 |
| 2002 | 5.625 | 15.624 | 68 | 261 | -0.27169134376 |
| 1999 | 5.676 | 15.627 | 89 | 255 | 0.05690865624 |
| 2003 | 5.969 | 15.629 | 79 | 260 | -0.237335179377 |
| 1991 | 6.259 | 15.647 | 56 | 259 | 0.114700437062 |
| 1997 | 6.602 | 15.684 | 79 | 246 | 0.033056601445 |
| 2001 | 6.567 | 15.742 | 63 | 262 | -0.034540658829 |
| 1989 | 6.888 | 15.766 | 65 | 265 | 0.332297697336 |
| 1994 | 6.934 | 15.77 | 52 | 248 | 0.376760711034 |
| 1981 | 6.902 | 15.801 | 73 | 253 | 0.49516345076 |
| 1984 | 6.396 | 15.809 | 78 | 260 | 0.272841947825 |
| 1993 | 6.161 | 16.048 | 72 | 256 | 0.288494957609 |
| 1998 | 6.293 | 16.07 | 56 | 260 | 0.122823724733 |
| 1986 | 7.122 | 16.158 | 69 | 249 | 0.568586738431 |
| 1985 | 6.486 | 16.163 | 76 | 252 | 0.357959847693 |
| 1990 | 6.011 | 16.249 | 71 | 264 | 0.059283998705 |
| 1987 | 6.89 | 16.293 | 52 | 245 | 0.613975225596 |
| 1980 | 7.533 | 16.302 | 65 | 249 | 0.694625094596 |
| 1988 | 7.048 | 16.309 | 70 | 255 | 0.534692920098 |
| 1982 | 7.16 | 16.325 | 58 | 256 | 0.810824861467 |
| 1983 | 7.204 | 16.412 | 73 | 251 | 0.696560711034 |
| 1979 | 6.895 | 16.635 | 60 | 264 | 0.689988773313 |
