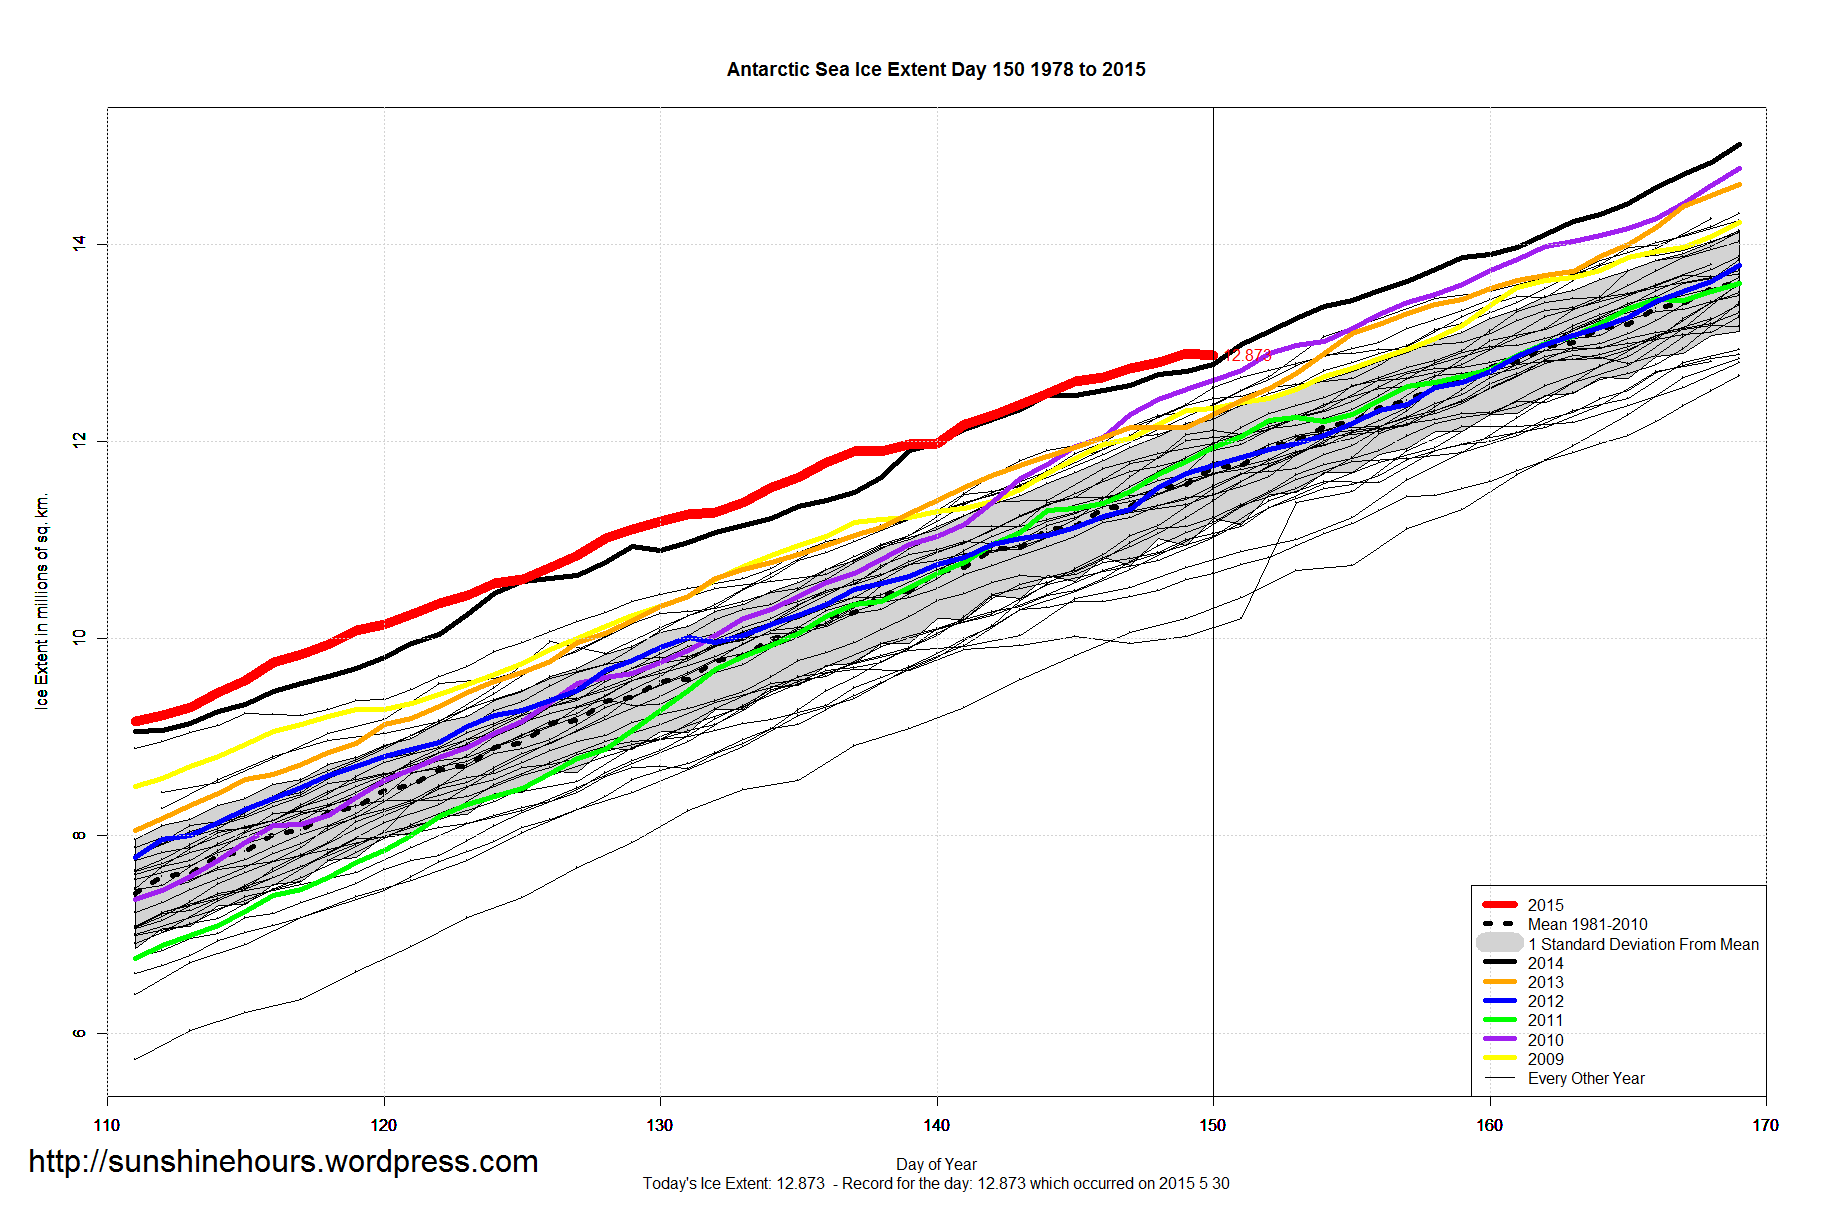
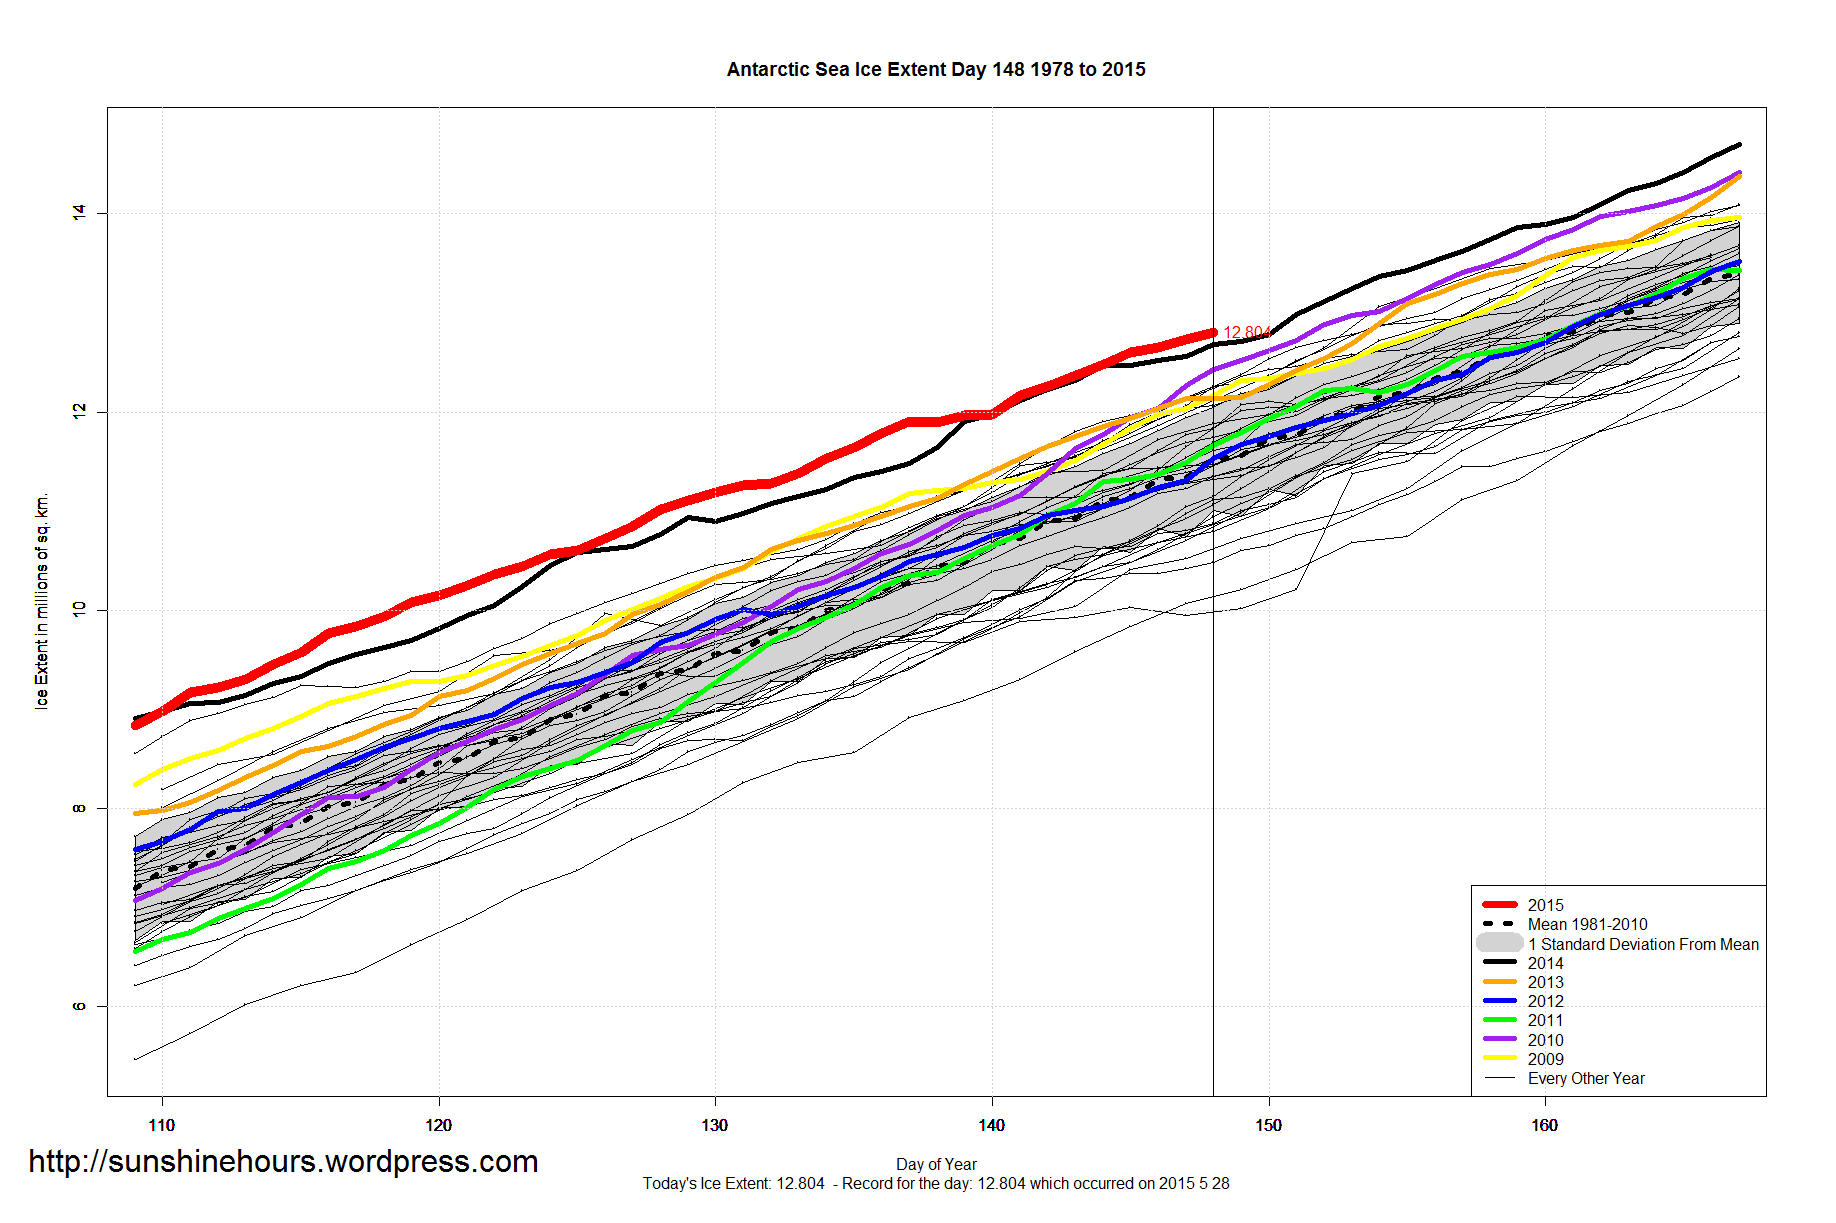
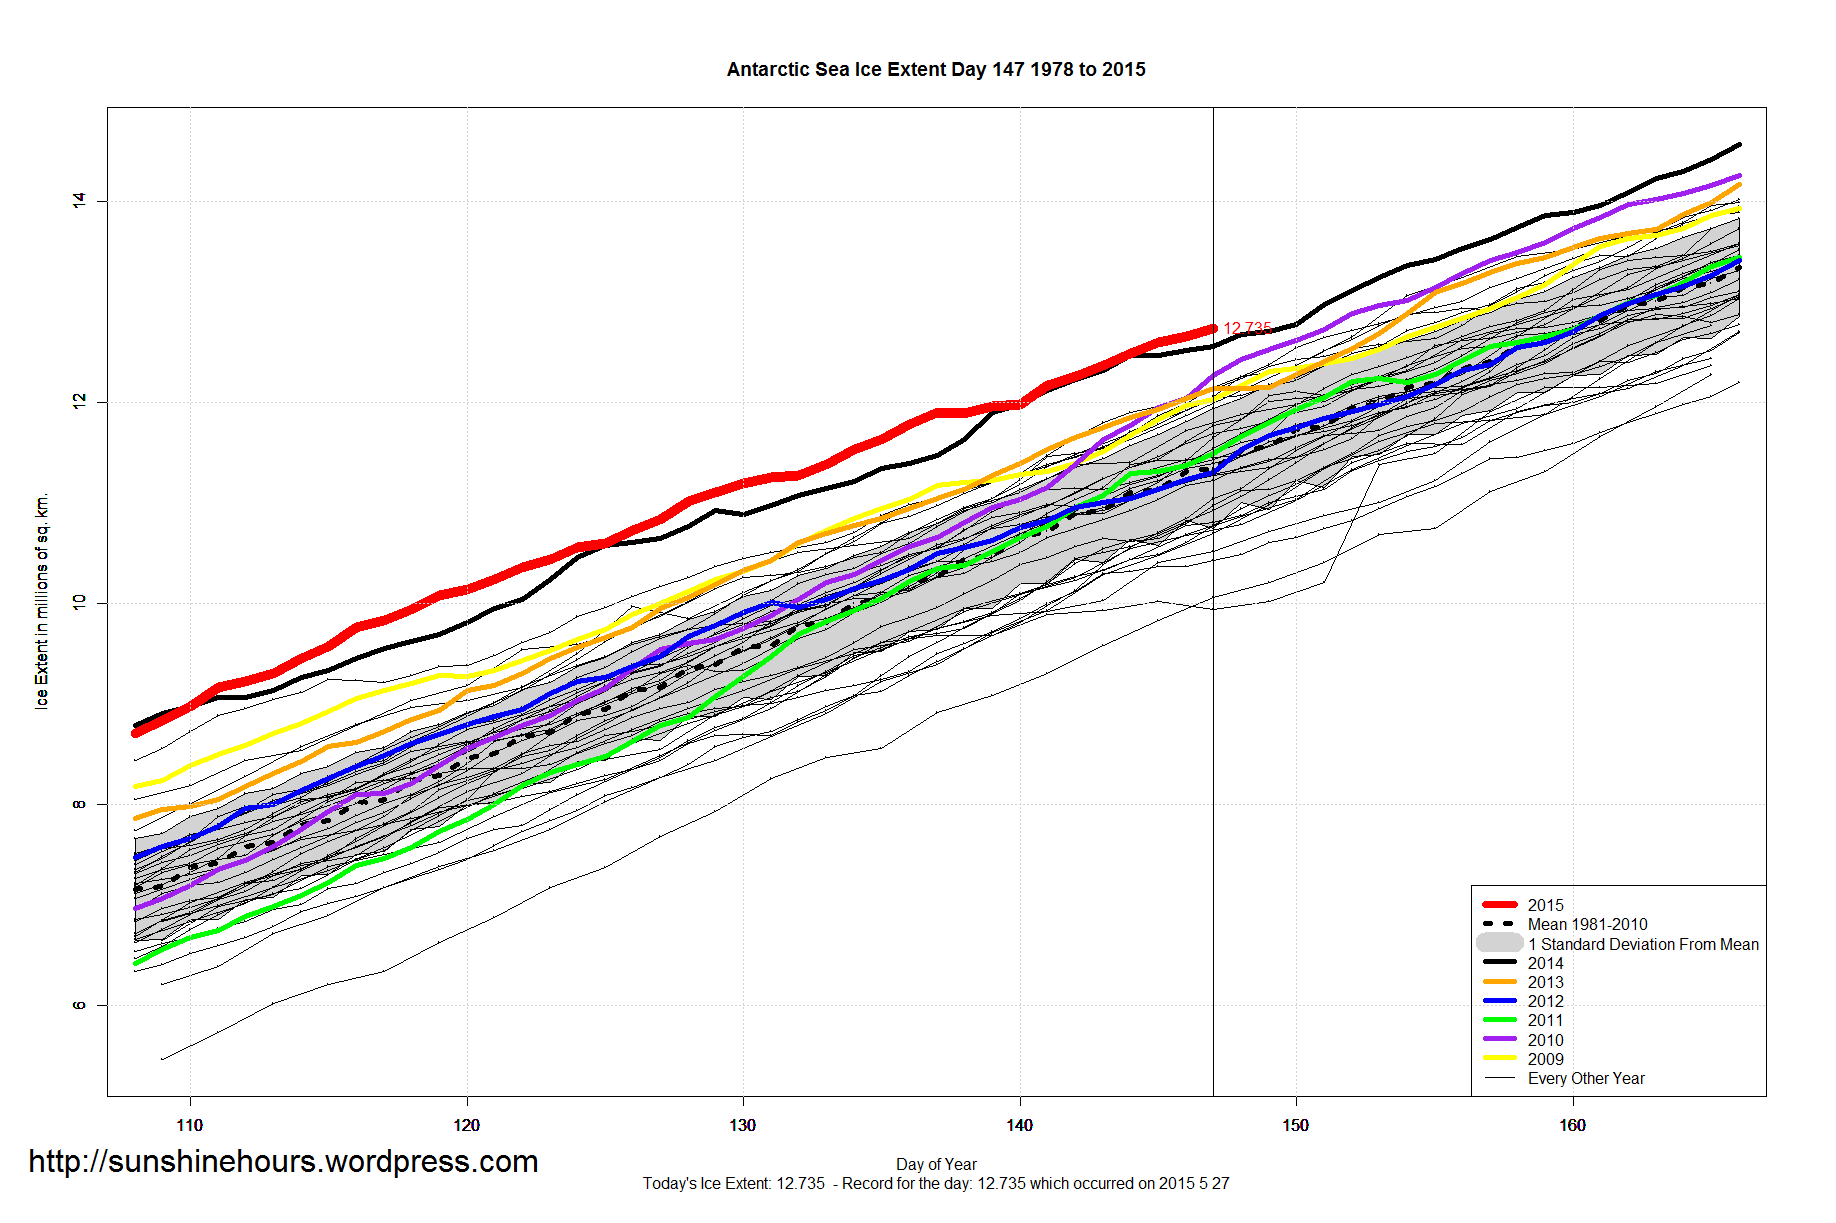
2nd Highest Antarctic Sea Ice For This Day – 1 million above the 1981-2010 mean. – Above 2 standard deviation.
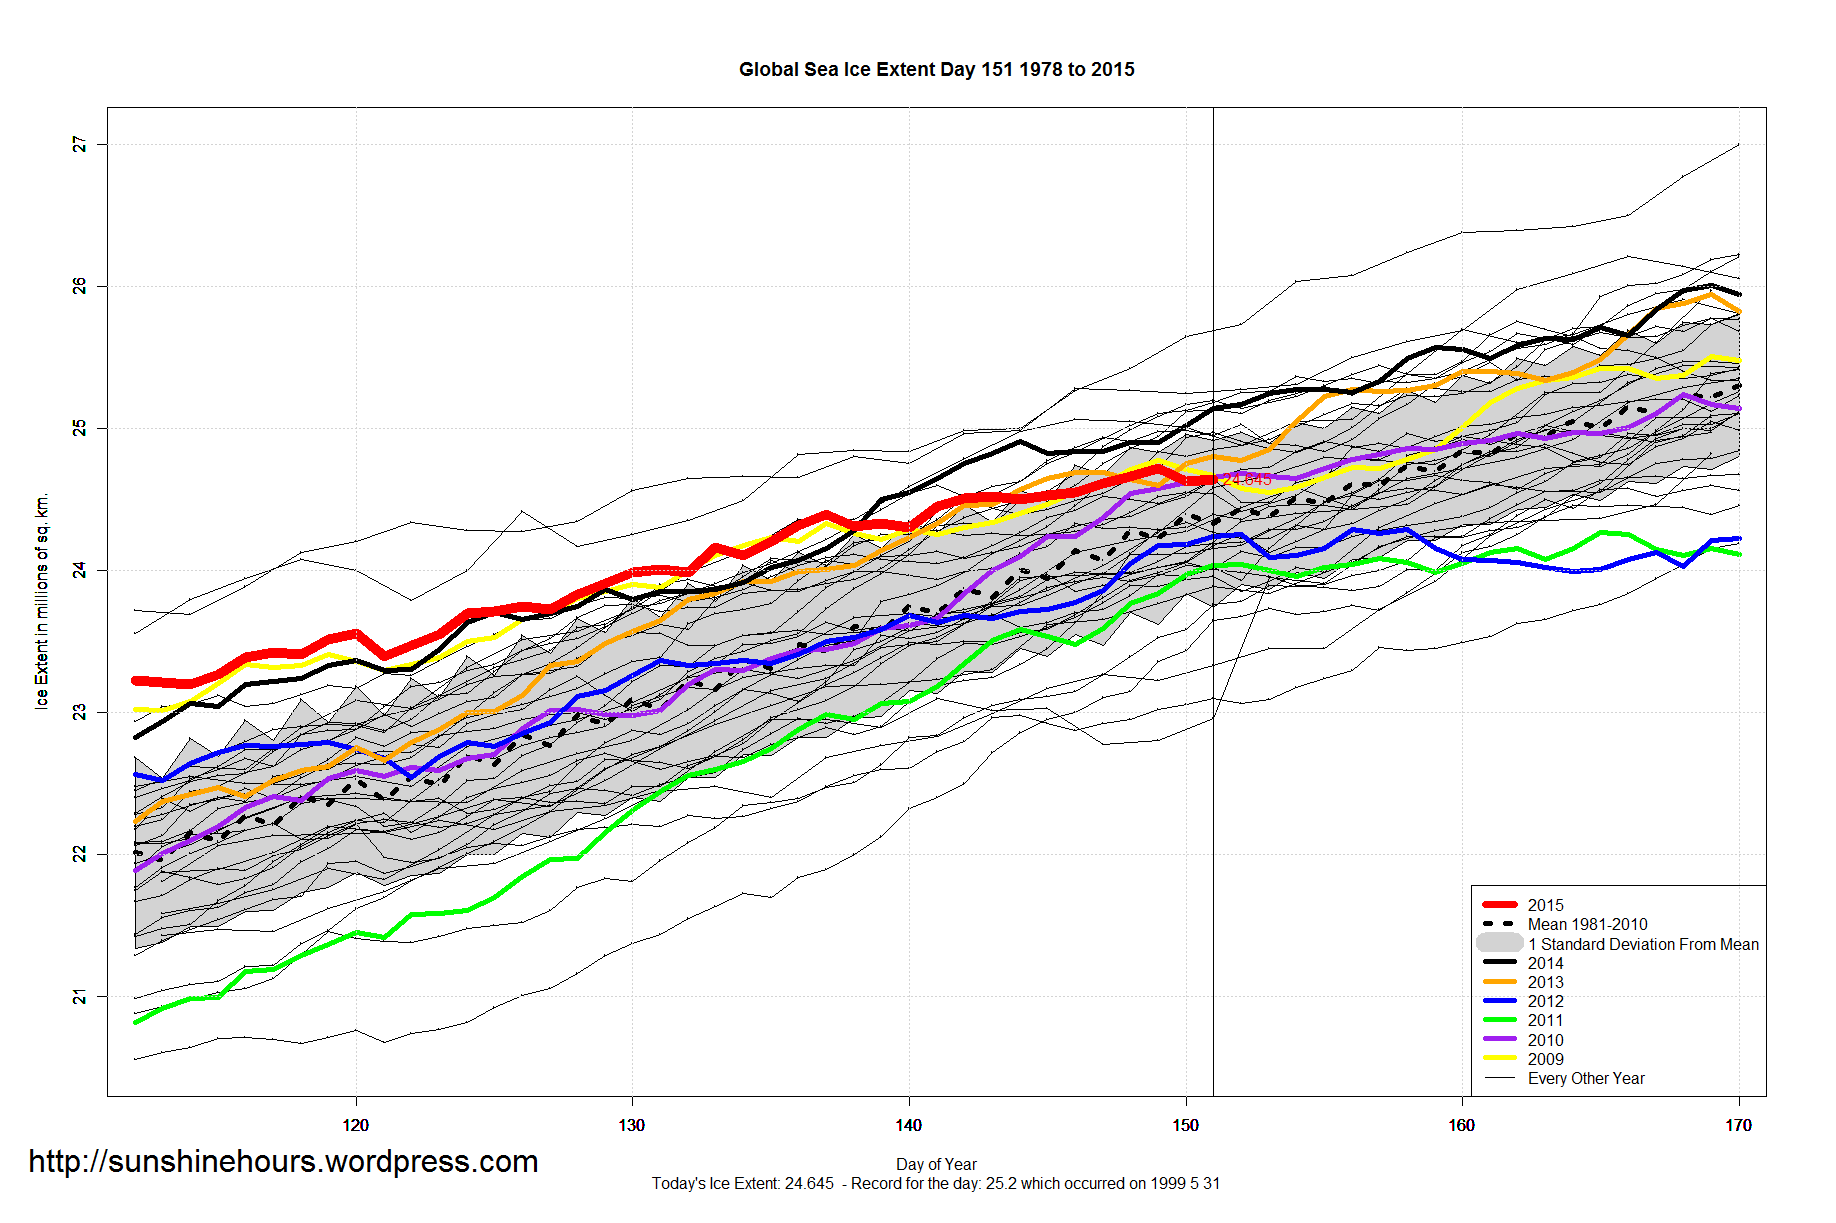
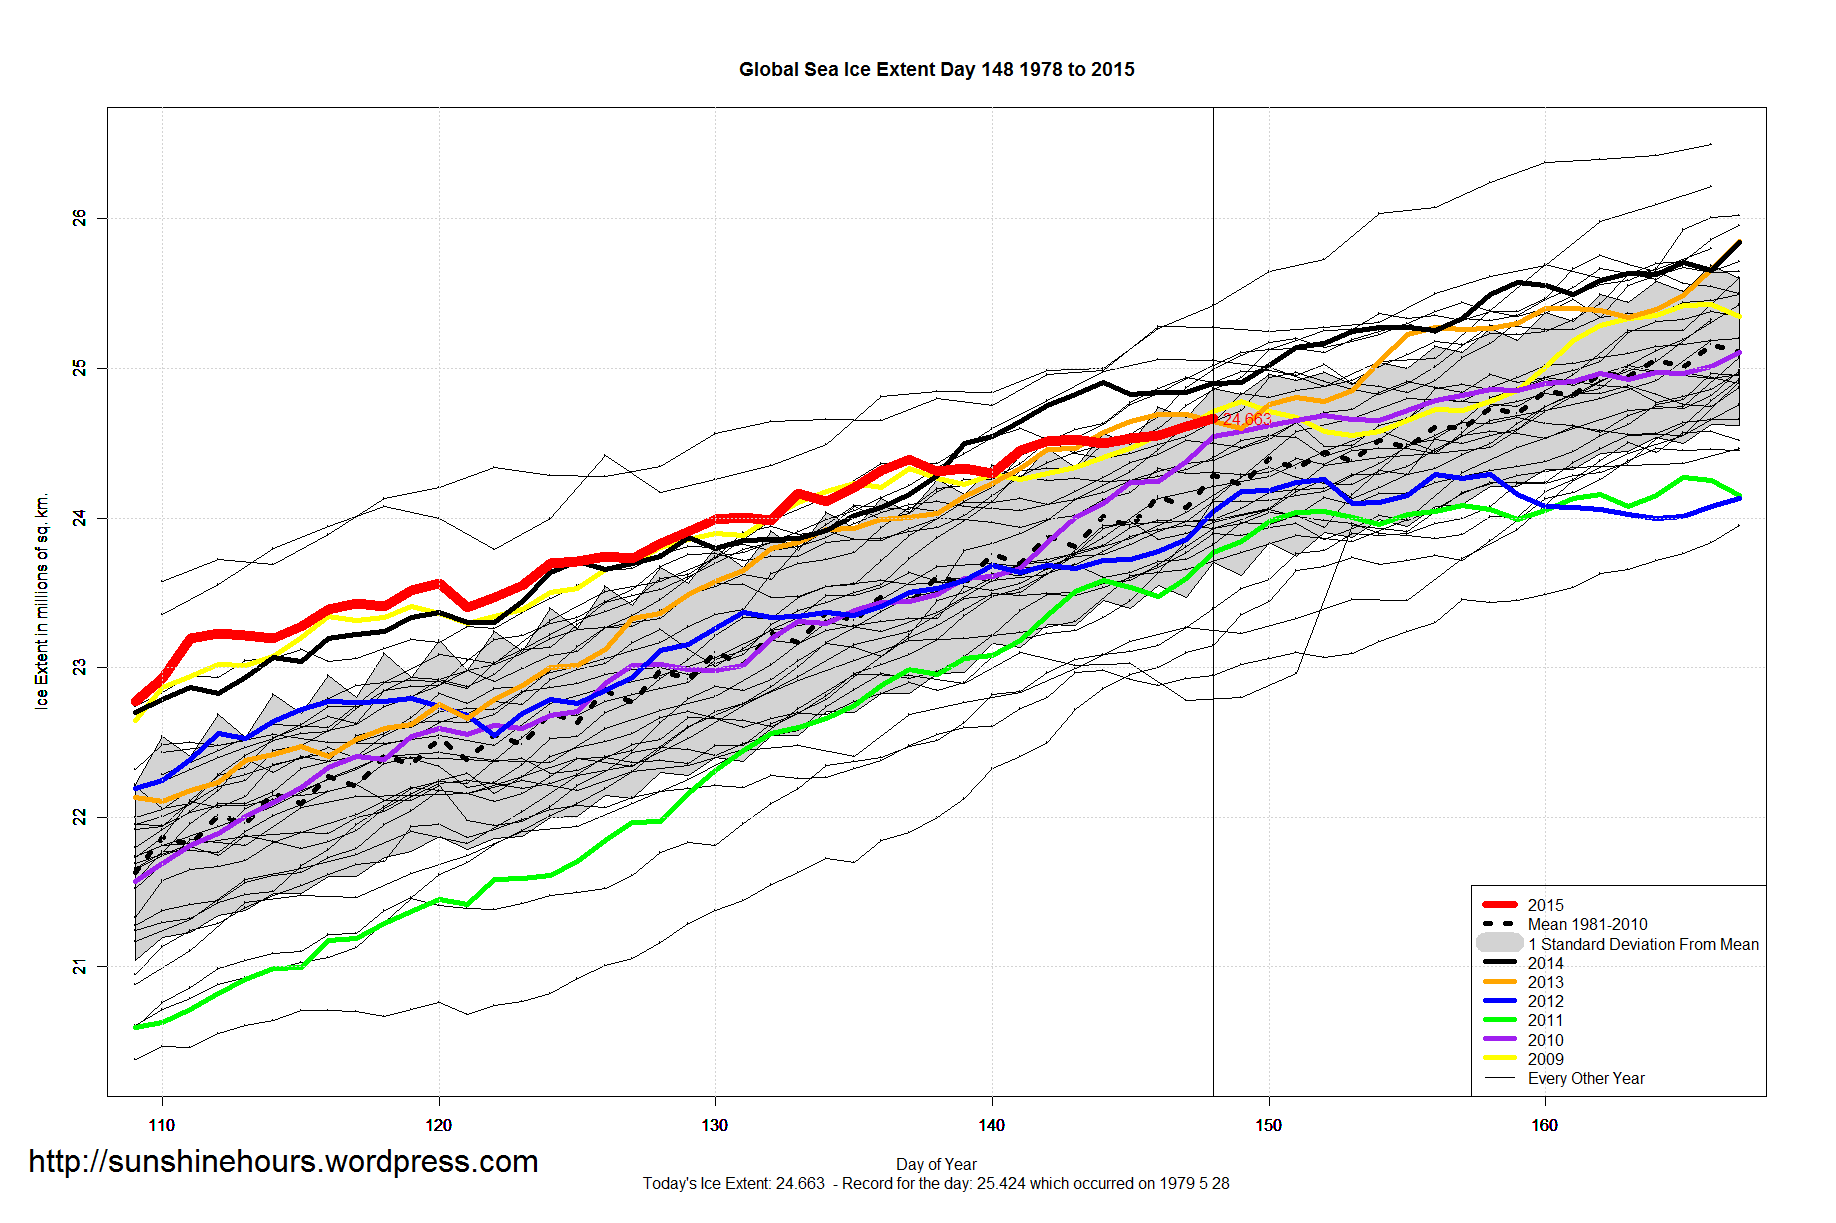
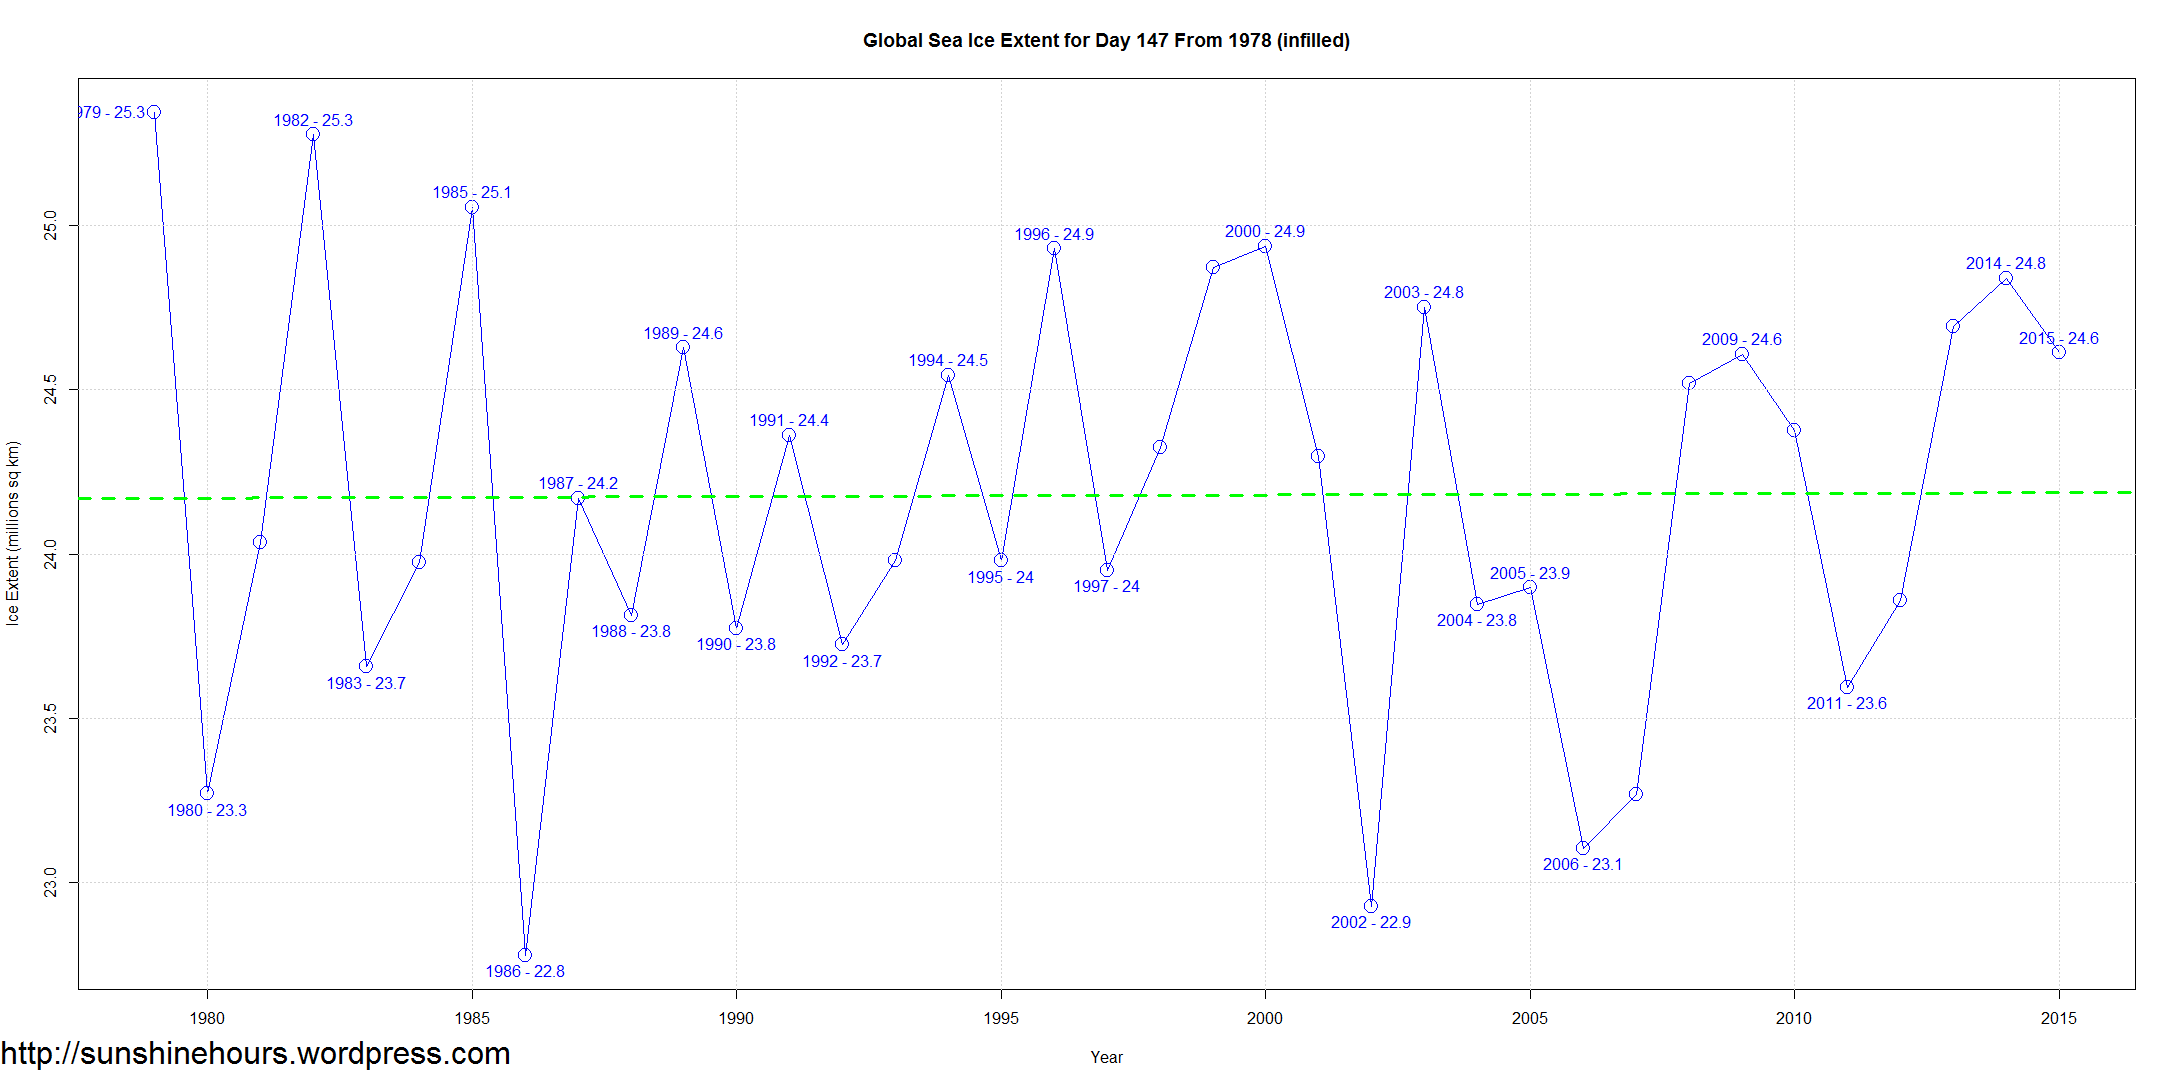
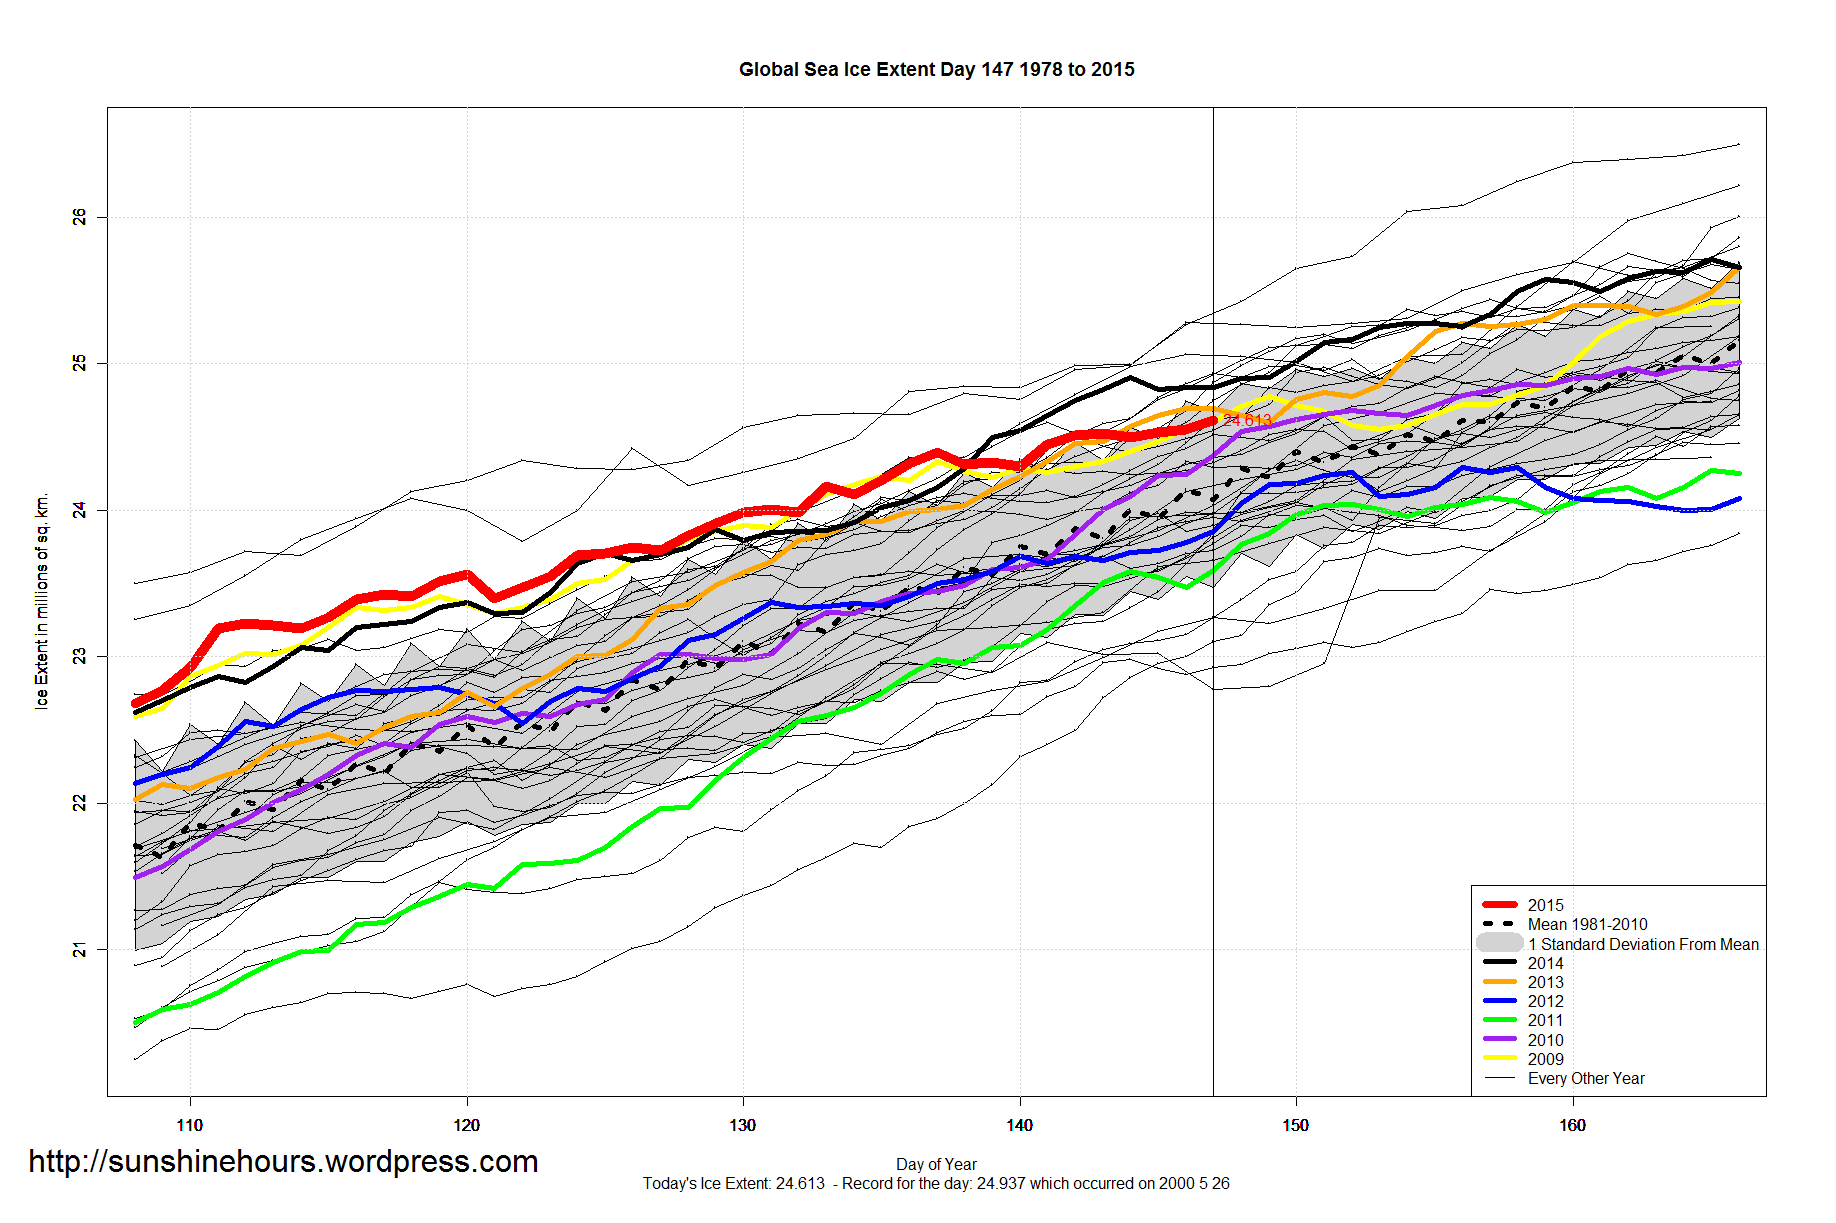
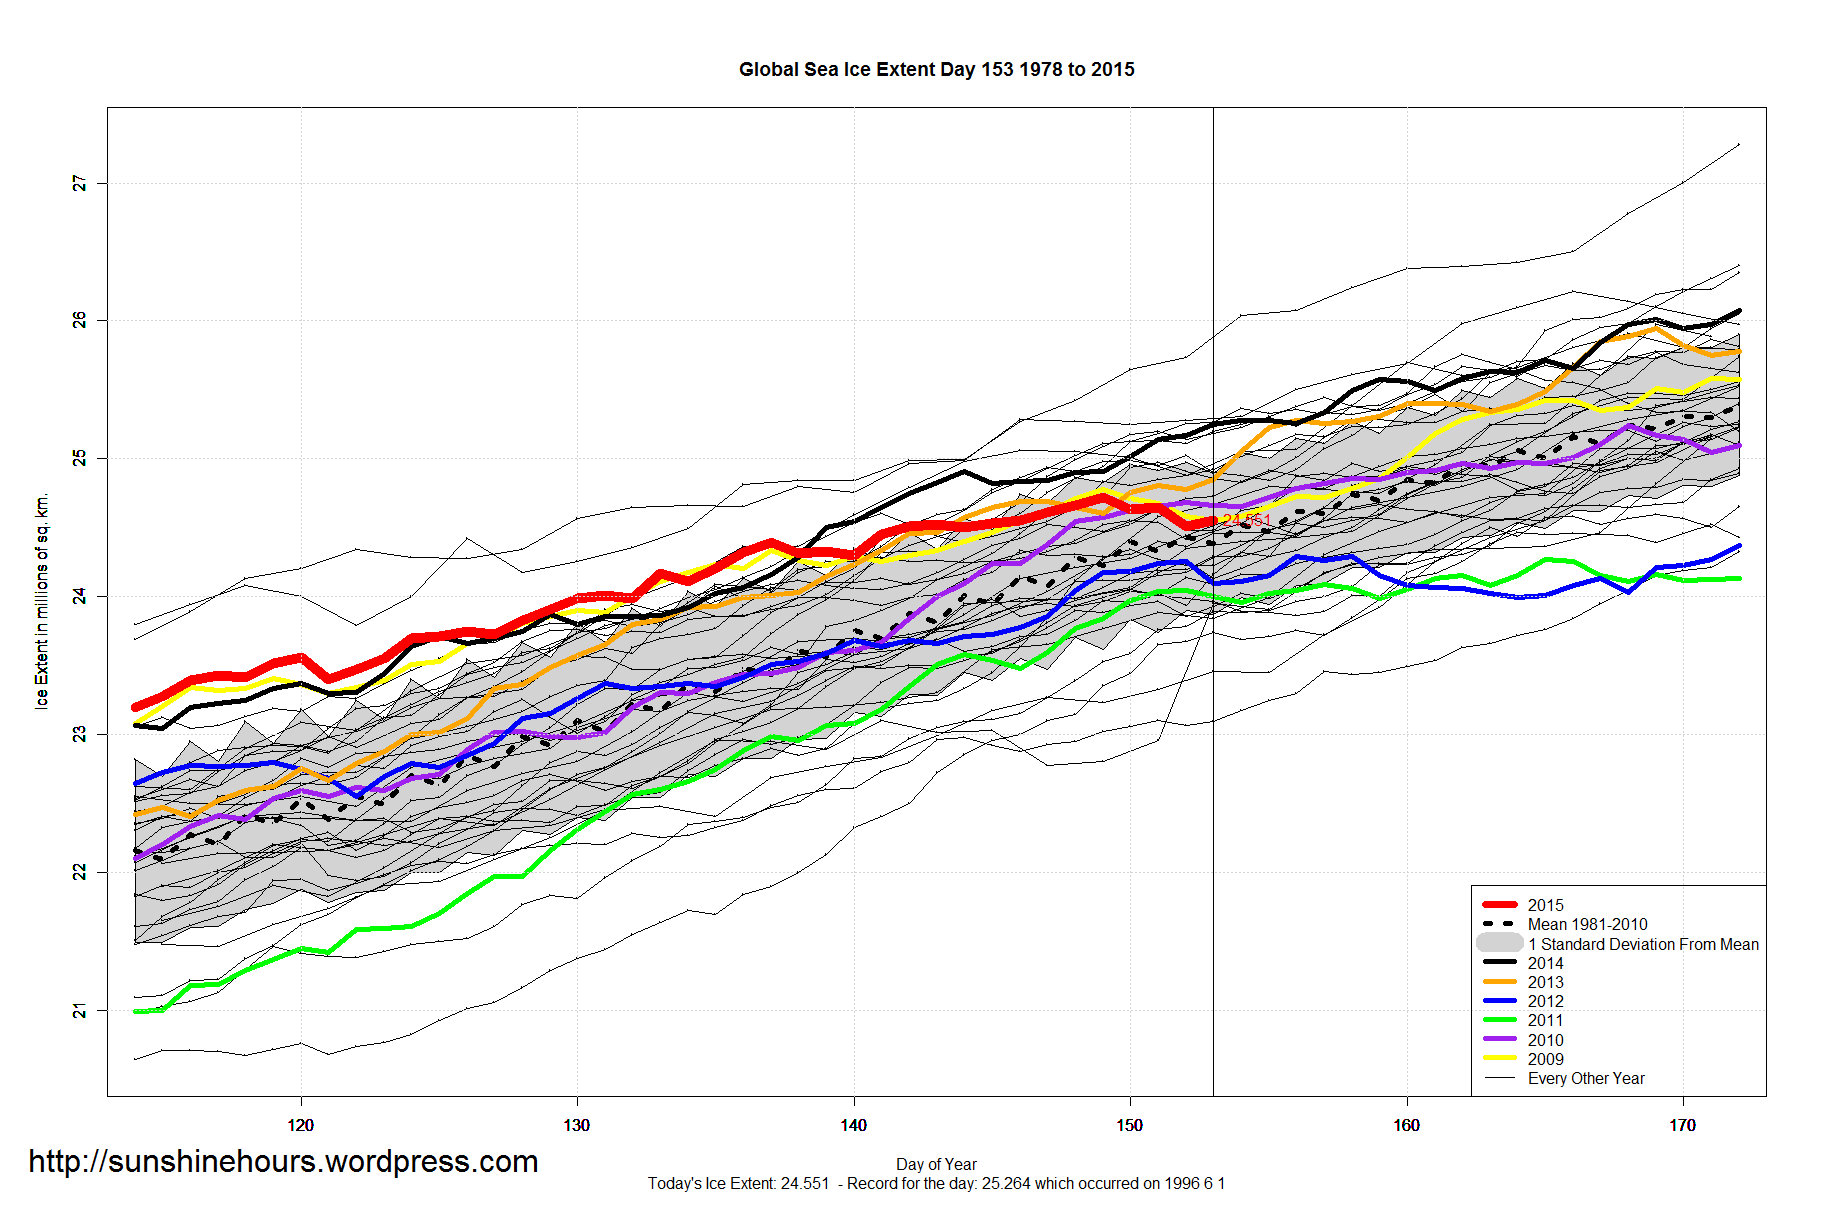
15th Highest Global Sea Ice For This Day.

This a followup to this post: British Columbia Canada Tmax , Tmin and Tmean from 1873 (On 1×1 Grid)
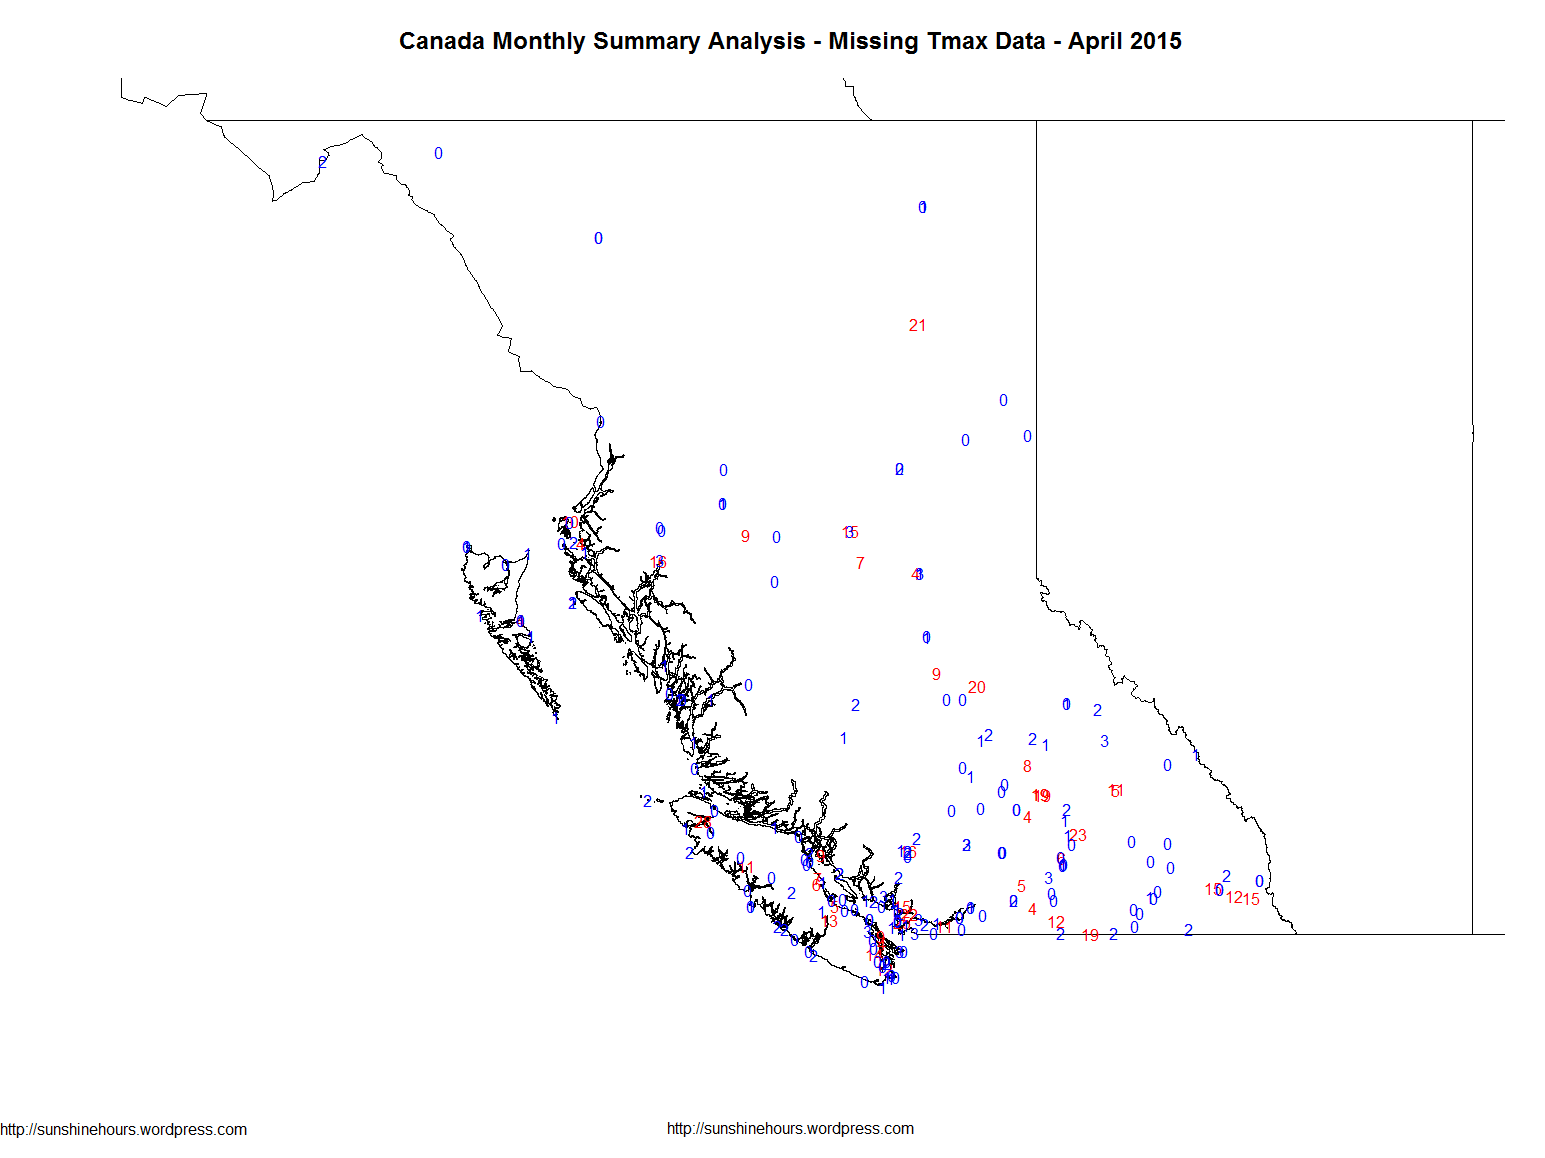
The following map shows which stations were missing (or not missing) daily Tmax data in the monthly summary for April 2015.
Blue had 0-3 days missing. Red more than 3. What saddens me is that 19 out of the 43 “red” stations were also “Normals” – which means they were reference stations.
This a followup to this post: British Columbia Canada Tmax , Tmin and Tmean from 1873 (On 1×1 Grid)
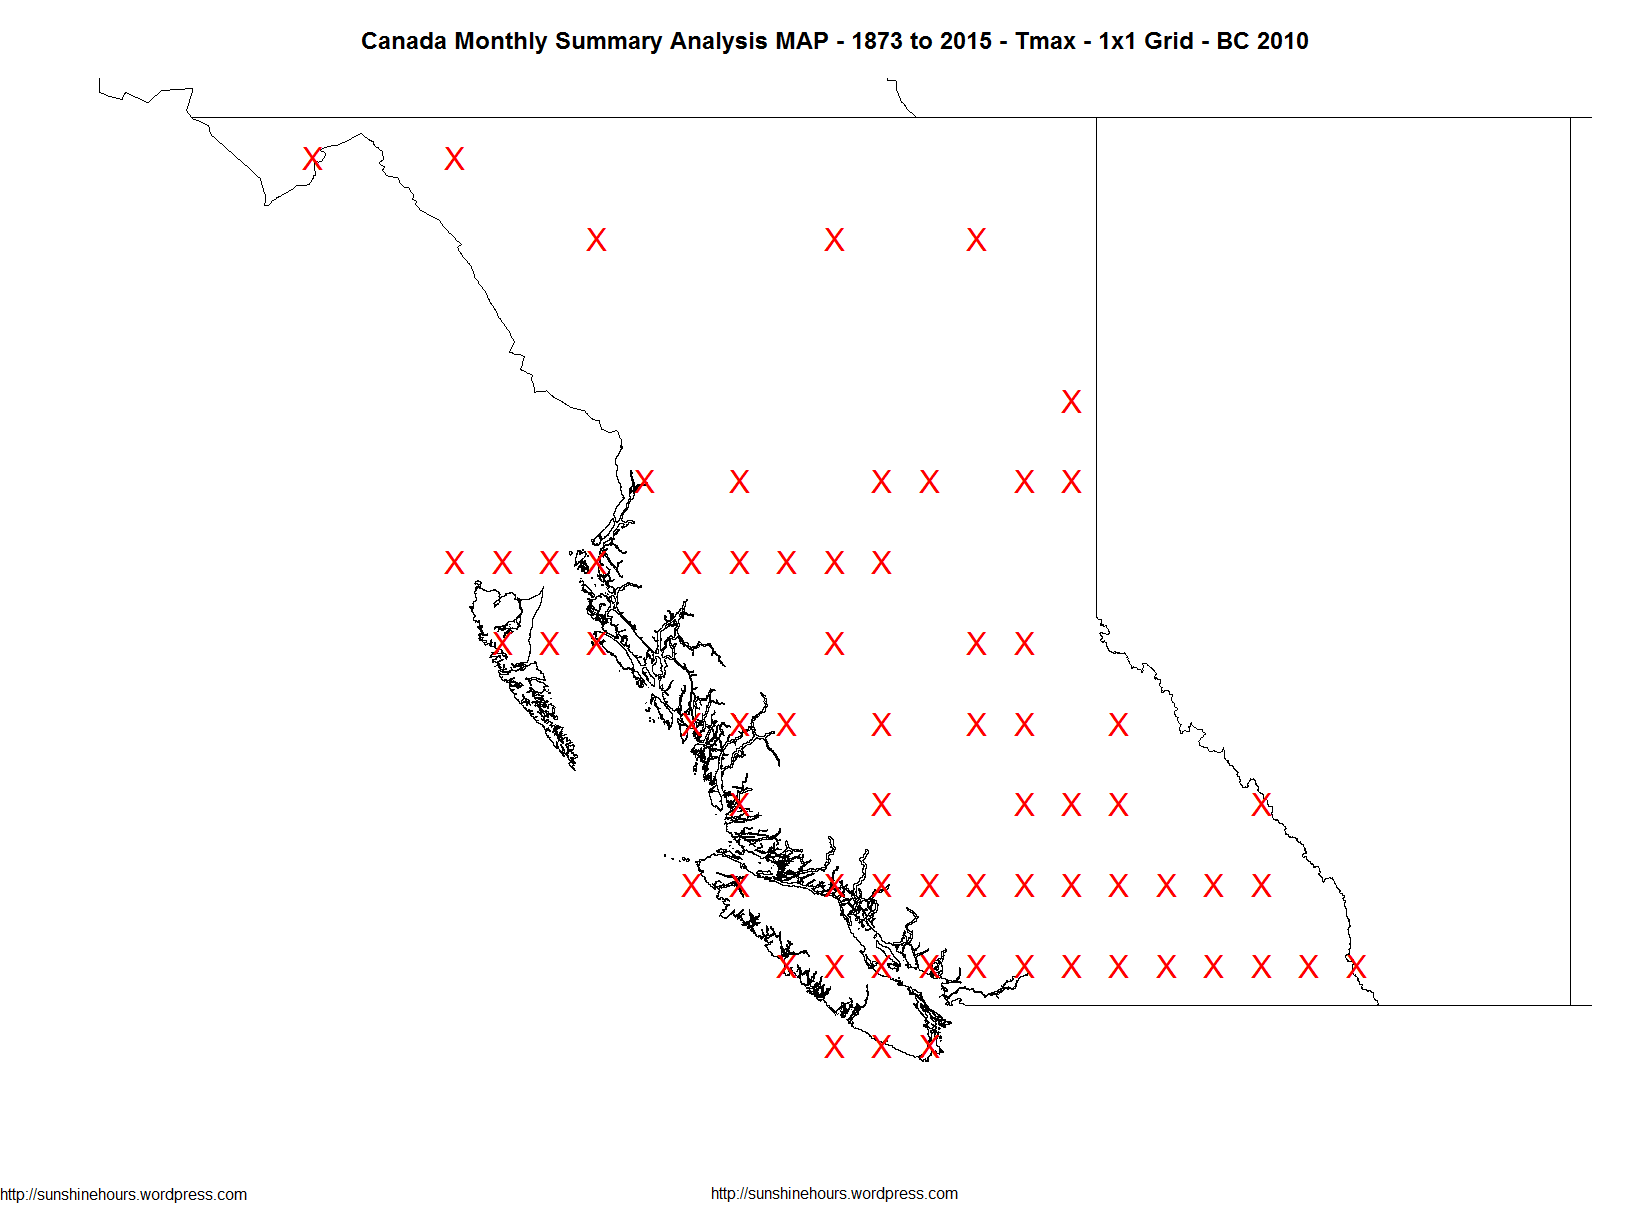
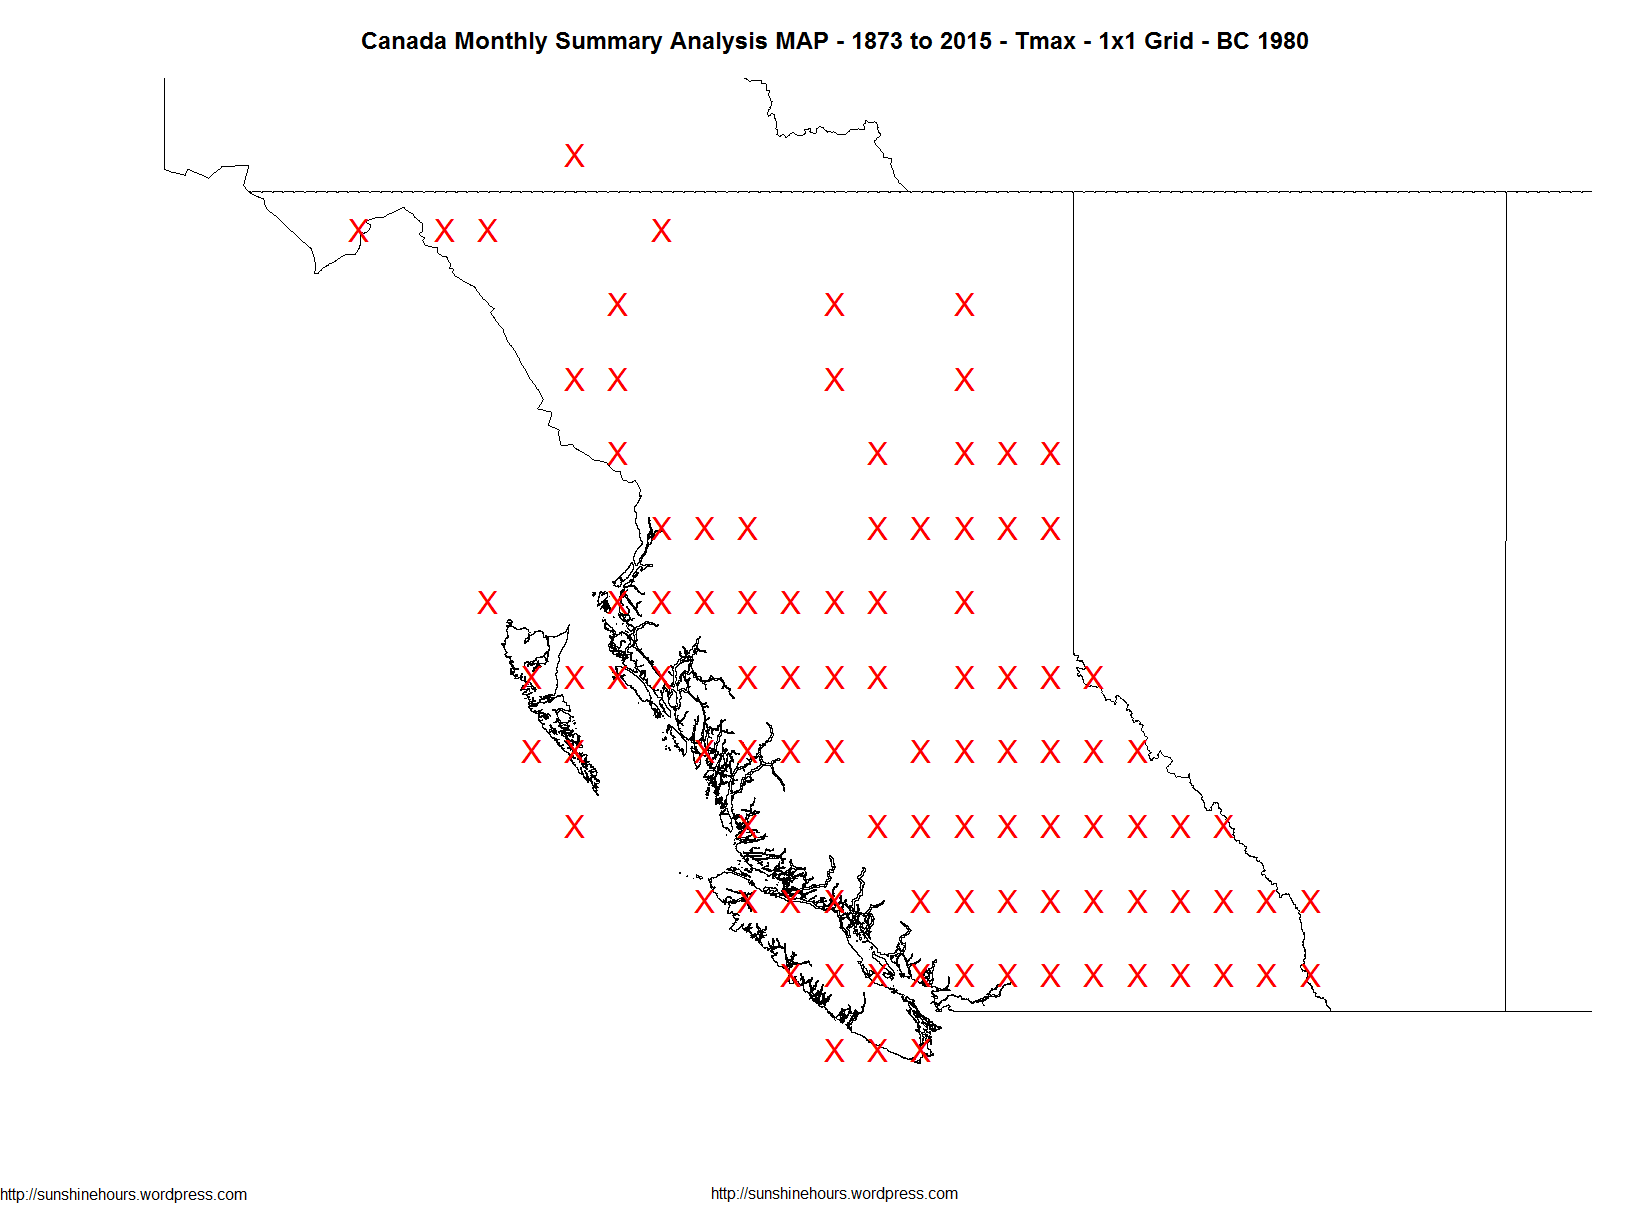
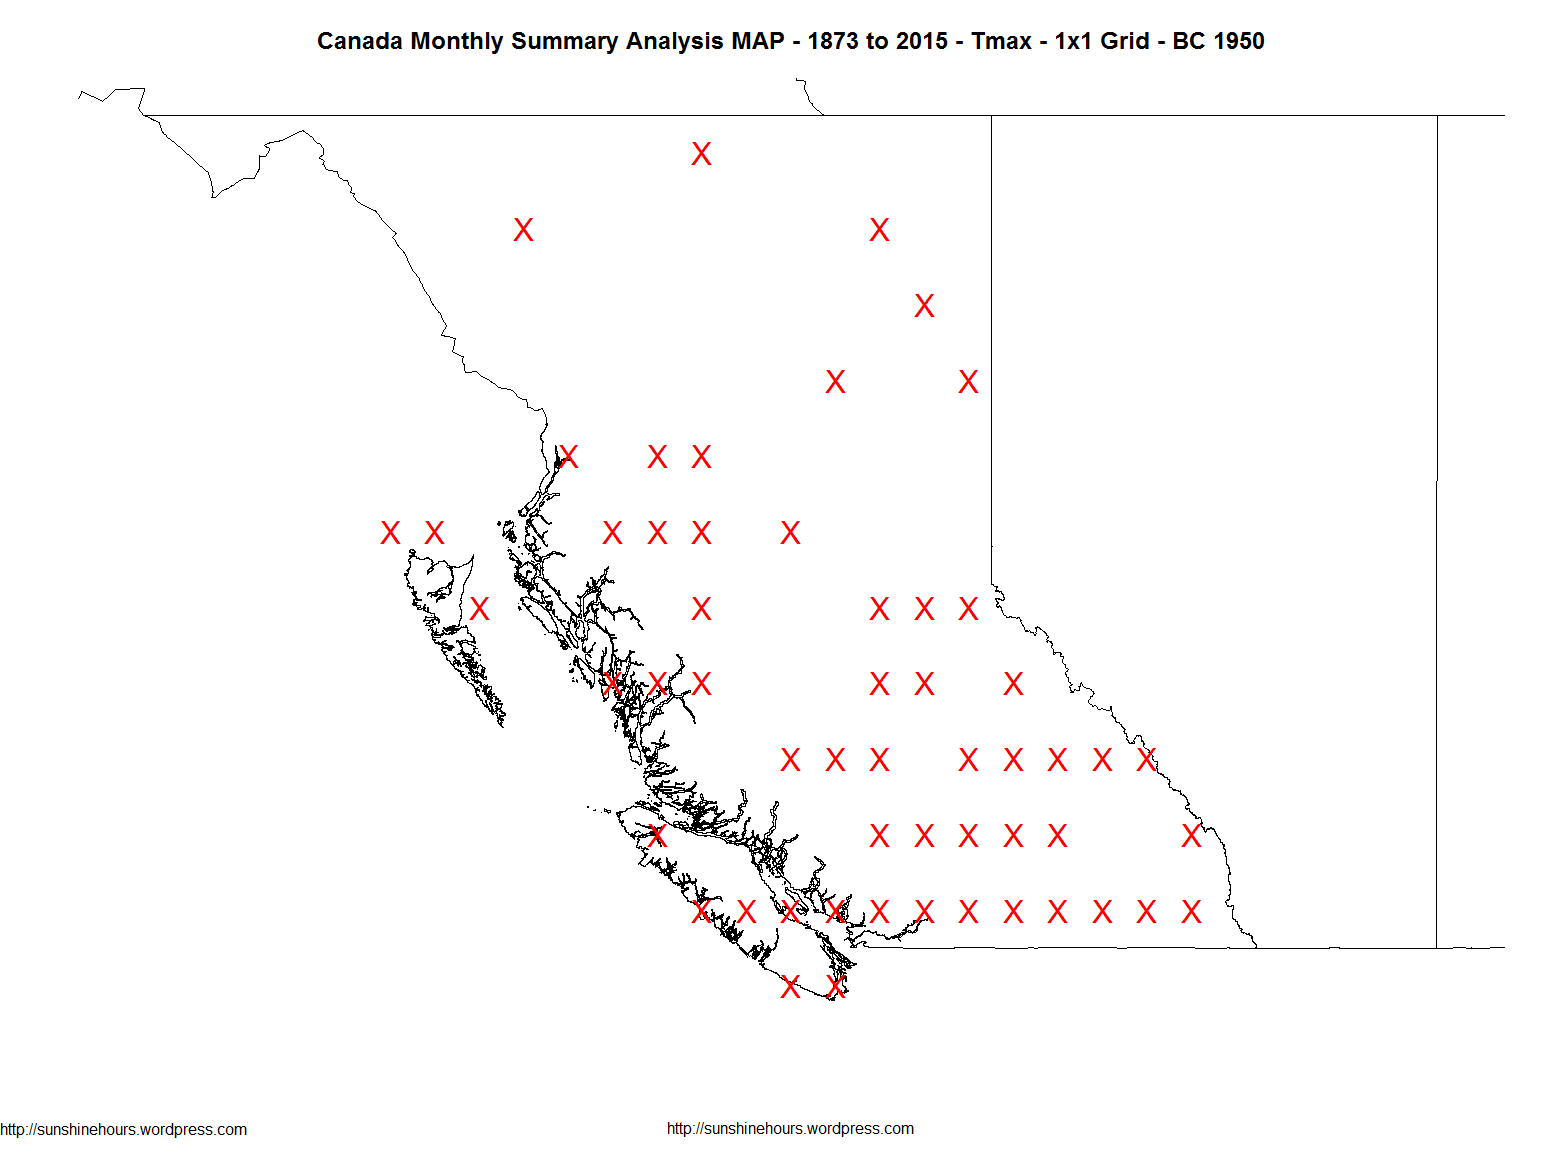
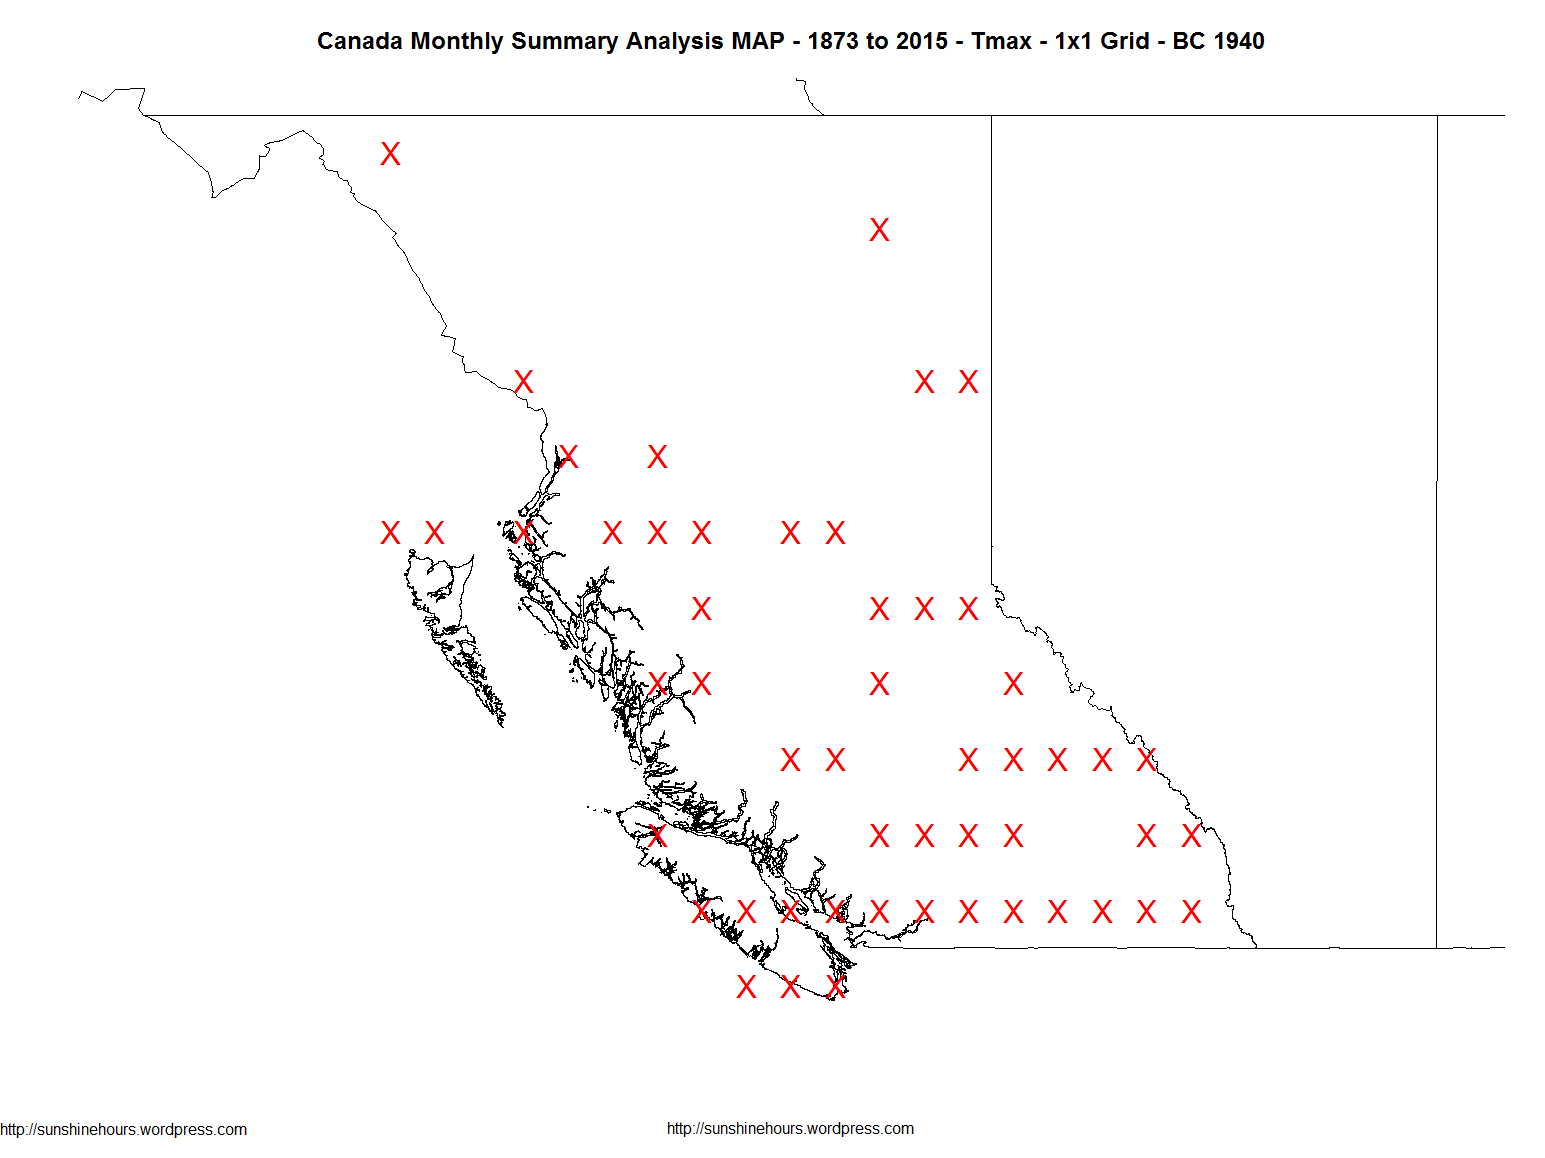
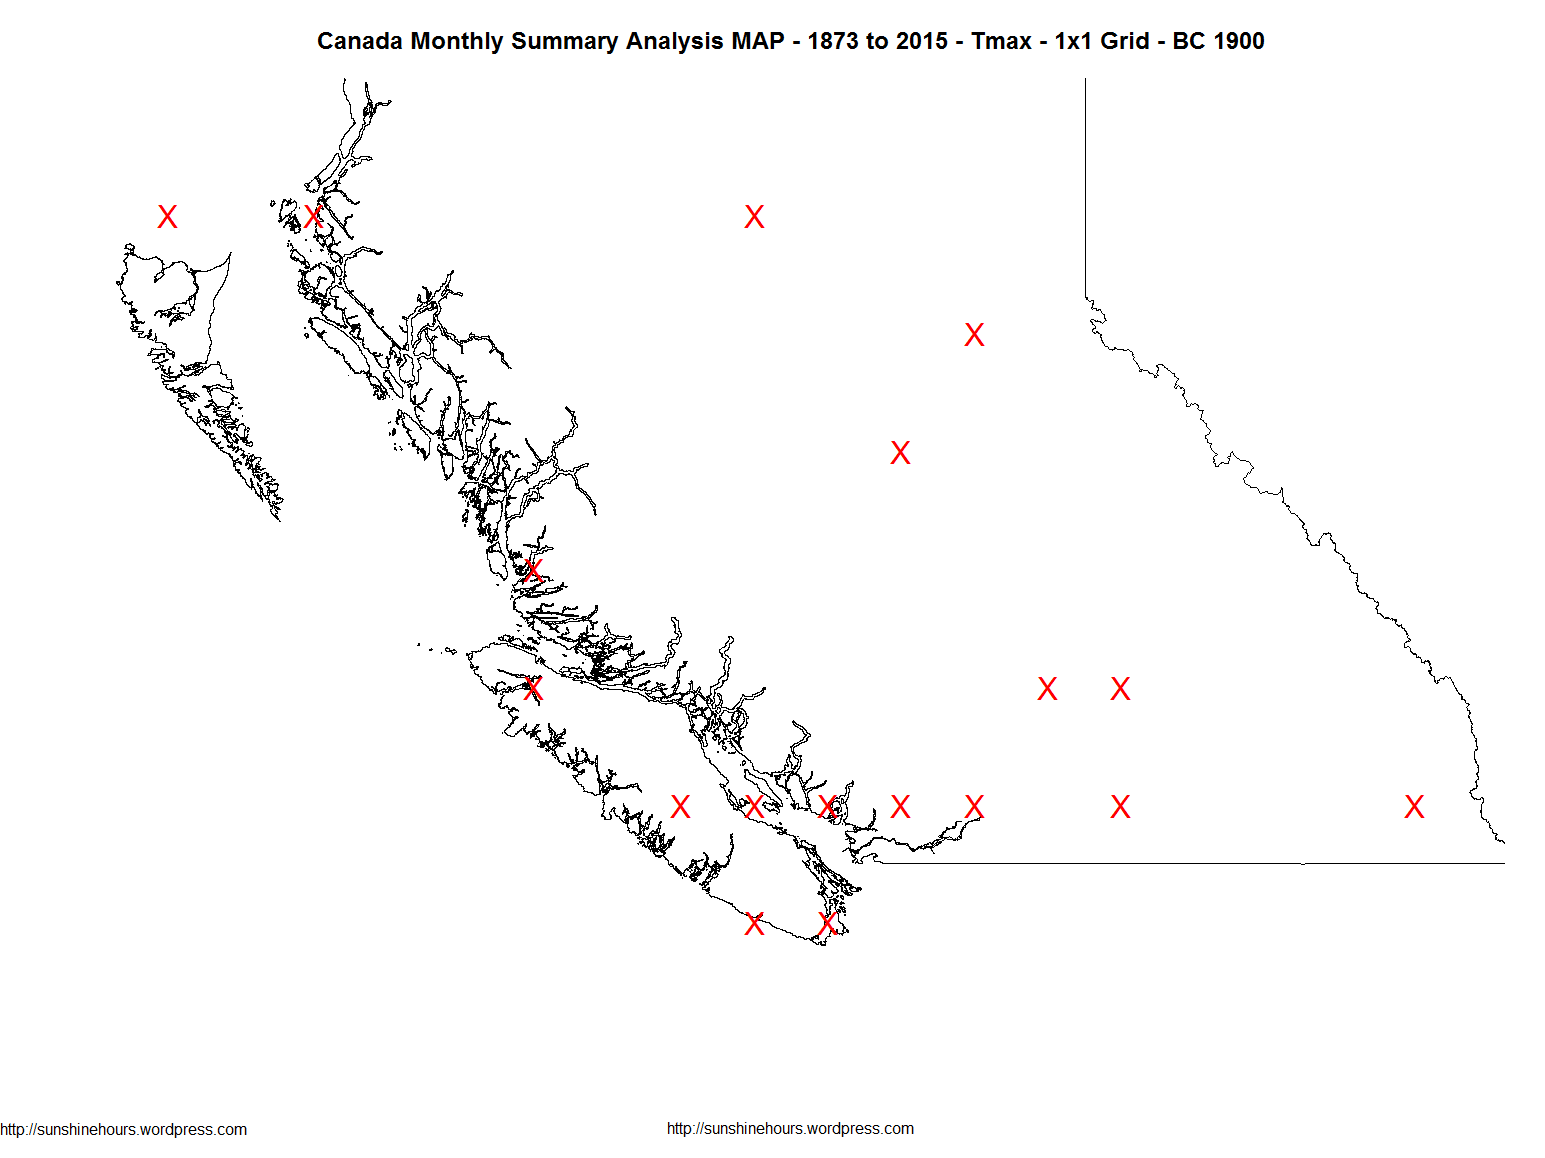
The following maps show which grid cells (apprximately) had data in a few key years.
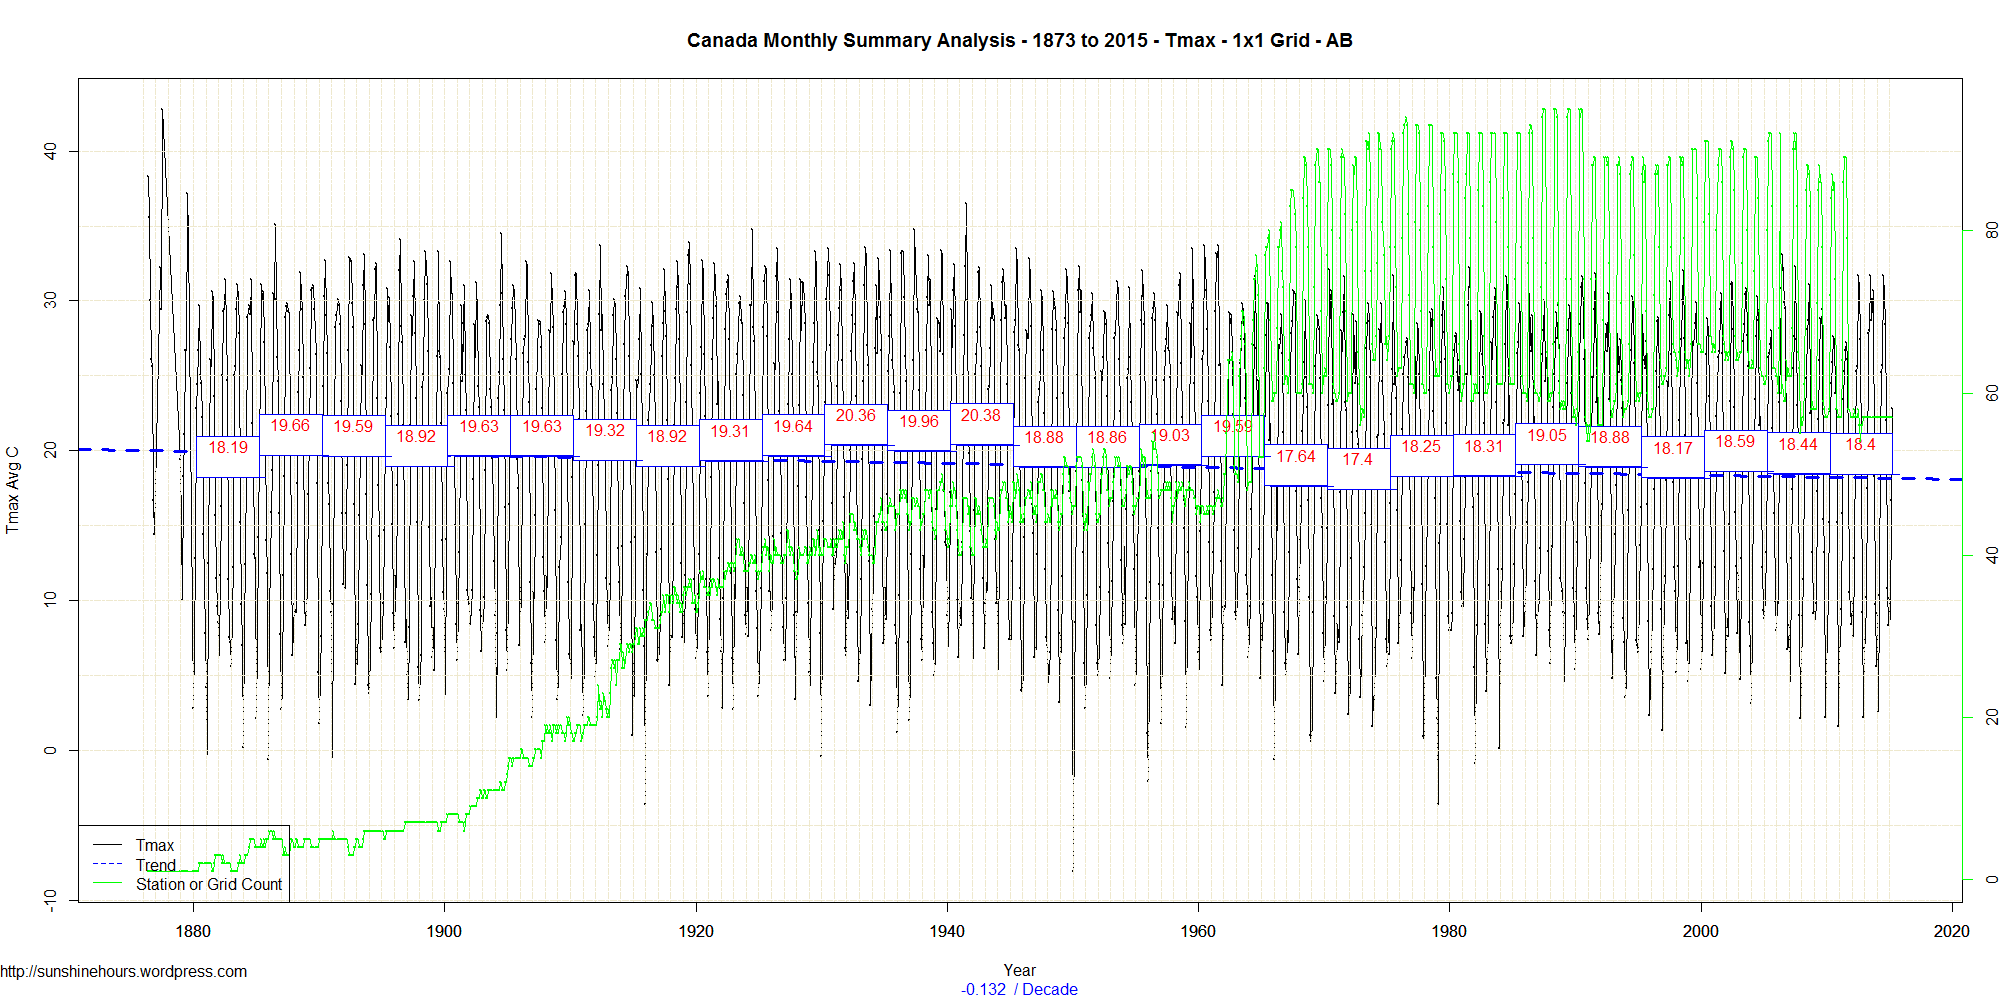
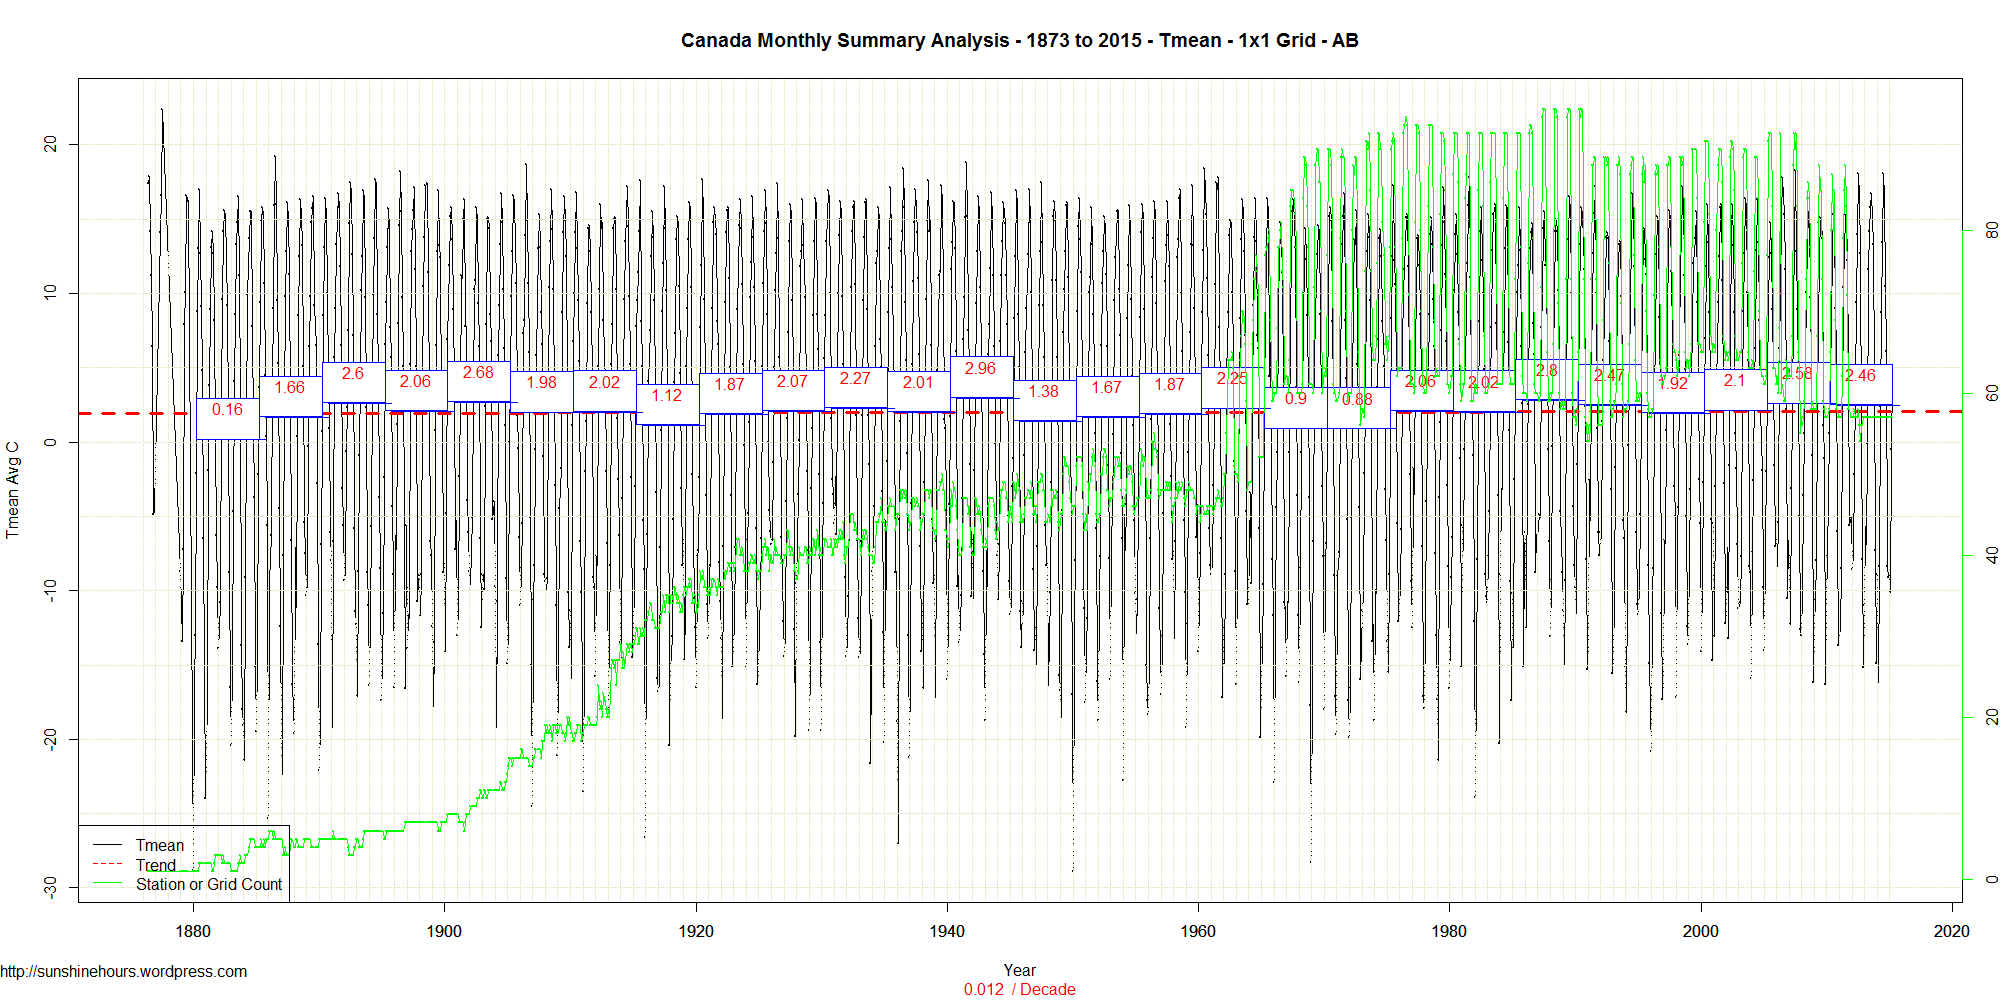
This is the Alberta followup the BC post. You can read the explnations.
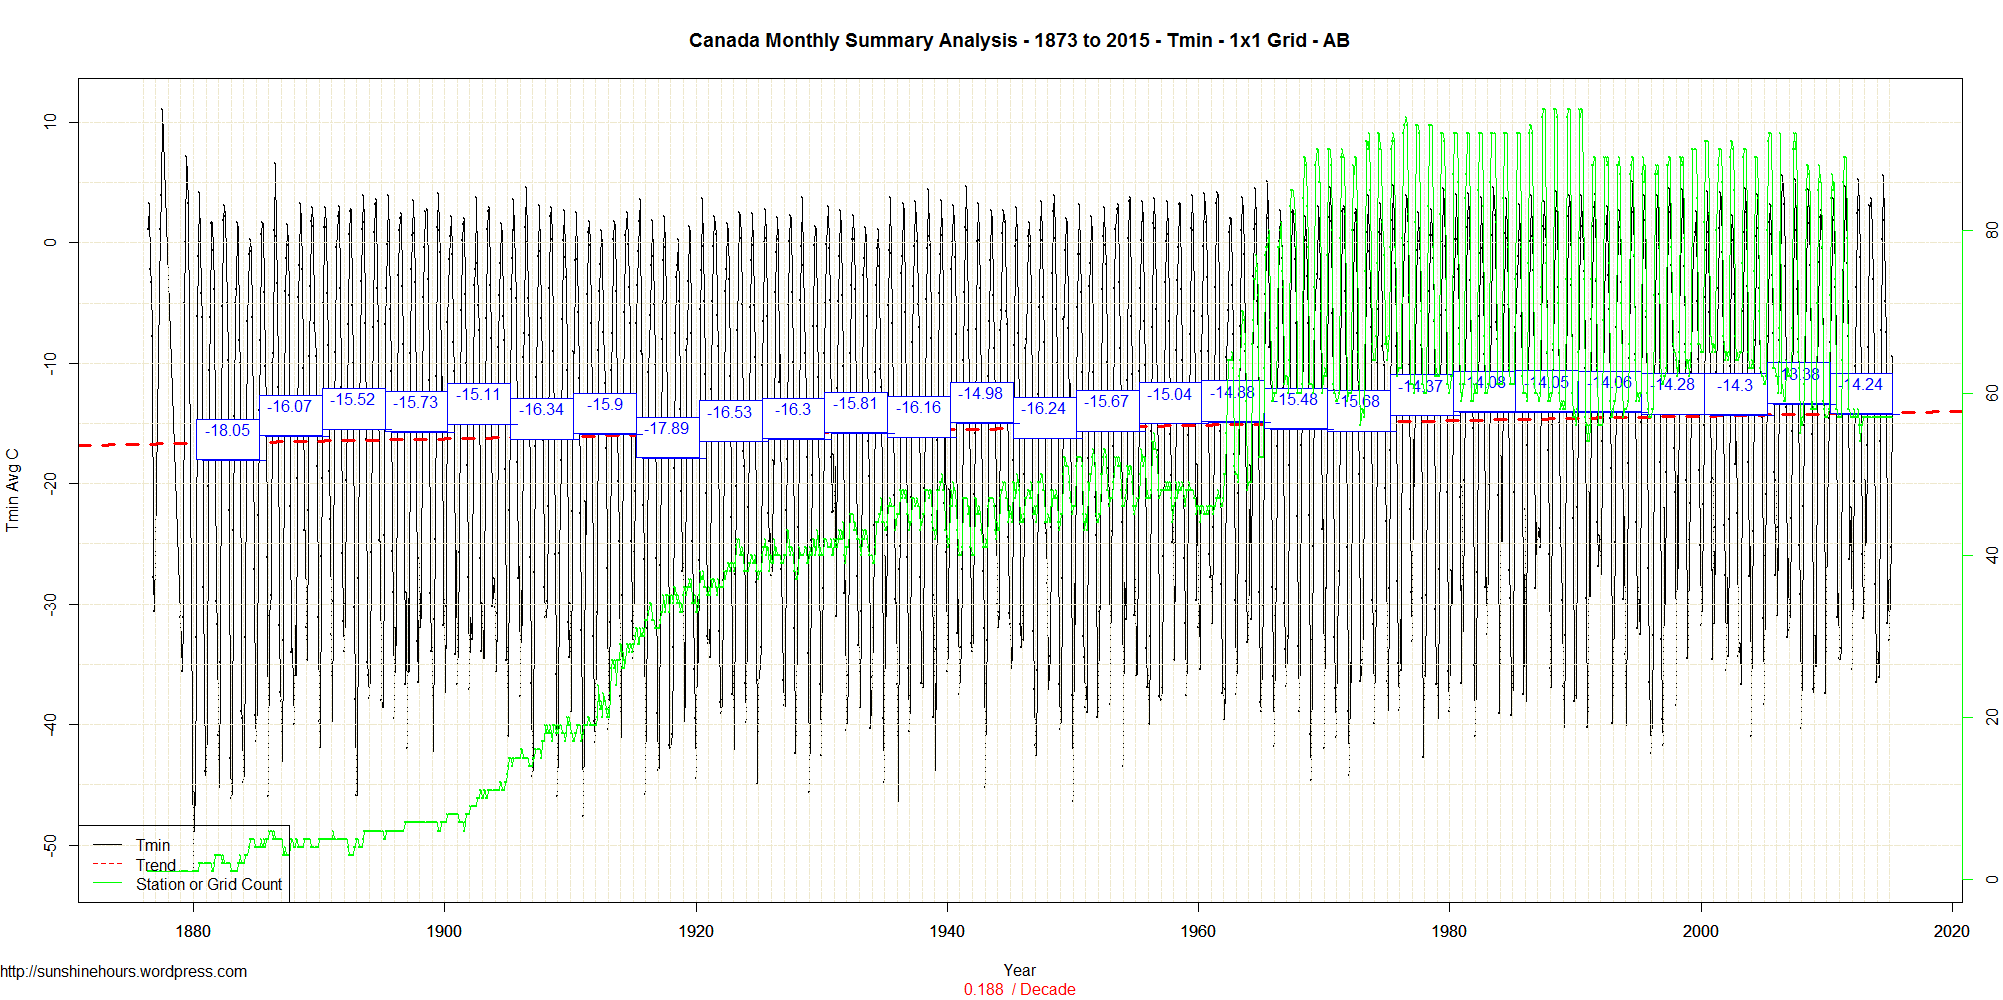
In the terms of Tmax the coldest period in Alberta (using 5 year means) was 1972-1976.
The warmest period was 1940 – 1944. In fact it was 2C warmer in 1940-1944 than 2011 – 2015. (The 1930s were just slightly cooler than the early 40s)
You may ask why the green line of grid counts goes up and down so much. It appears there are many more stations reporting in May/Jun/Jul/Aug/Sep than in the winter.
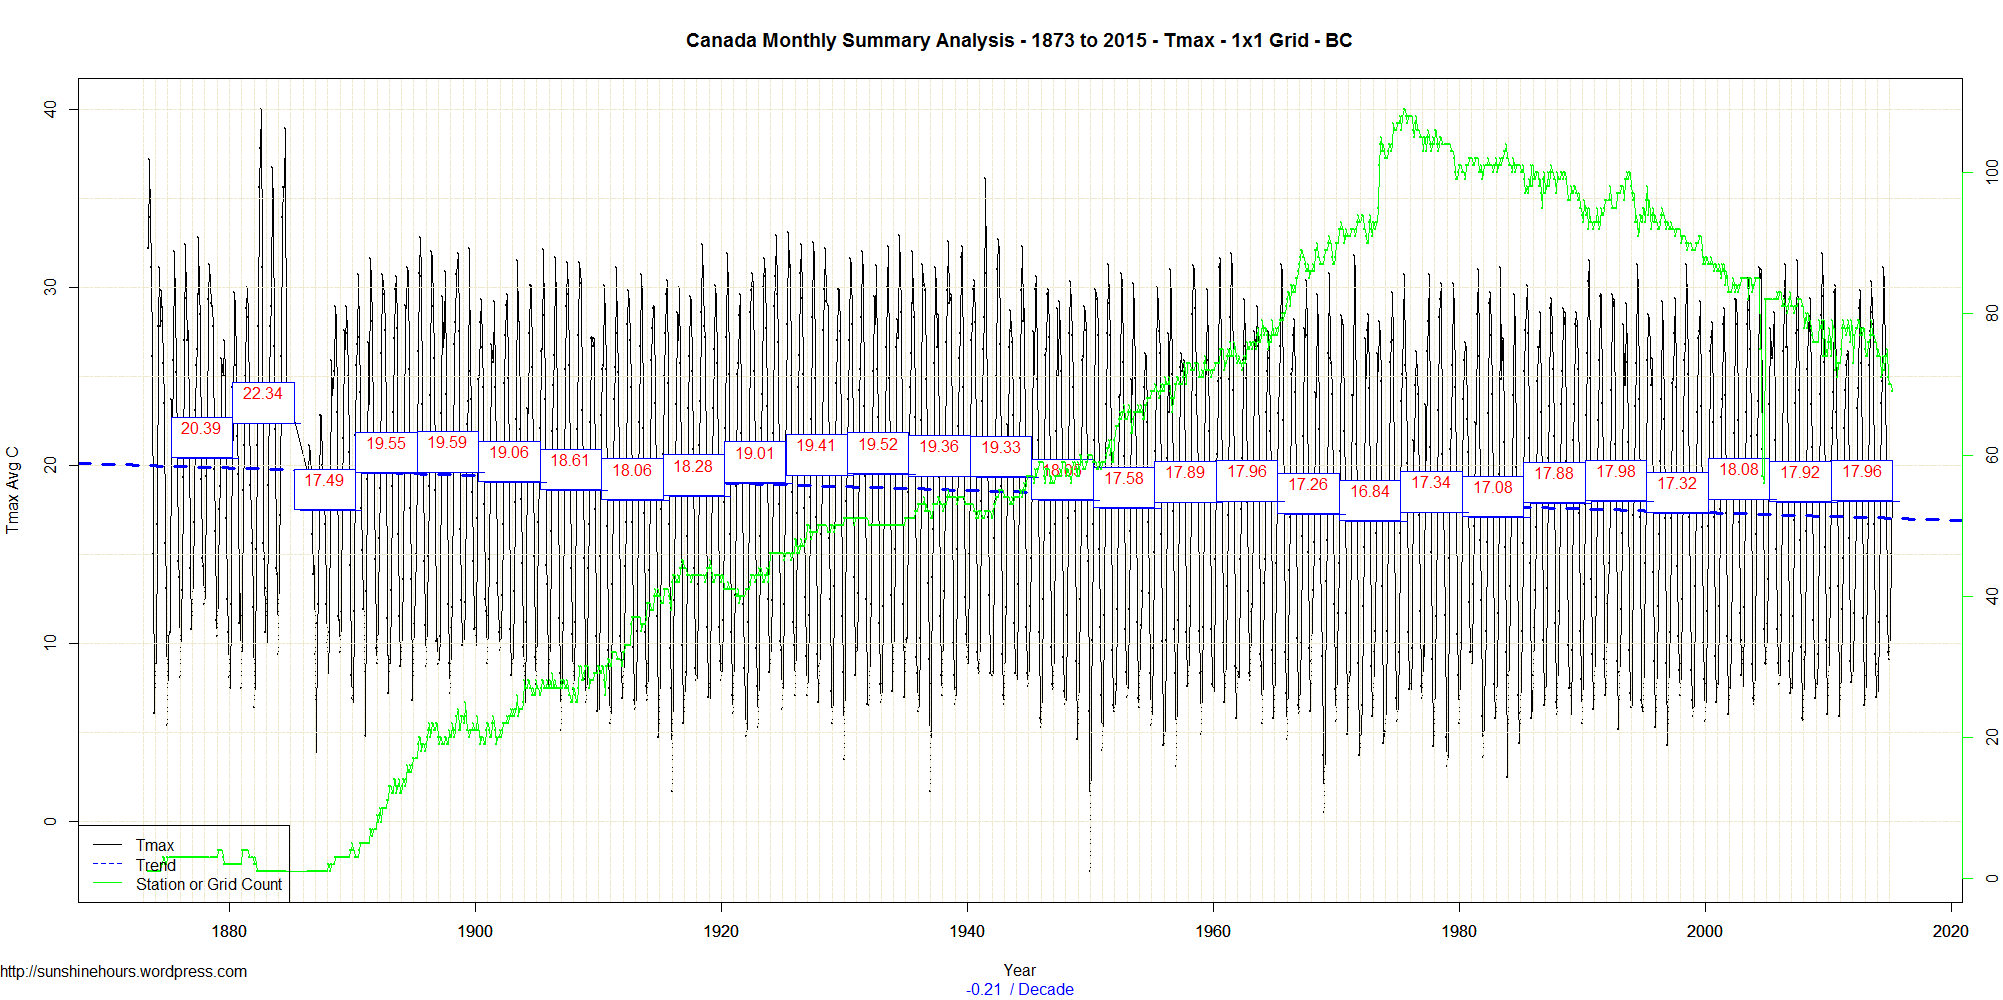
Tmax
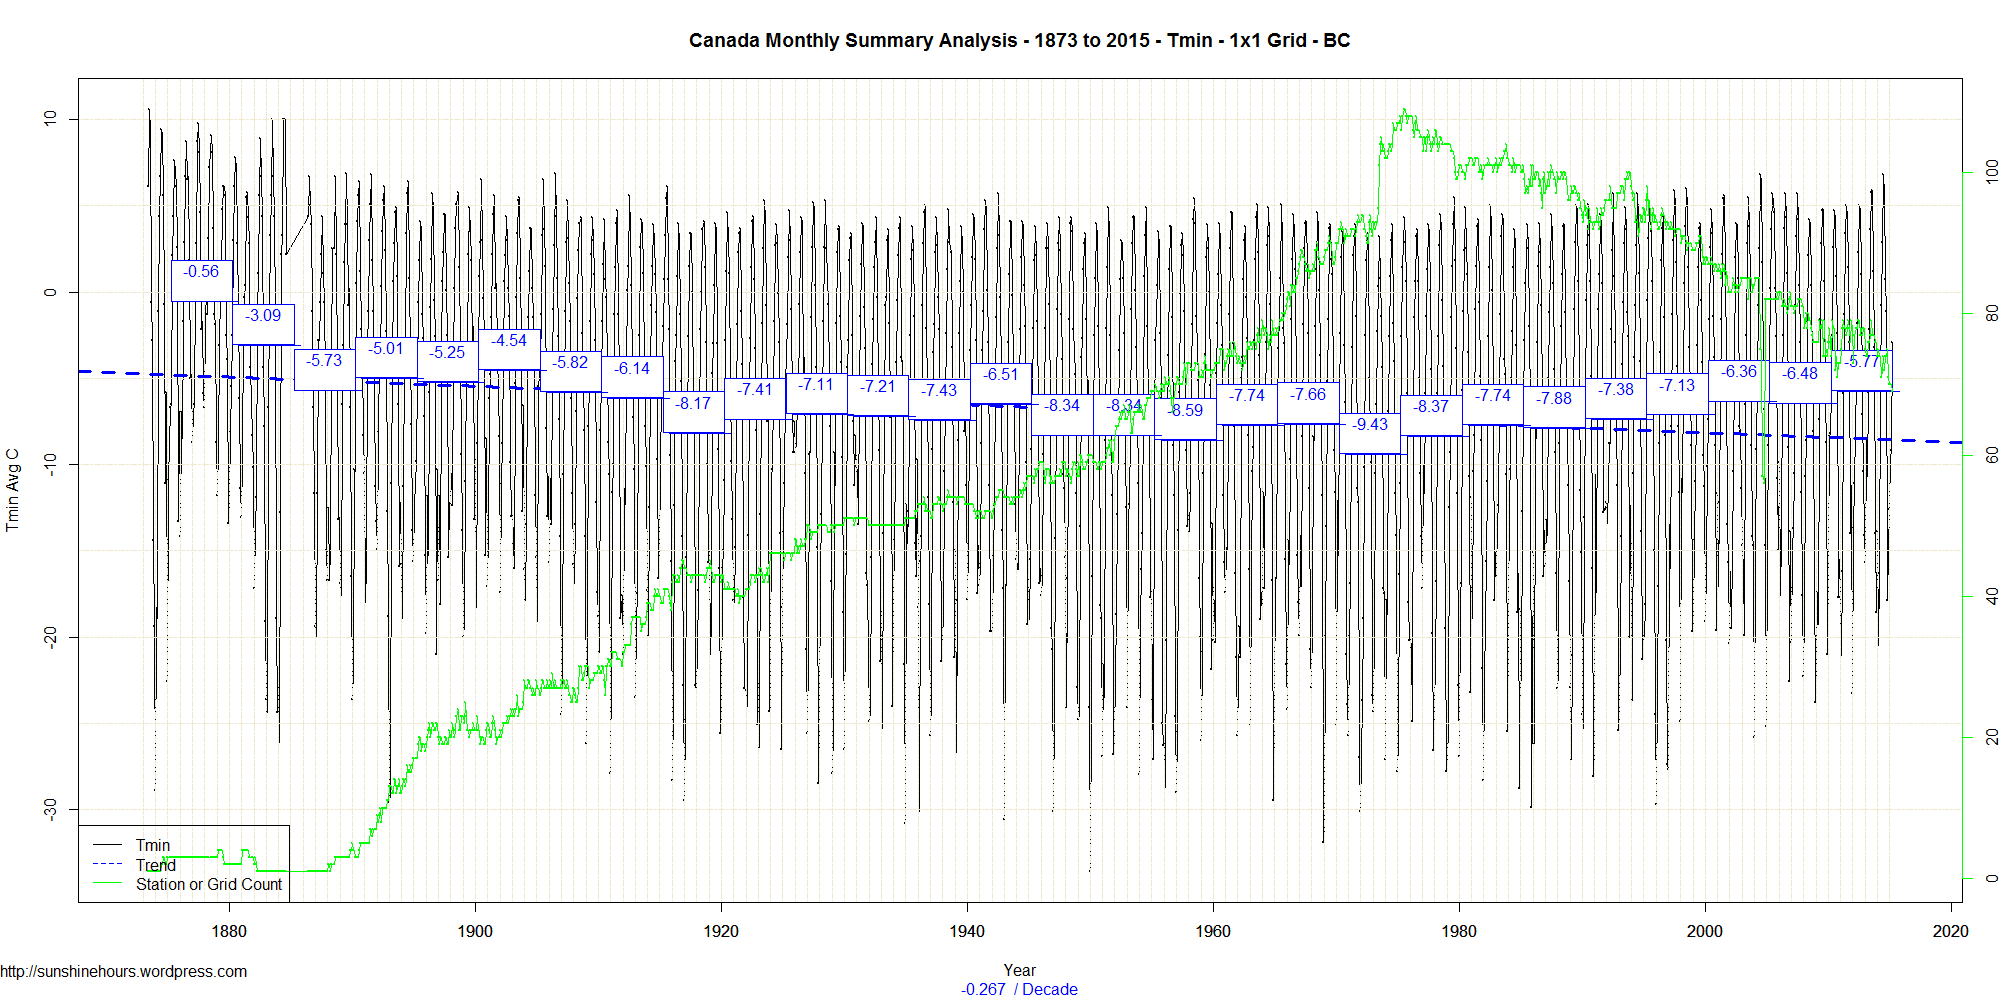
Tmin
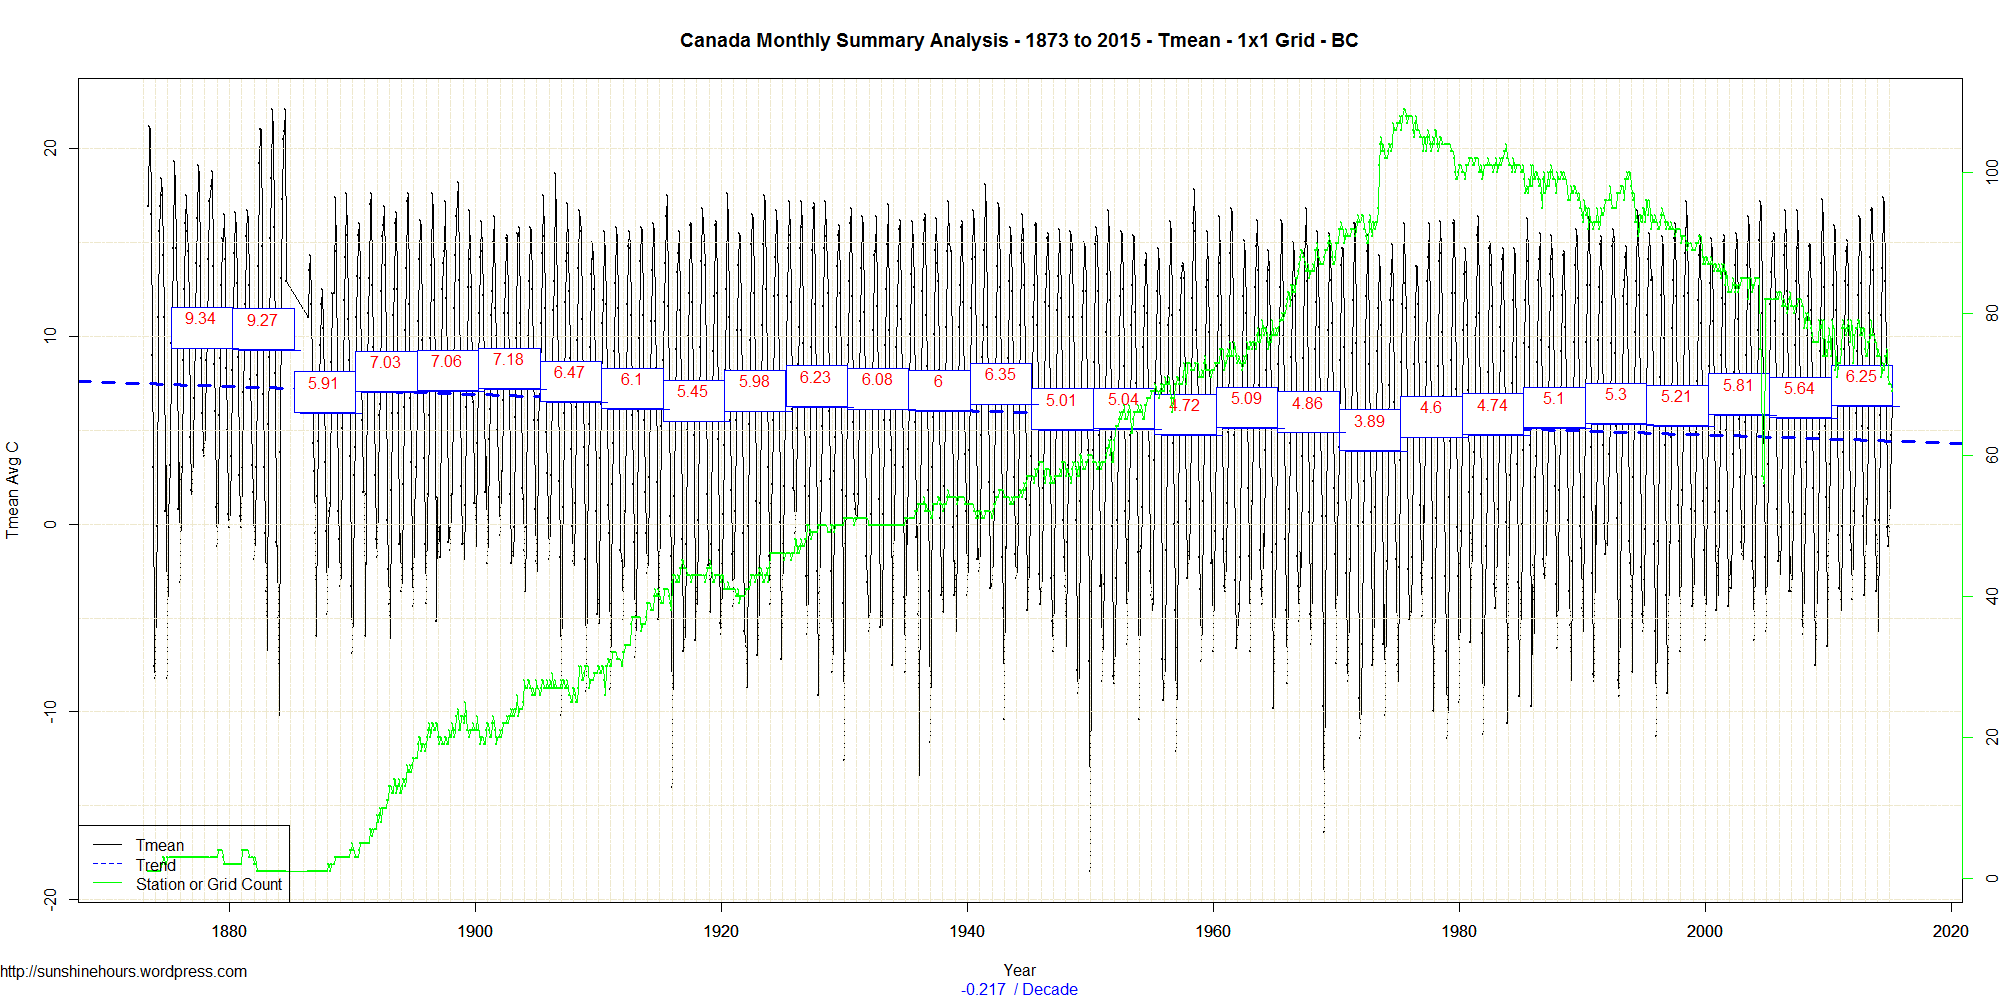
Tmean
Click for larger:
Step 1: Use Data from Environment Canada’s monthly summaries.
Step 2: Summarize the data by 1×1 grid square so no region dominates.
Step 3: Graph Tmax, Tmin and Tmean.
The black line is the monthly data. The blue boxes contain the 5 year mean (and I set the 5 year period by just going back from the most recent data in 5 year increments)
The green line is the number of 1×1 grid squares. The blue dashed line is the trend from 1873 (which is the earliest data).
(I won’t count the pre-1900 data as too important since there were so few stations)
Tmax was 1.5C warmer in the the 1920s/30s/40s than now.
Tmin now is the hottest its been since 1900.
Tmean in the early 40s was slightly warmer than now.
Tmean/Tmin has been warming since 1970 thanks to Tmin … not Tmax.
Click for larger:
Tmax
Tmin
Tmean