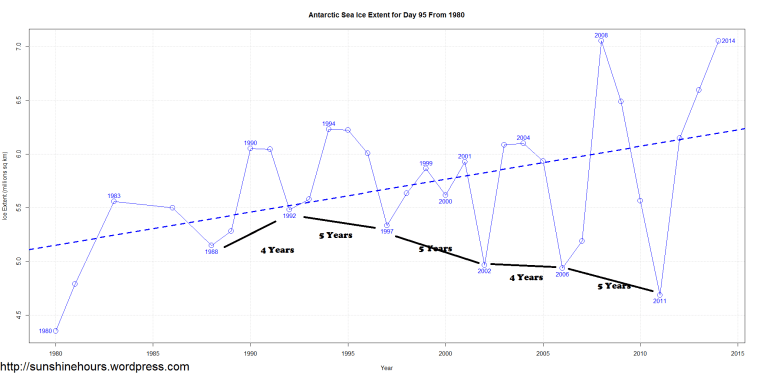
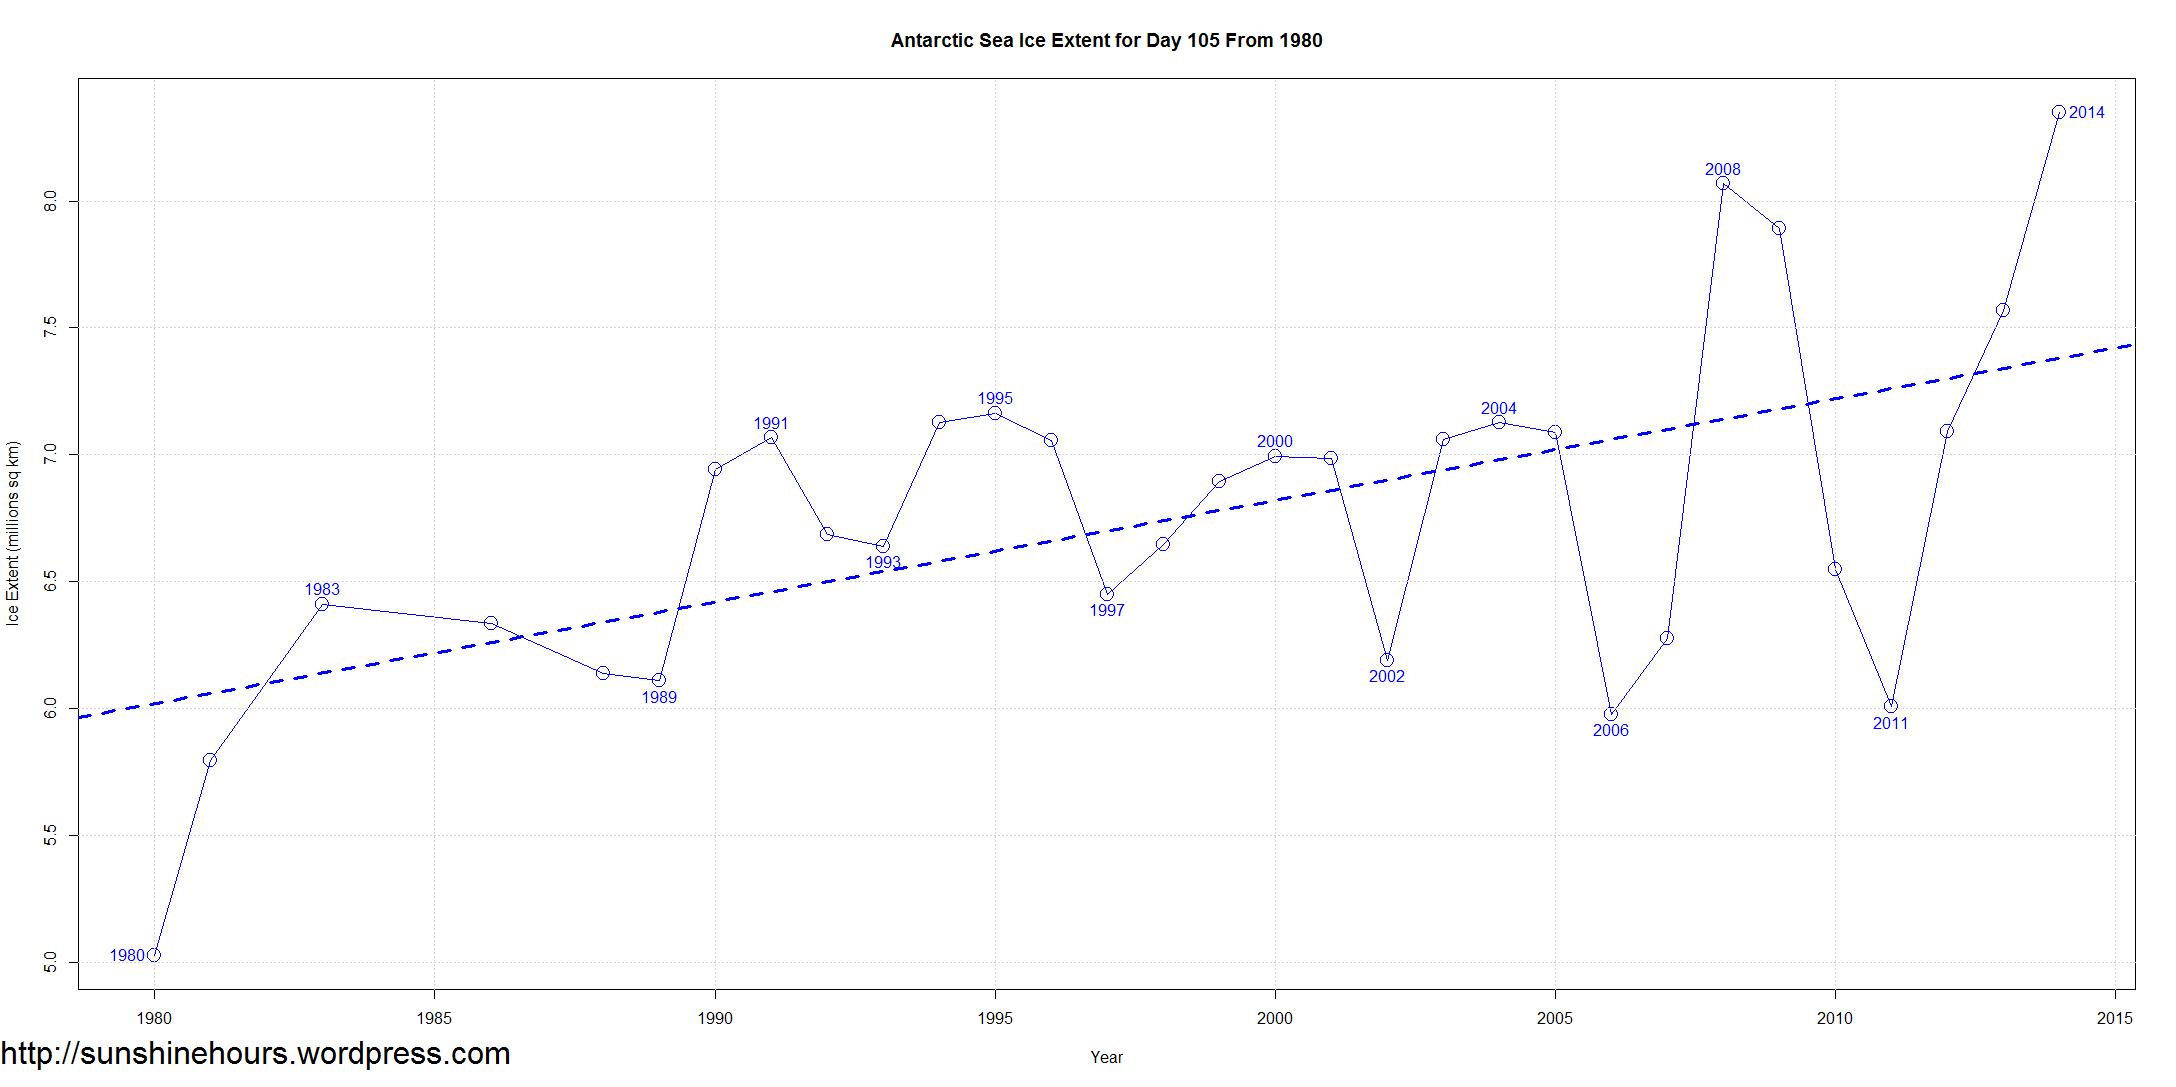
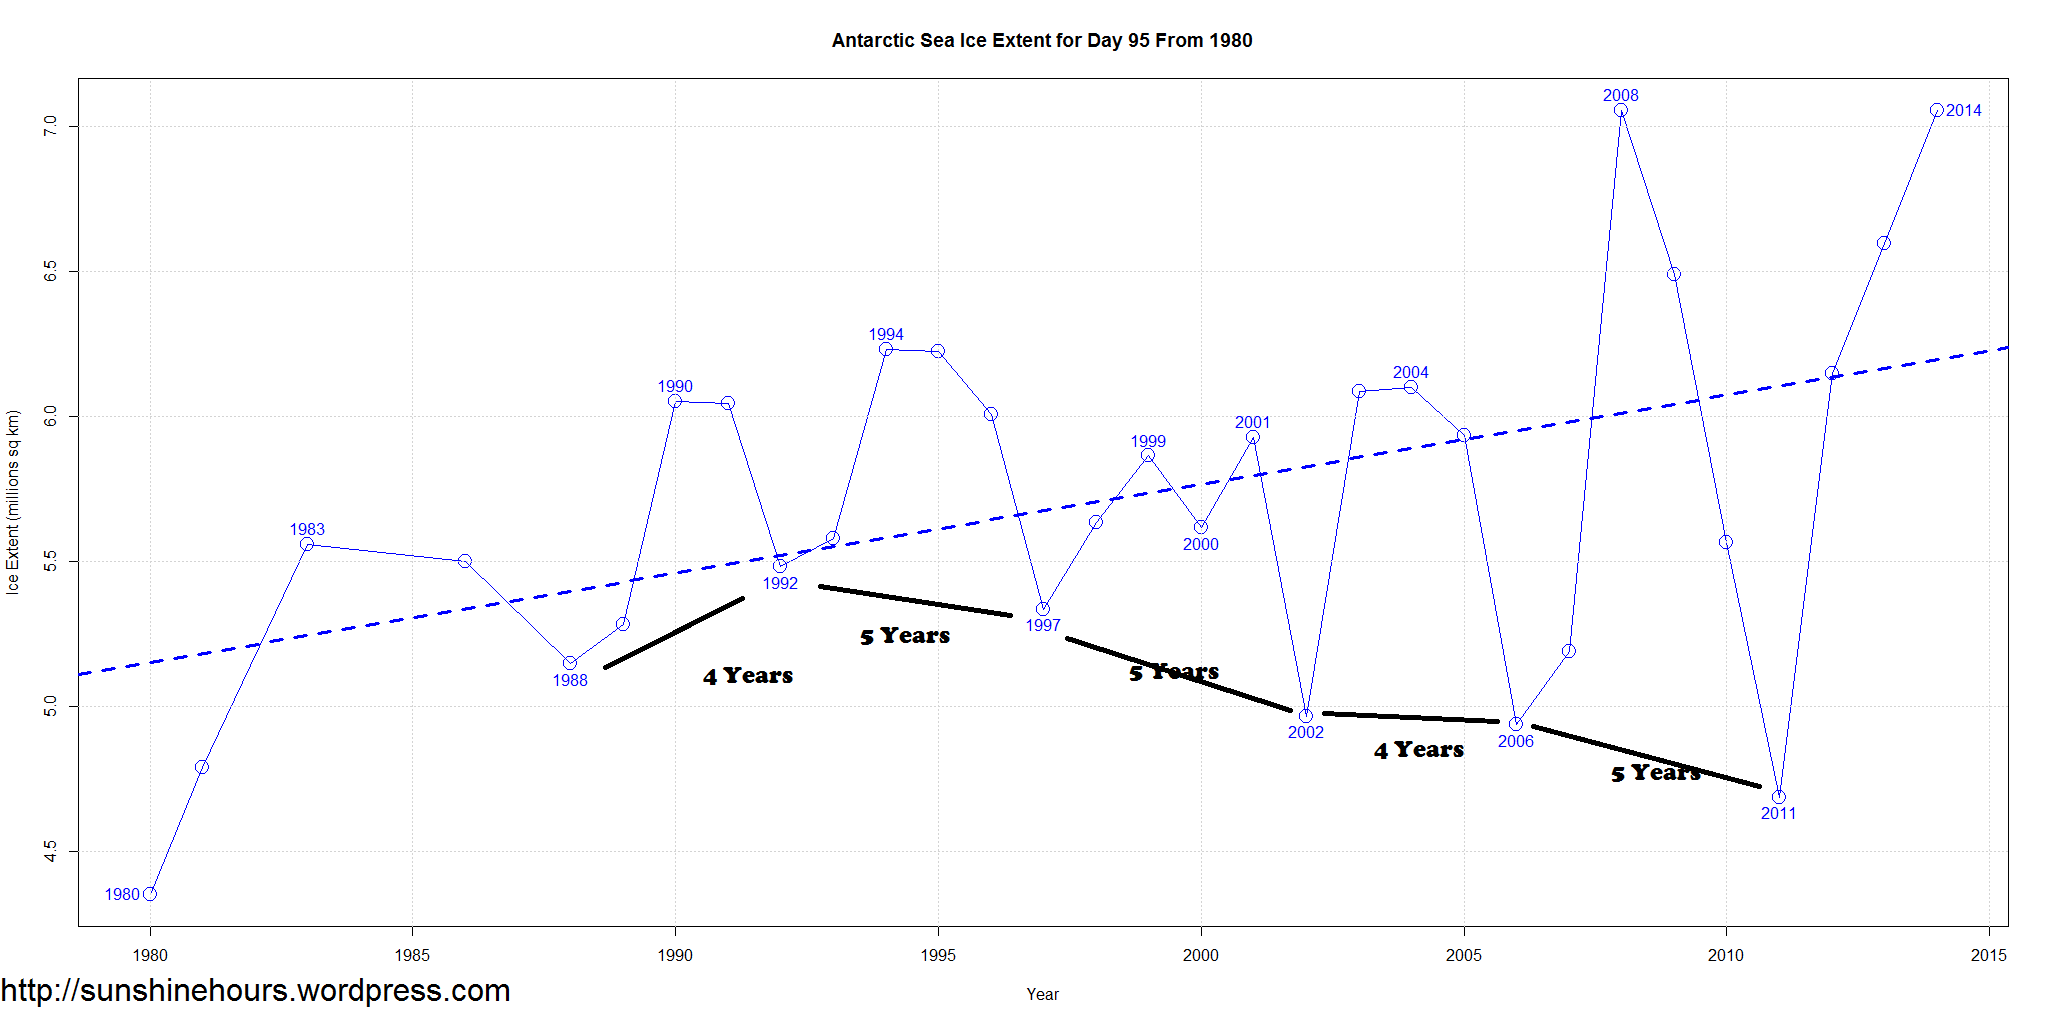
I don’t know what it means, but I’ve been aware of an oscillation pattern in Antarctic Sea Ice Extent for some time. A week or two ago I made a slight change in one of my graphs to annotate the peaks and valleys with the year and now the pattern jumps out at you even more.
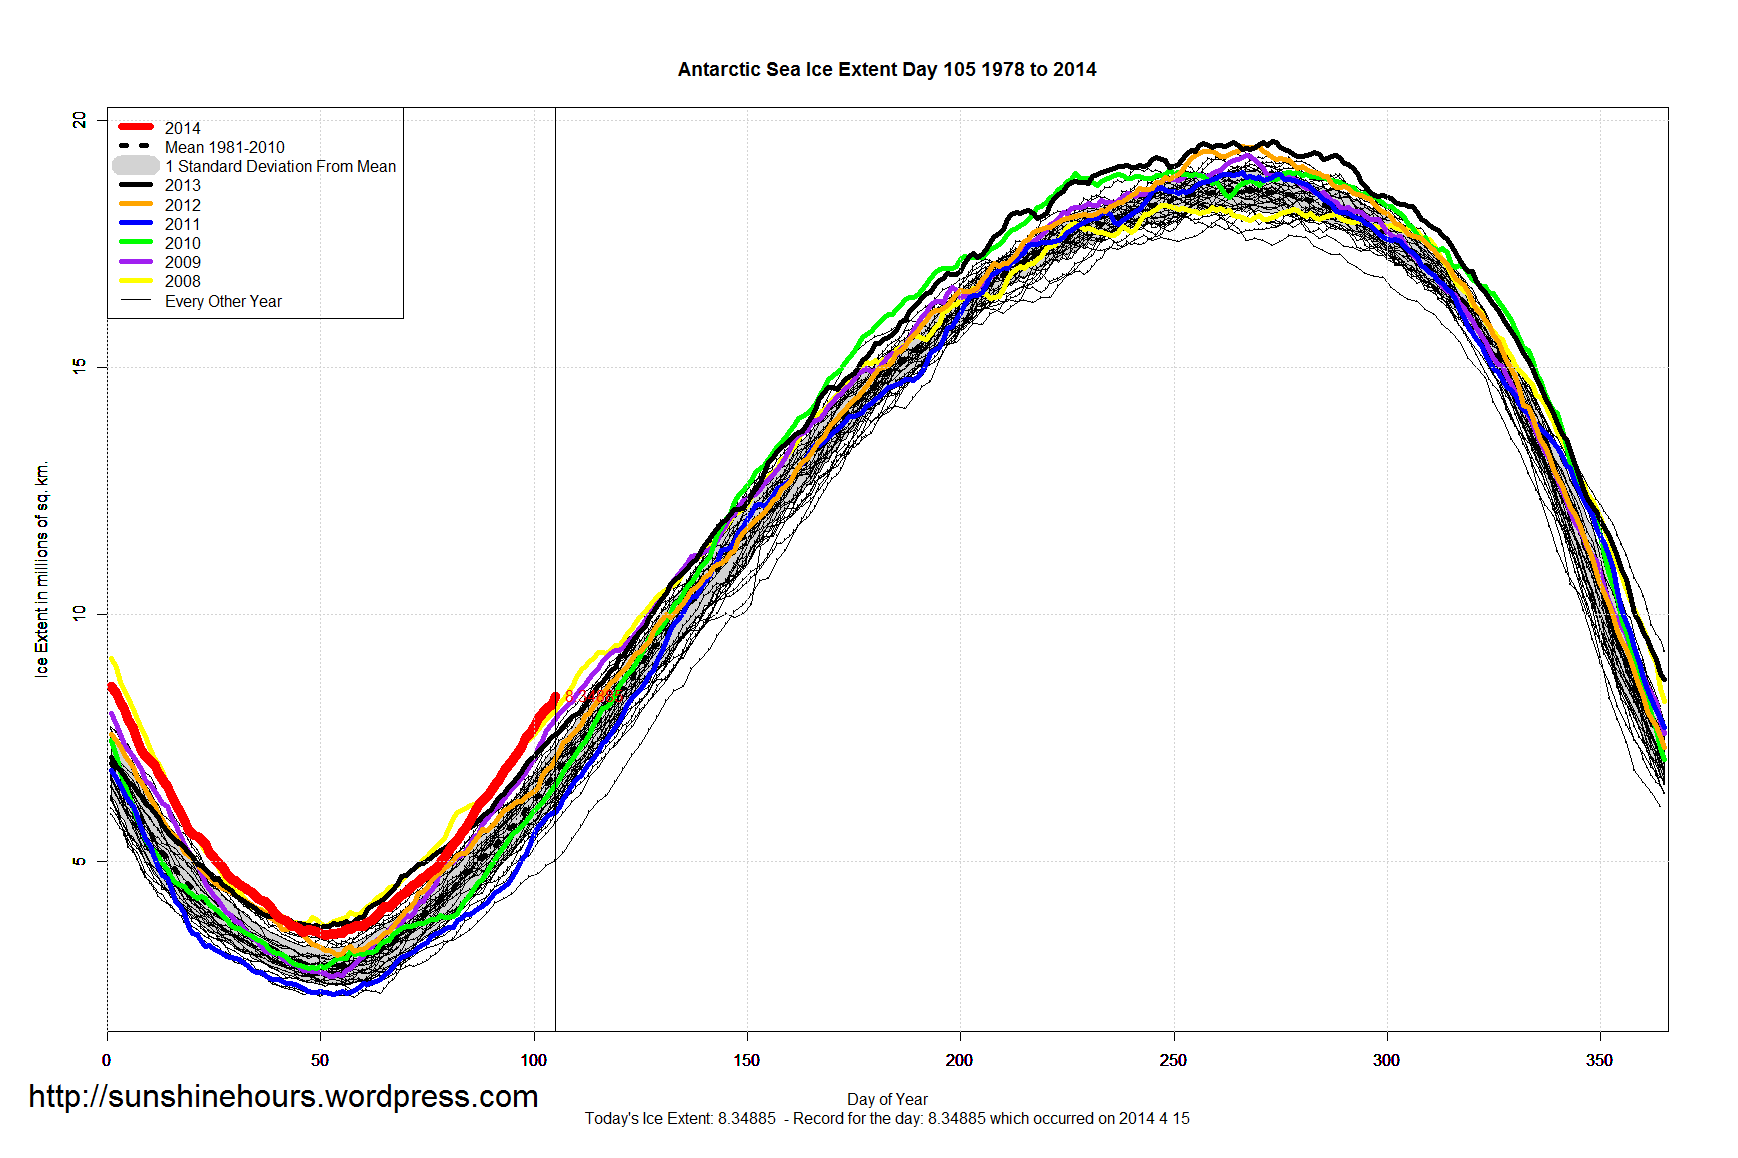
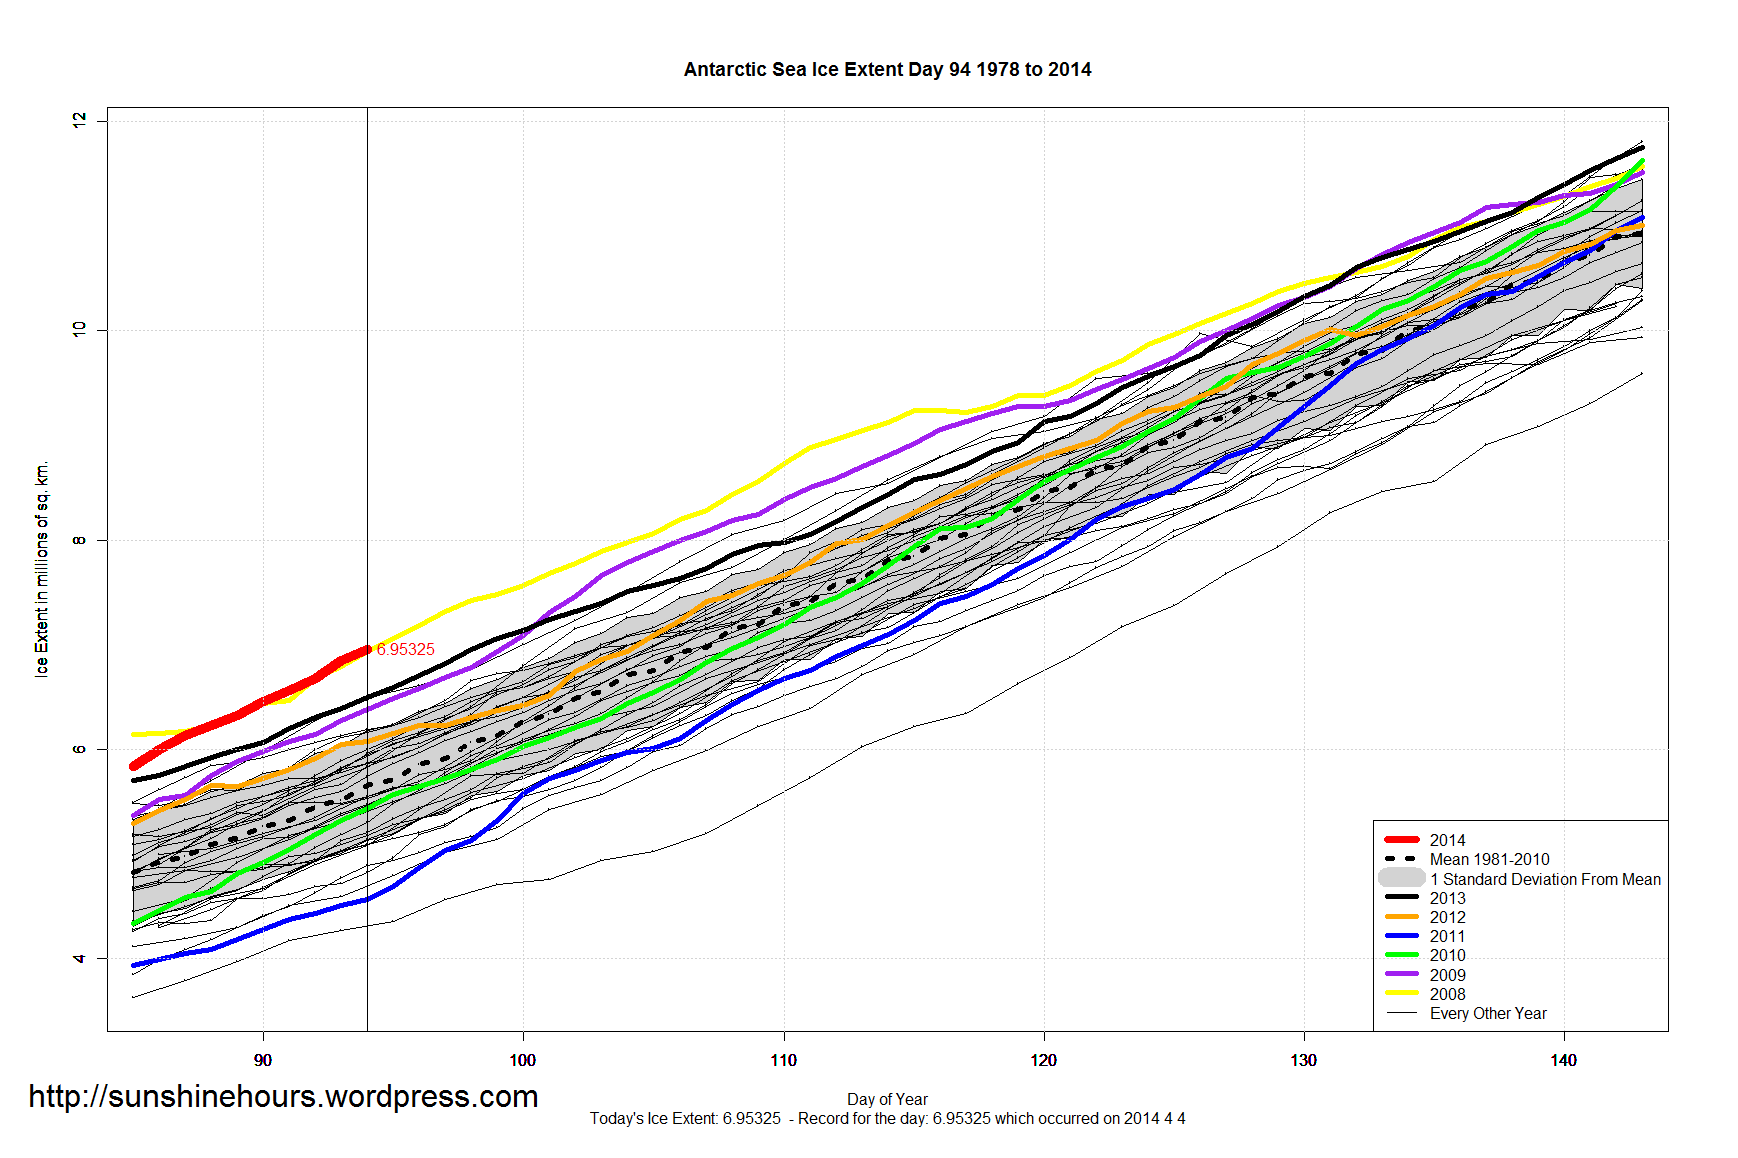
This graph is for day 95, but the pattern is similar in other parts of the year.
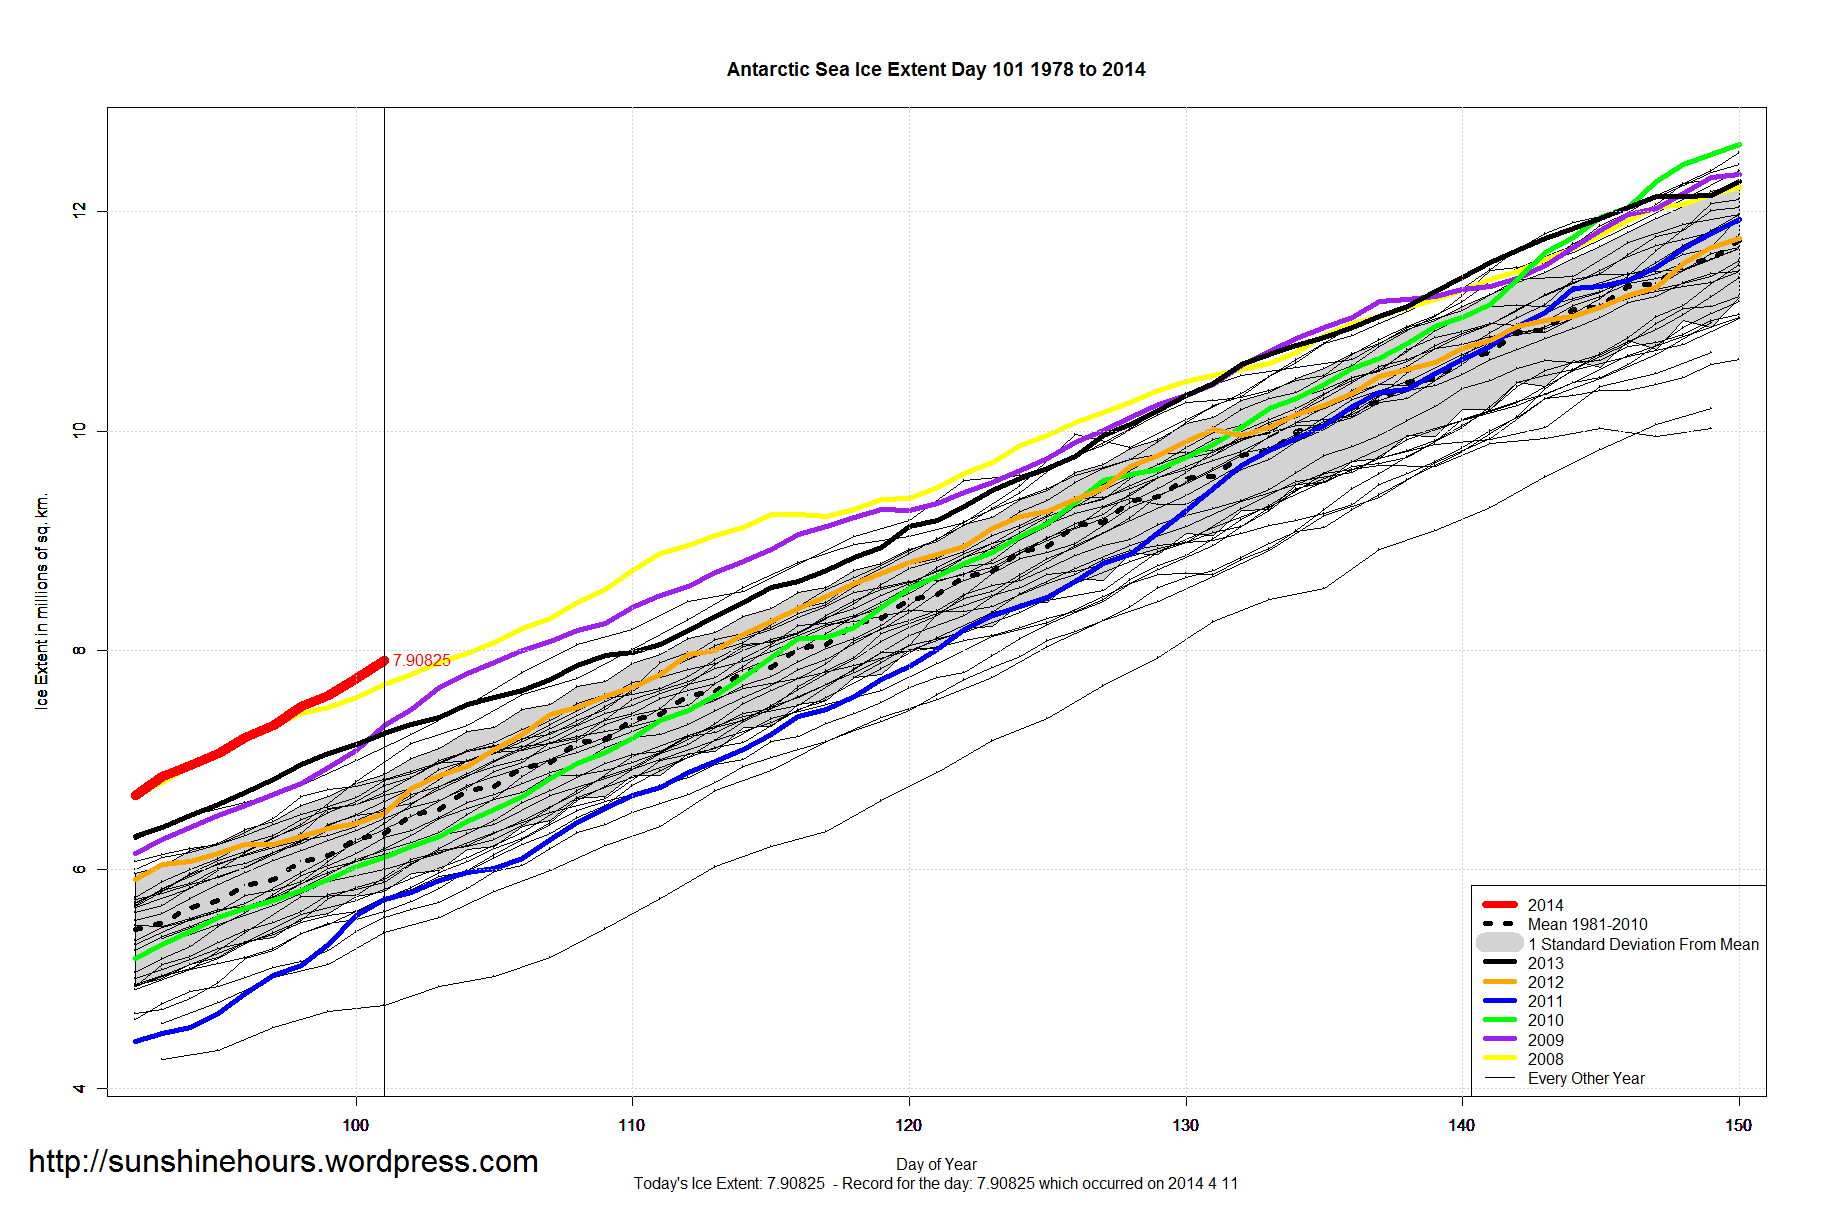
There has been since 1988 a 4 or 5 year oscillation where the ice extent goes to a valley in between peaks. And the magnitude of the oscillation is growing.
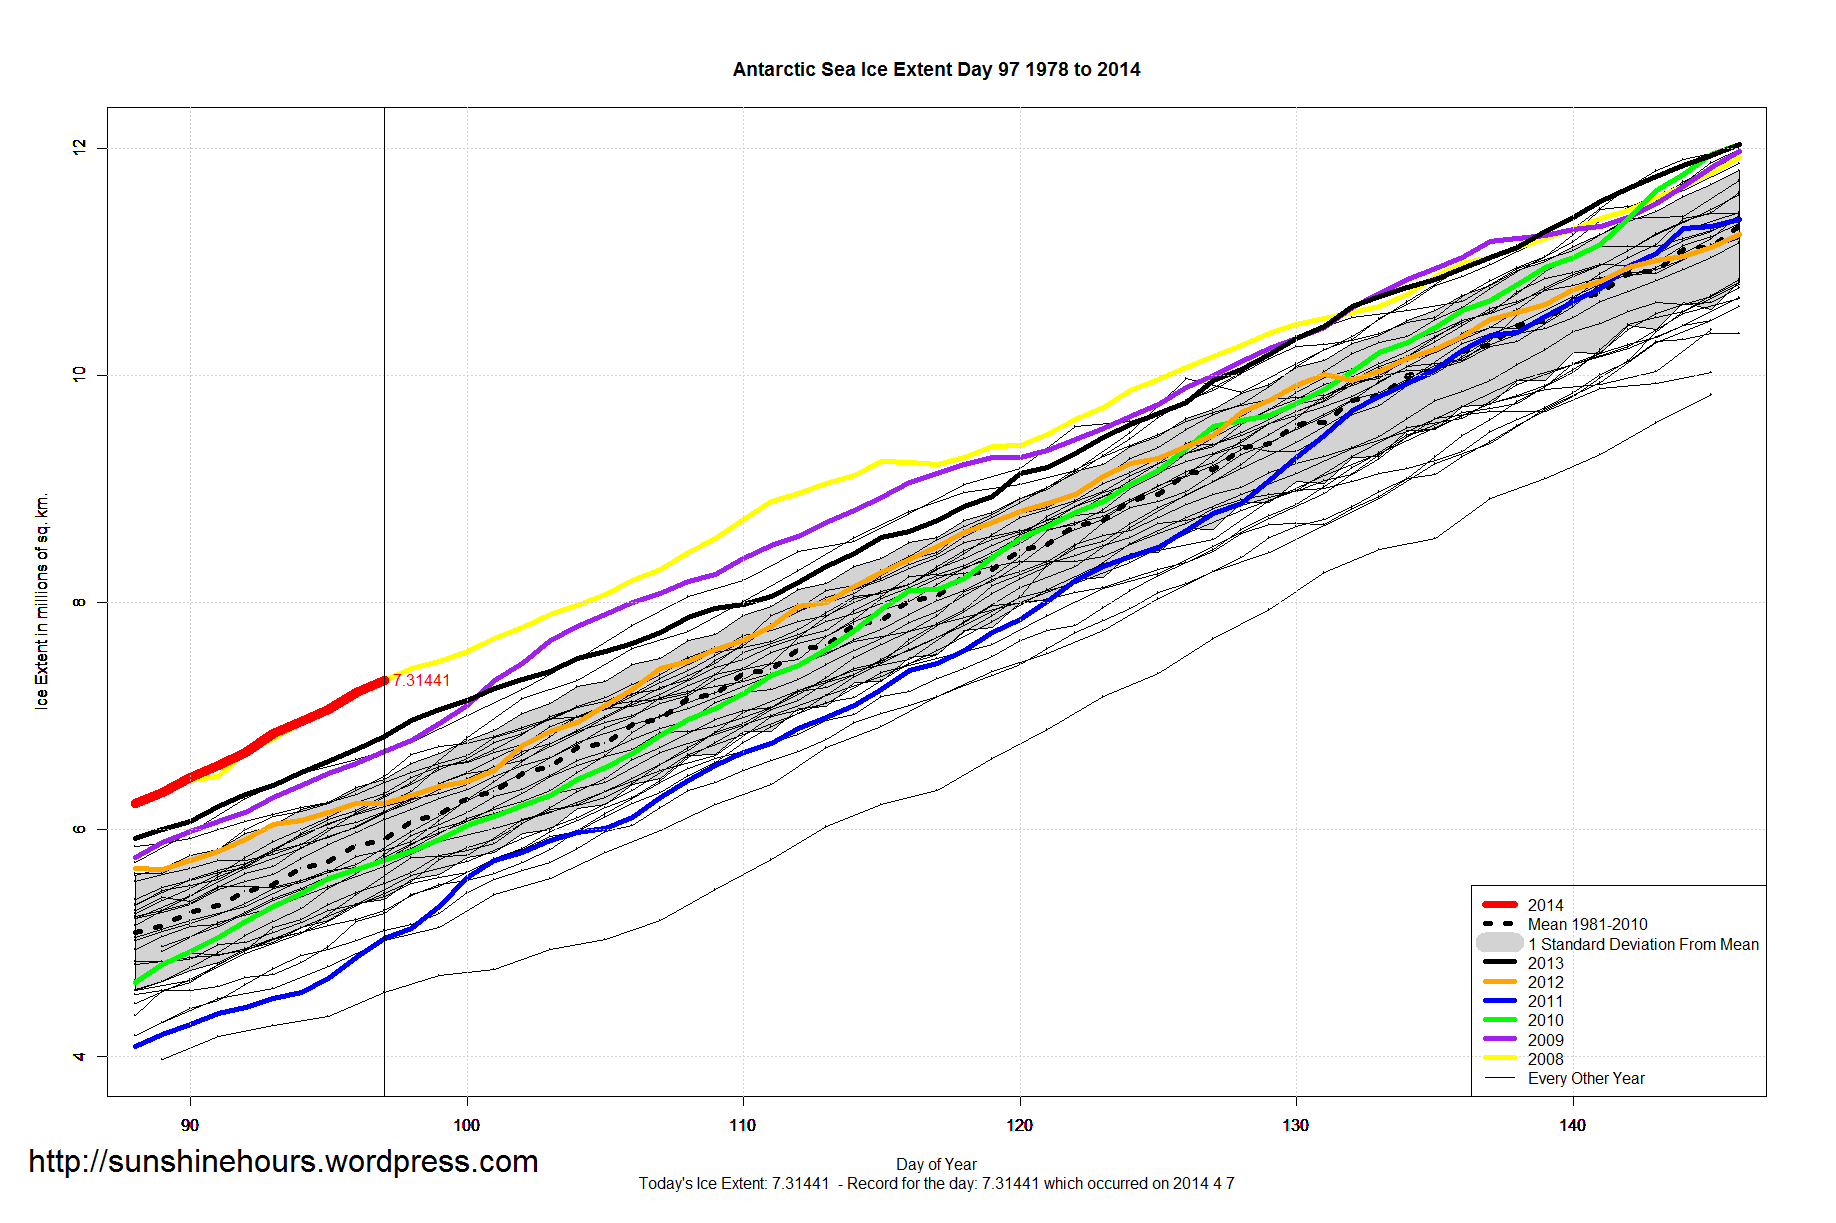
These are not small oscillations. Sea Ice Extent as of today is 7,000,000 sq km. The 2011 valley is 4,700,000 sq km. That is a 50% jump in sea ice on day 95 from 2011 to 2014.
I know the AMO has peaked and is poised to start down (it may take a few more years). But to repeat myself, I’m not sure what it means.
Click for larger.